ControlUp ONE
The AI Platform for Autonomous IT
ControlUp ONE is built on leading Digital Employee Experience (DEX) capabilities and agentic AI to watch every endpoint, desktop, app, and network in real time. It detects, decides, and resolves issues before employees file a ticket, without IT having to give up control to get there.
Try for Free Get a Demo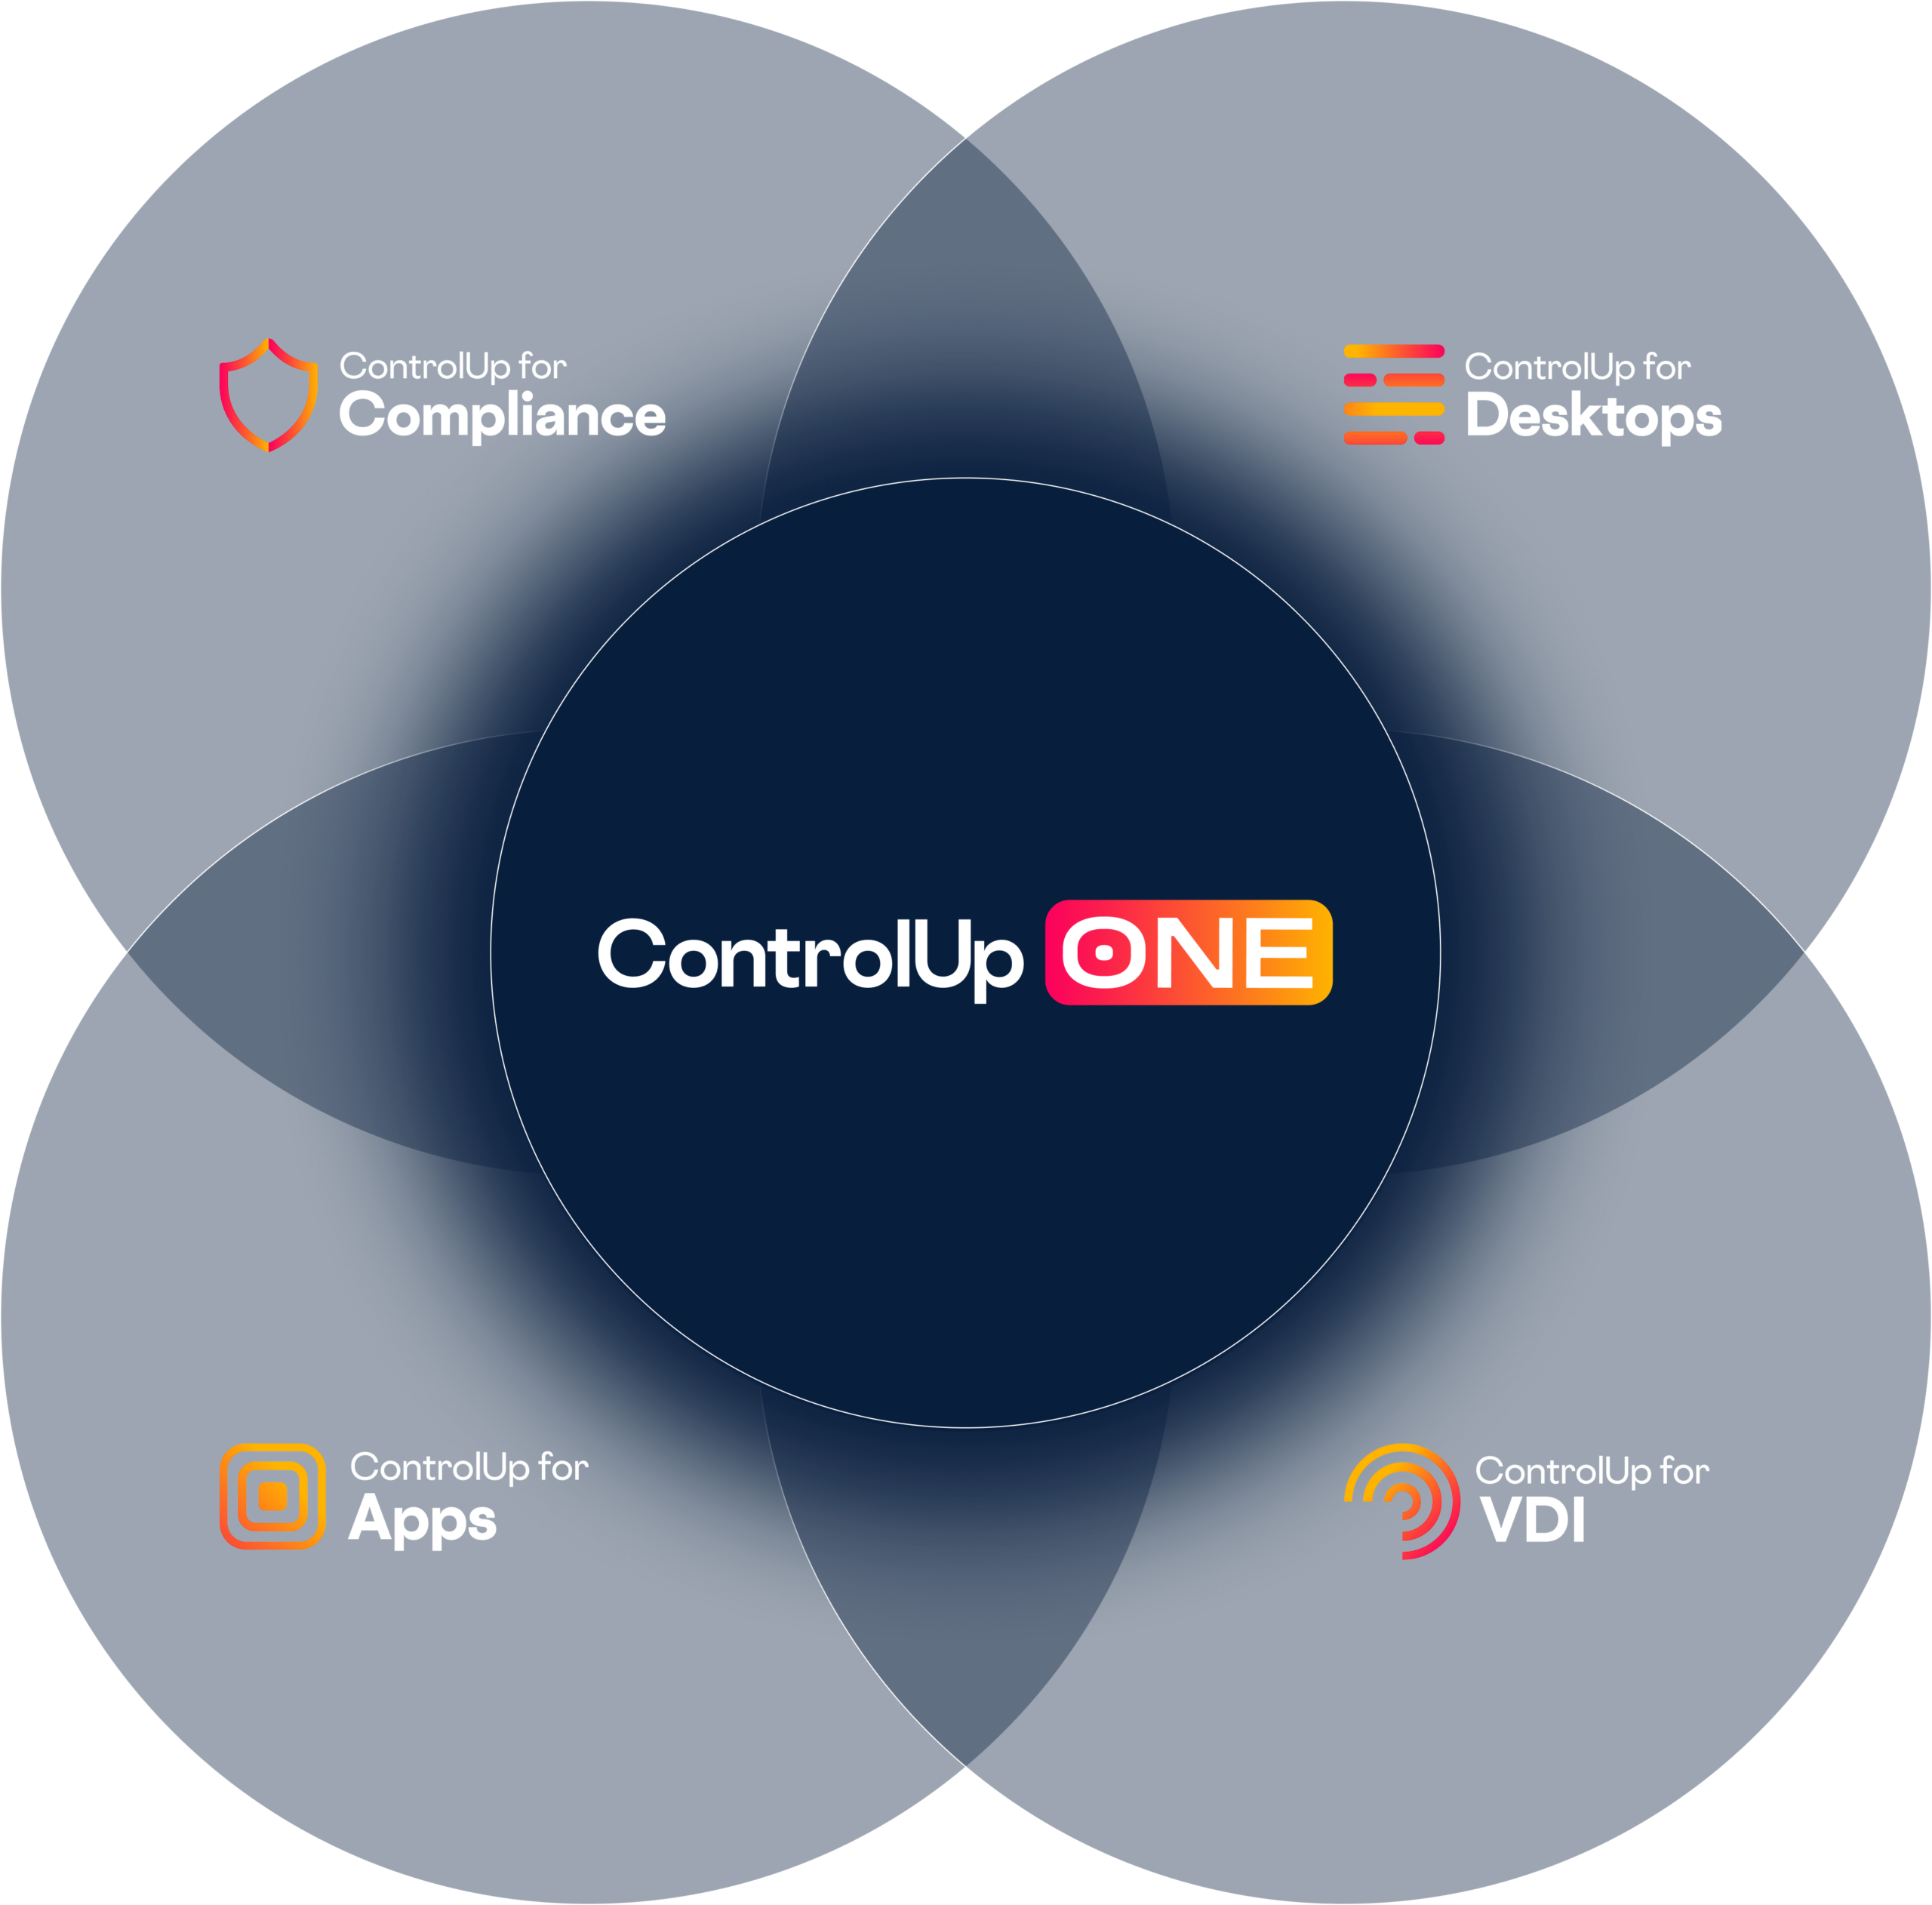

A single operational layer drives Autonomous Endpoint Management (AEM). Your digital workplace takes care of itself and your people can take care of everything else. With ControlUp ONE, real-time signals become clarity, clarity becomes action, and the right fix happens. No one has to ask.
- See: End-to-end visibility across endpoints, apps, VDI/DaaS, SaaS, and UC tools
- Understand: Our Pulse AI engine connects the dots to accelerate decision-making
- Act: No-code workflows and agentic AI handle routine fixes with IT-defined guardrails

Pulse AI turns noise into prioritized steps. Get instant root cause analysis via the in-console assistant and empower employees with IT self-service support. It's the intelligence layer that powers autonomous IT operations, closing the loop between visibility and remediation.
Explore Pulse AI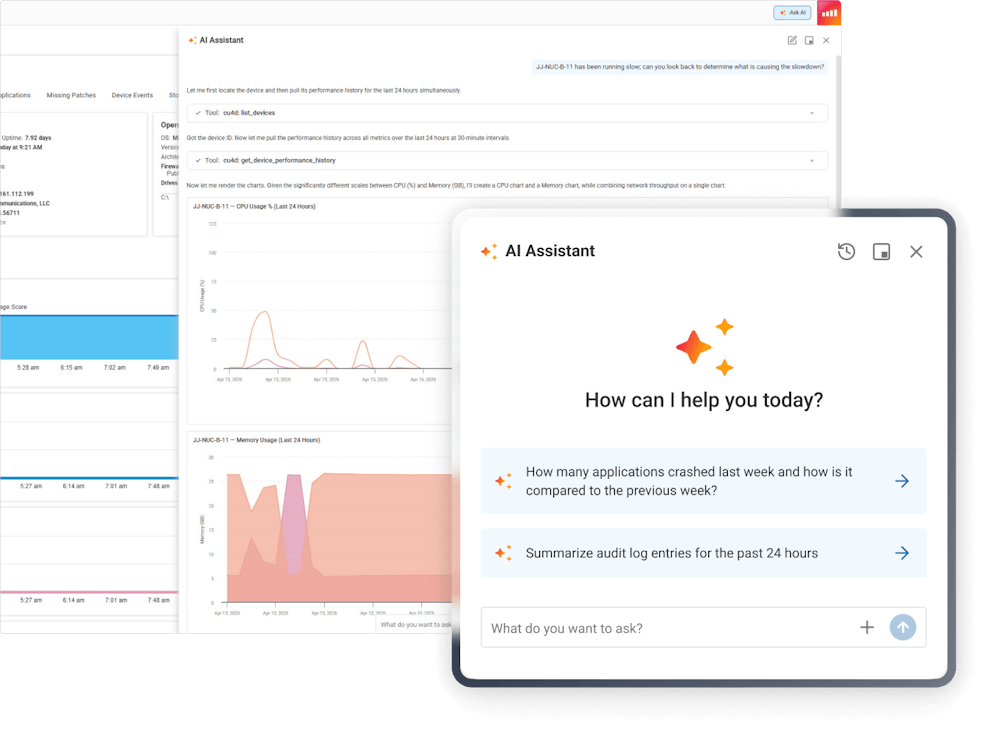

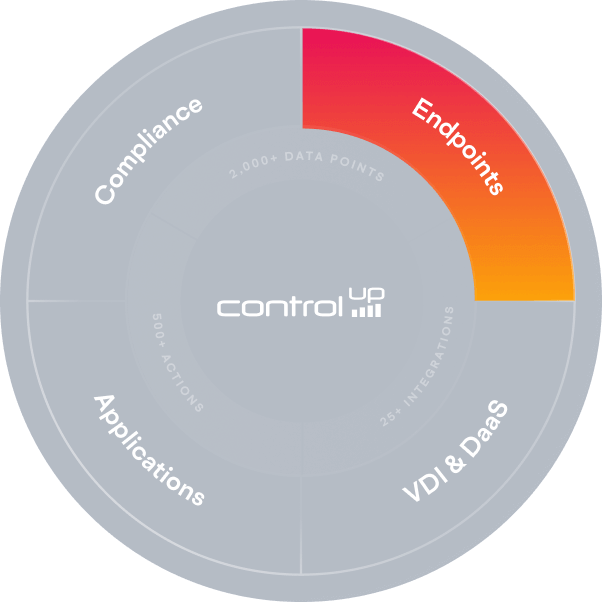


Bridge the gap between device and experience. Deep telemetry and broad OS support help IT pinpoint bottlenecks, trigger diagnostics, and automate fixes so every endpoint performs better.


Turn complex signals into actions. 24/7 end user experience monitoring, proactive synthetic testing, and AI input ensure virtual environments feel like local ones.


 ControlUp for VDI
ControlUp DaaS IQ
ControlUp for VDI
ControlUp DaaS IQ
Optimize your app stack. Monitor mission-critical UC apps in real time for peak performance, and reclaim unused SaaS licenses to cut unnecessary spend.


 ControlUp for Apps
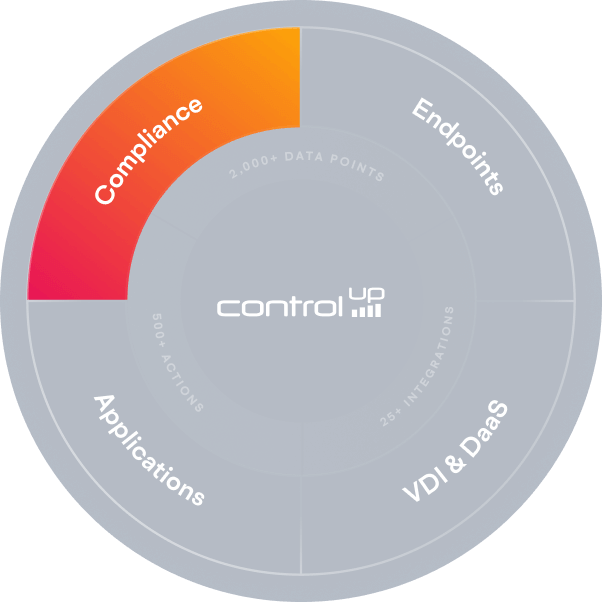
Automatically detect vulnerabilities and configuration drift, then patch and remediate across endpoints without disrupting users. Proactive IT compliance and security, delivered quietly.
ControlUp for Compliance3-second telemetry across endpoints, apps, sessions, and workspaces
Pulse AI interprets signals to accelerate root cause analysis and decision‑making
Remediation scripts run autonomously, resolving issues before anyone feels them
One operational layer across devices, VDI/DaaS, SaaS, UC, and networks

The all-in-one DEX platform for monitoring, optimizing, and securing your IT environment.


You’ve got bigger priorities than babysitting systems. ControlUp ONE handles what you want it to, giving your IT team more precision, fewer disruptions, and the freedom to focus on strategic work.
- Fewer Issues: Signals caught early mean disruptions that never happen.
- Smarter Decisions: AI guidance accelerates diagnostics and gets you to resolution faster.
- Lower Costs: Consolidate tools, automate troubleshooting, and reclaim unused spend.
- Better DEX: Deliver faster logins, stable apps, and consistent performance.