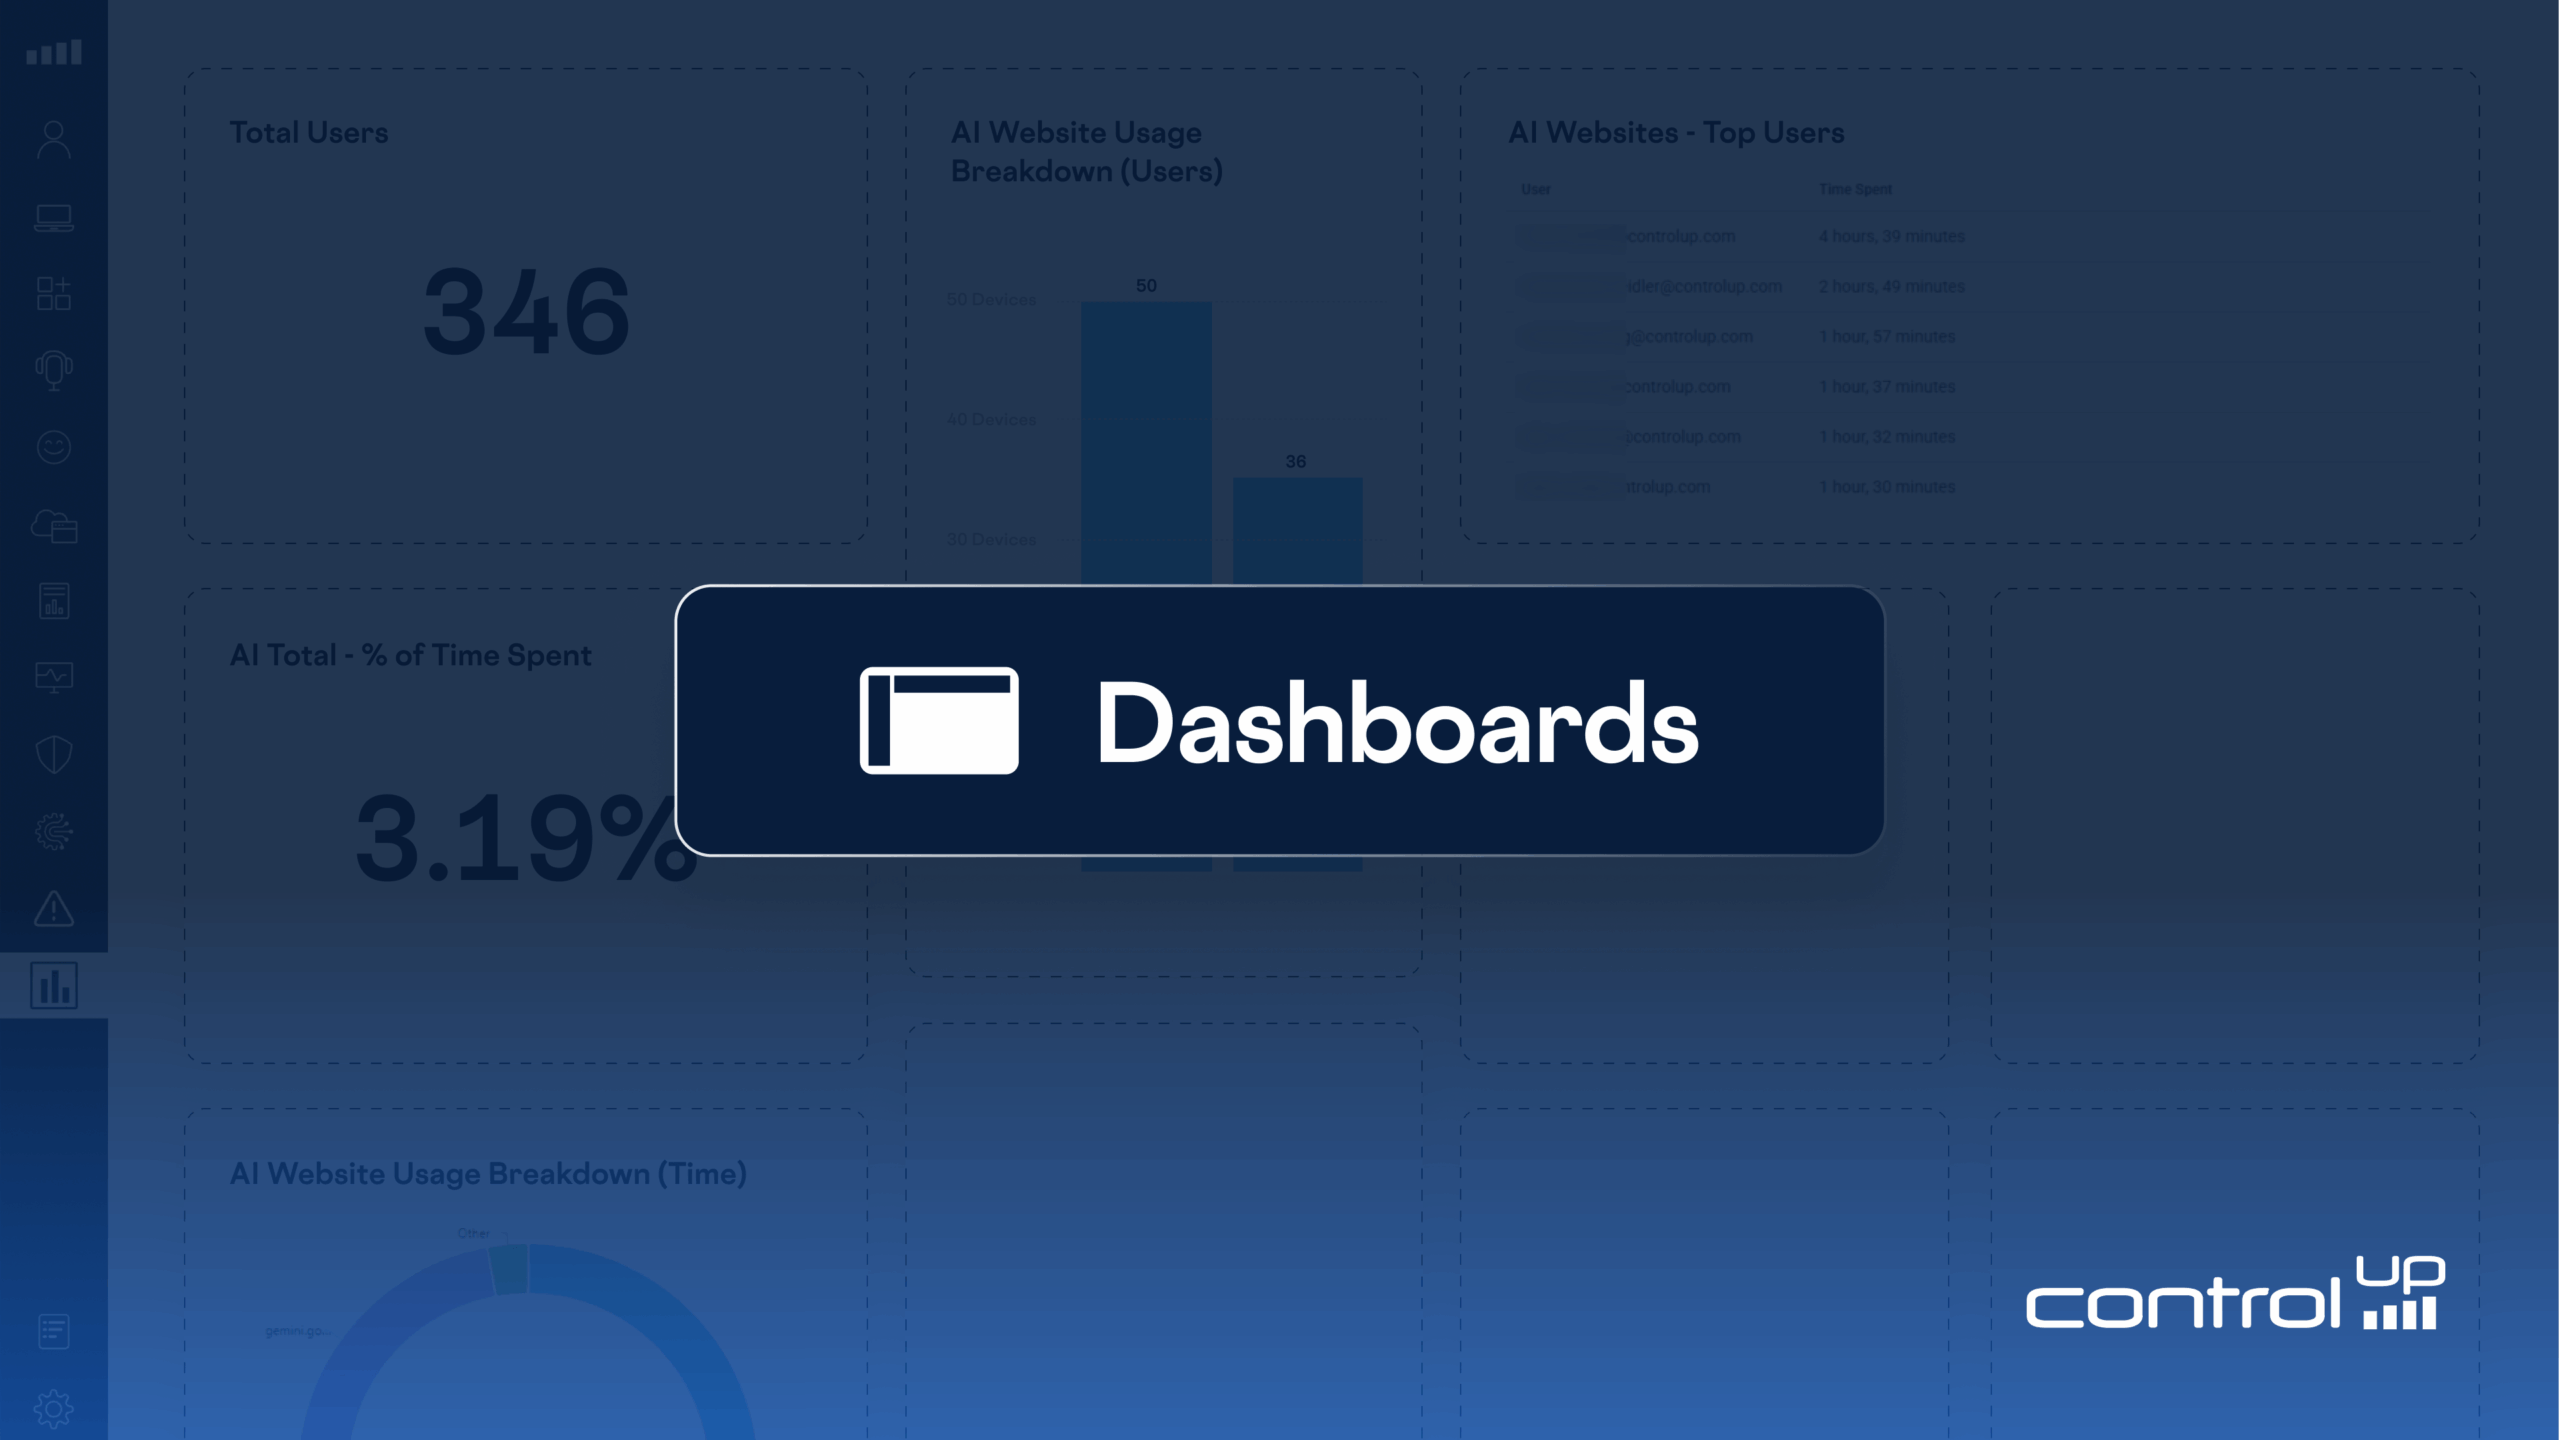
IT Dashboards and Reporting
Turn Data into Strategic Action
Stop drowning in metrics and start making high-impact decisions. ControlUp turns DEX and performance data into clear, customizable IT dashboards and reports. With tailored views and comprehensive, flexible reporting, get the strategic clarity you need to drive continuous improvements and smoother workdays.
Try for Free
Get a Demo
Actionable Insights to Improve IT Operations

Get high-level insights into the health and performance of your digital workplace to understand what issues are impacting your business and where to focus your IT operations efforts.
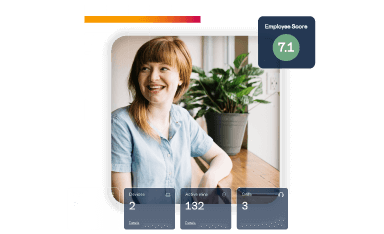
- Employee experience: Our employee experience dashboard is the best starting point for every digital workplace leader or IT admin. It provides a high-level, over-time view of the digital employee experience in your environment.
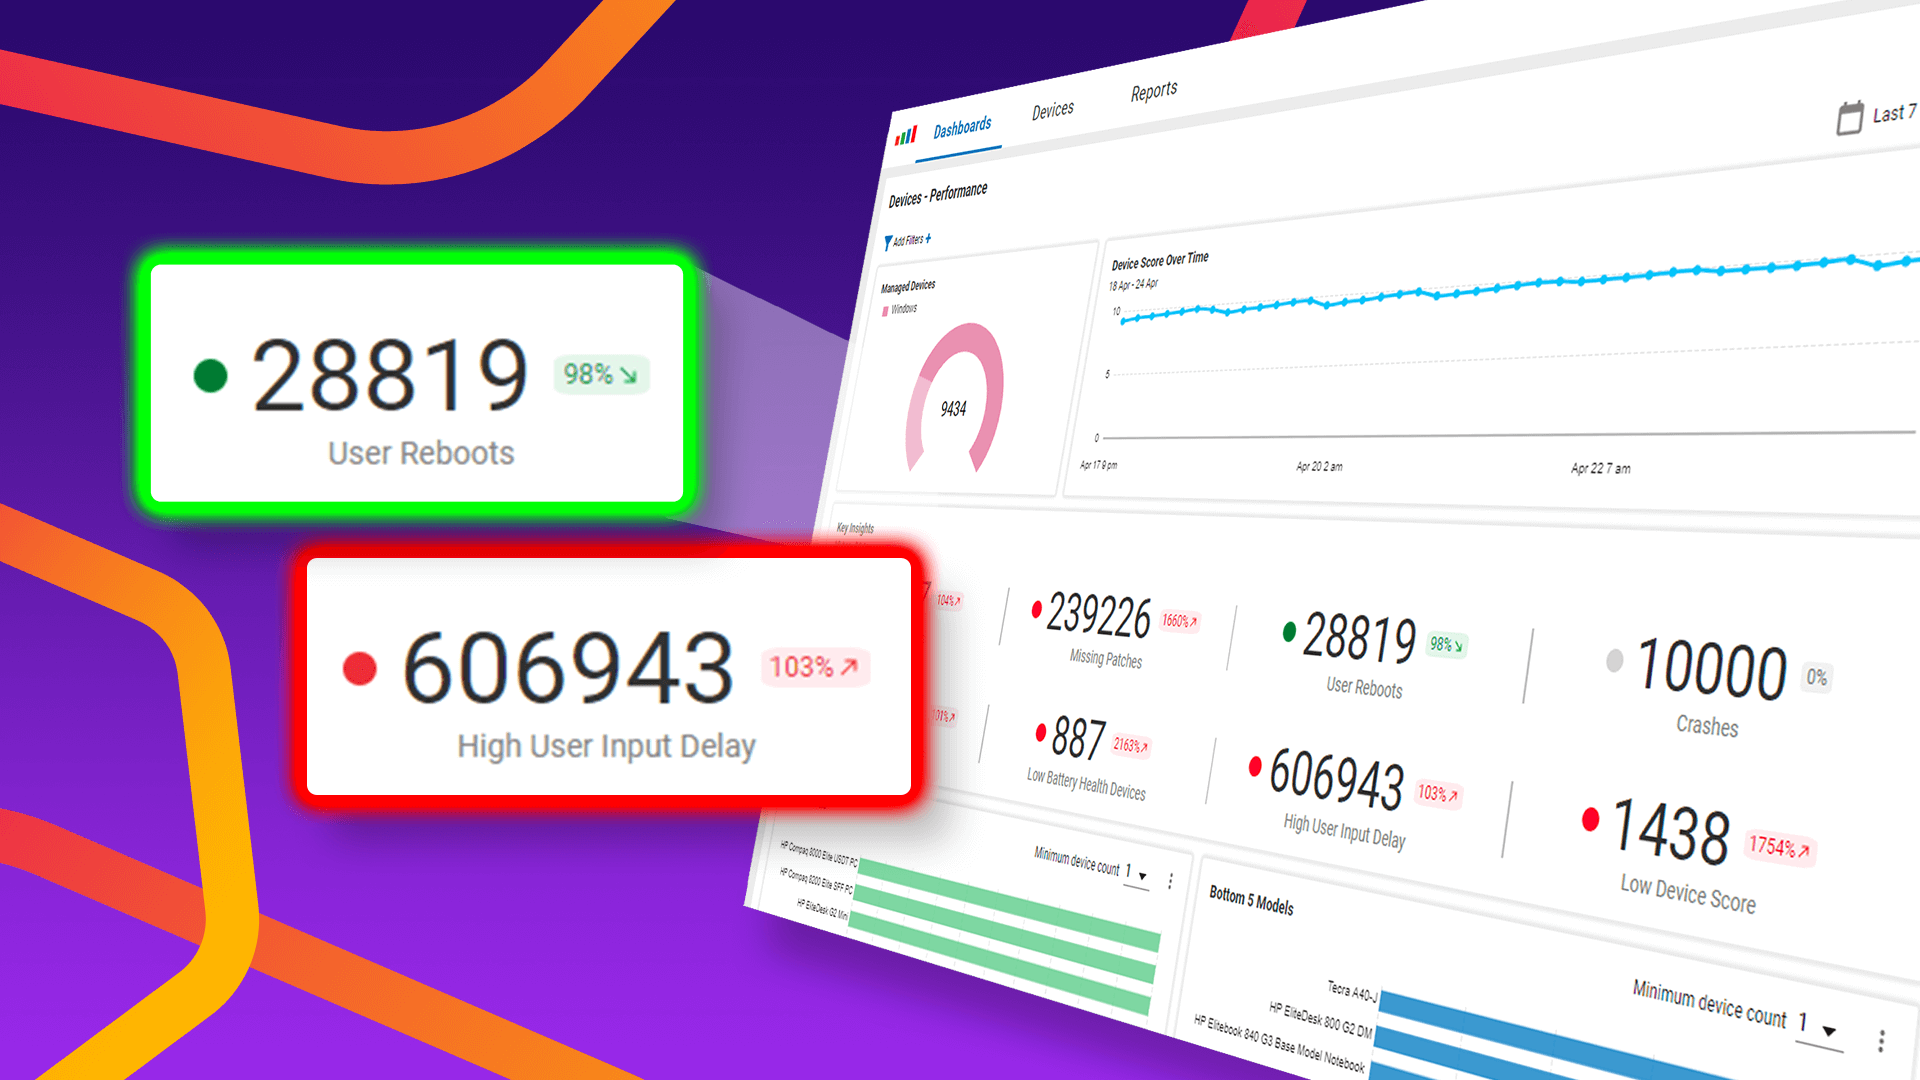
- Health and performance: Color-coded, easy-to-understand dashboards provide insights about where technical issues might be impacting employees, regardless of desktop, application, or location.
- Geographical insights: Maps with granular filtering capabilities are available across the platform to determine if specific locations are impacted or if issues are isolated to certain groups of users, including remote workers.
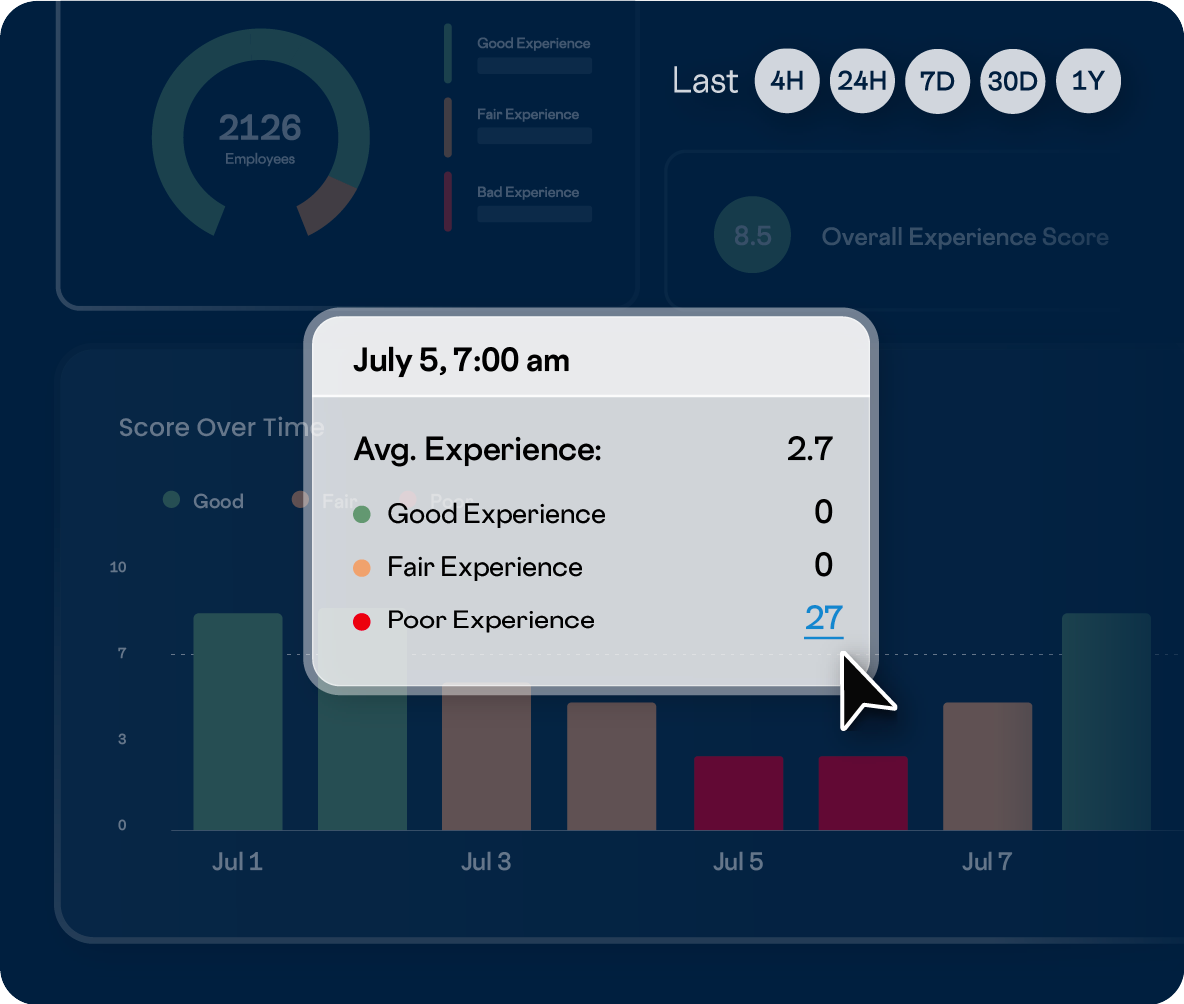
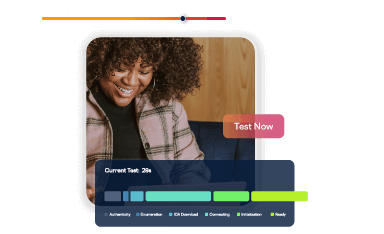
Get the details you need to start IT troubleshooting efforts by drilling into the issues affecting your employees with list views, detail views, and in-depth reporting.
- Contextual drill-down: High-level dashboards, maps, and topology overviews provide clickable widgets, location markers, and technology connectivity. This allows you to quickly navigate from top-level insights into relevant details required for root cause analysis.
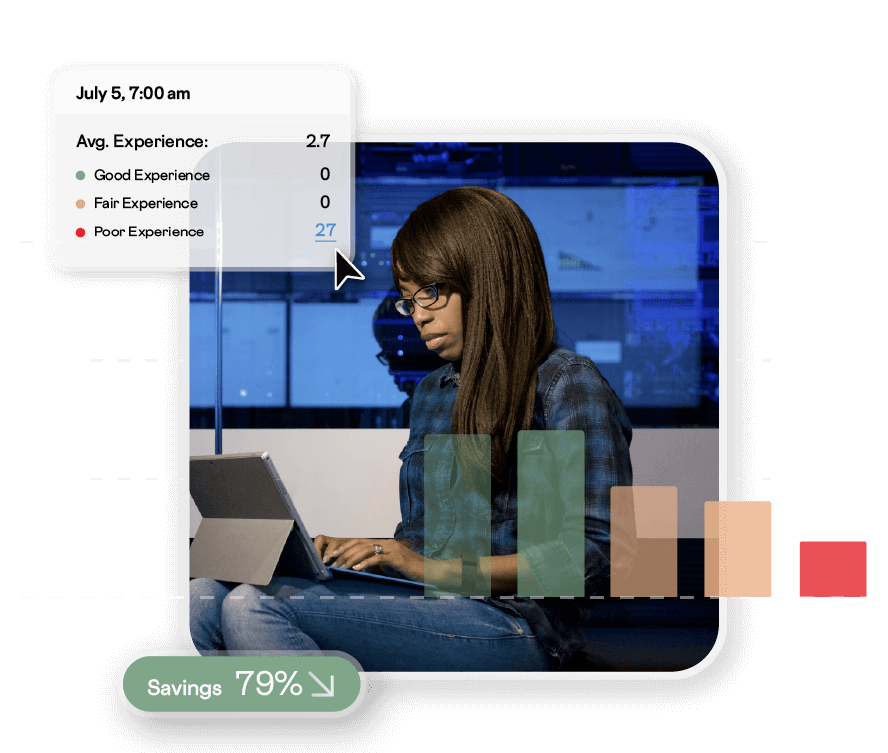
- Real-time and historical: See performance metrics and events in near real-time or go back up to a year across physical and virtual desktops, applications, and networks to truly understand the root cause of digital experience issues.
- Detailed reporting: Built-in and customizable reports are available to analyze and share the health of your environment. You can export data through the UI or API to deliver ControlUp’s in-depth data to other teams or into other tools.
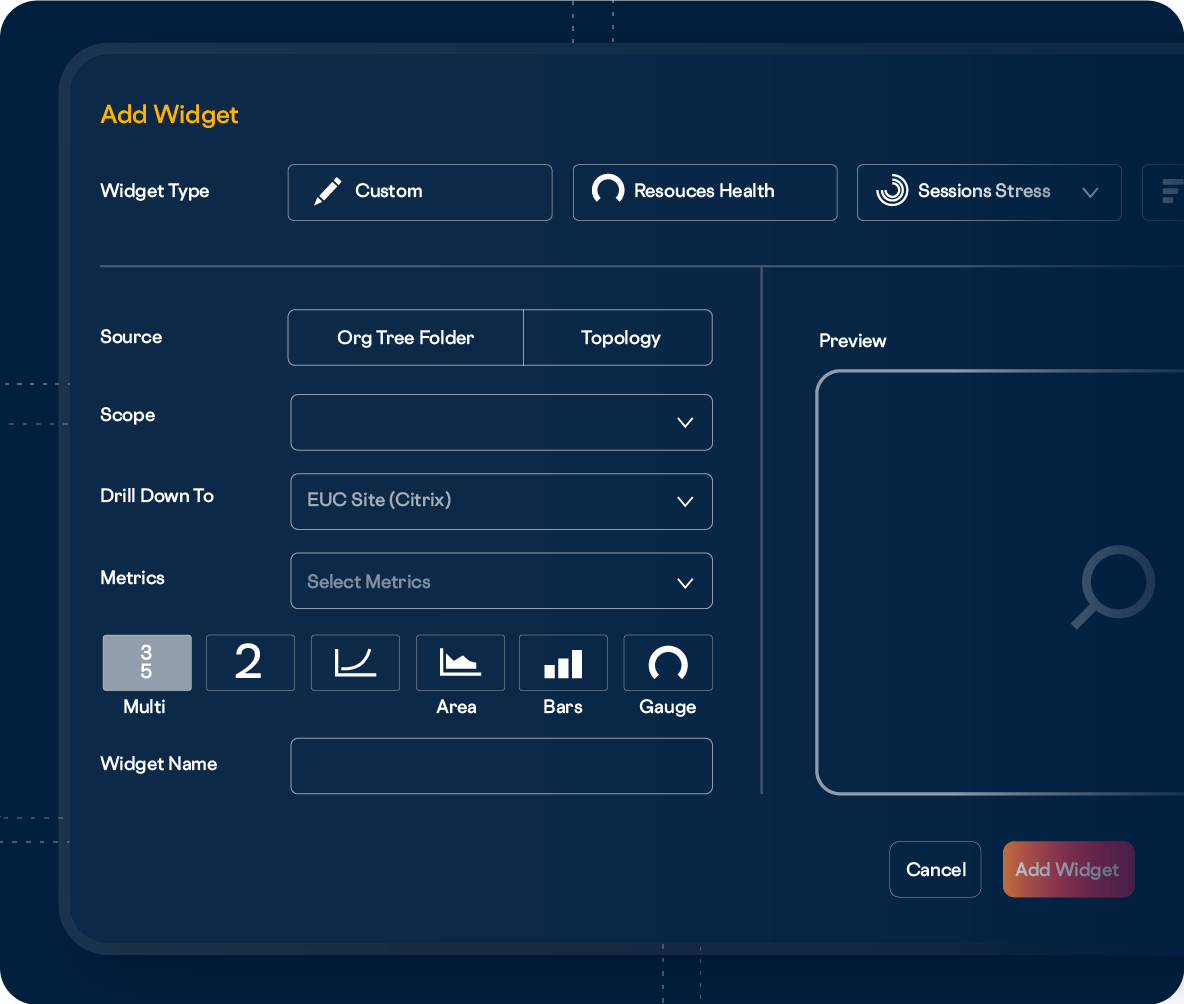
Whether you need an everyday troubleshooting dashboard or a strategic IT operations dashboard with reports for cross-environment clarity, robust customization options help deliver the right data to the right people. Gain the flexibility to showcase your unique environment and empower every team member.
- Start with pre-built dashboards: Access 14 out-of-the-box views (including Device Inventory and Microsoft Copilot+ Readiness) for immediate value without configuration.
- Customize dashboards & views: Use any pre-built view as a starting point to duplicate, modify, and filter for your workflow. Shape data with transformations (aggregations, filters, math) and optimal visualizations (Stats, Gauges, Charts).
- Configure from scratch: Build completely tailored views to address unique use cases. Define powerful widgets, choose a layout, and build interactive variables to switch your entire dashboard view with a single dropdown filter.
- Programmatic and external access: Access the full data set programmatically via APIs for use outside ControlUp ONE, or use custom scripts to retrieve metrics beyond the thousands collected initially.
- Community-driven content: Leverage the wisdom of peers by deploying powerful, peer-tested views, such as the Big Screen Dashboard in ControlUp ONE for instant, proven insights.
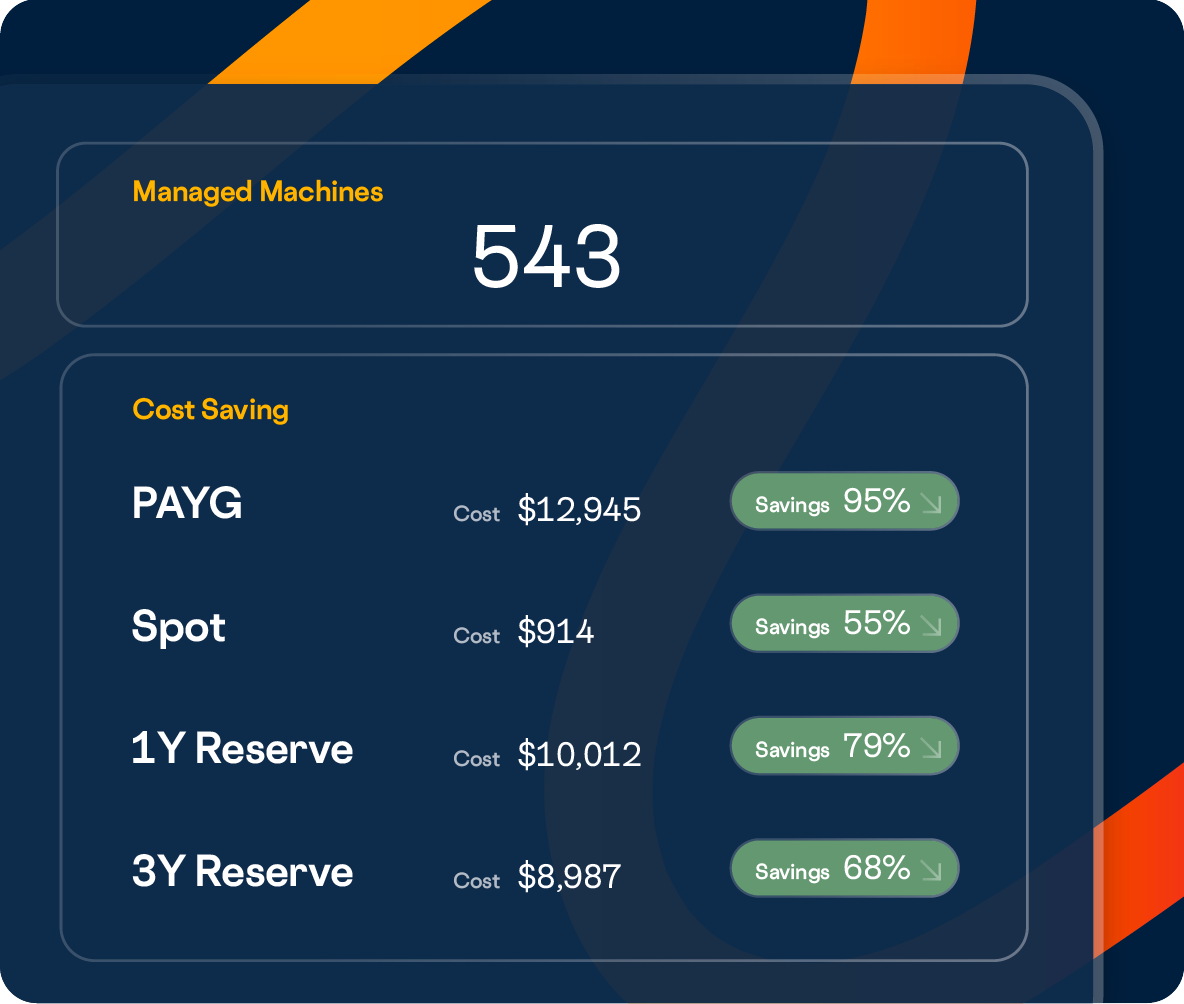
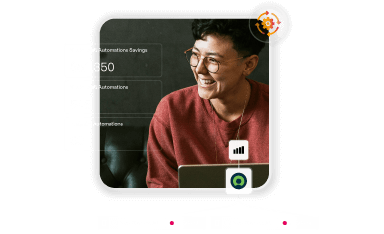
Cost savings insights and recommendations can help IT teams maximize their IT budget and help you understand ROI.
- Cost savings dashboard: See how ControlUp lowers your IT spend with insights into the value of key features, including remediation and troubleshooting actions, automation capabilities, and built-in remote assistance.
- VDI and DaaS cost optimization: Evidence-based sizing recommendations for your on-premises VDI infrastructure and your Azure-based DaaS resources help optimize environments and reduce IT spend.
- Application usage monitoring: Detailed insights into application usage across your environment empower better decisions on application licensing acquisition and can help reduce the per-employee cost of IT.
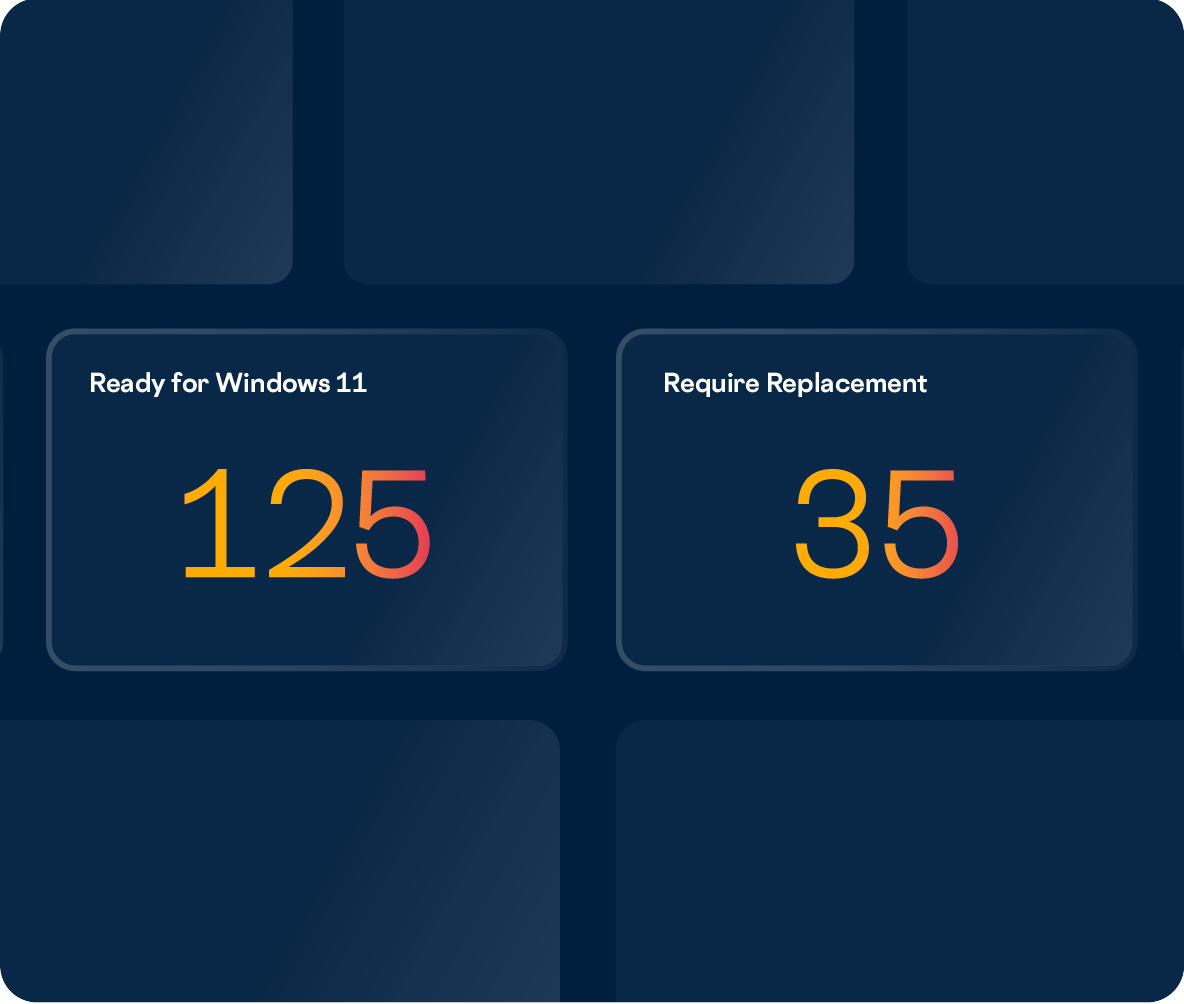
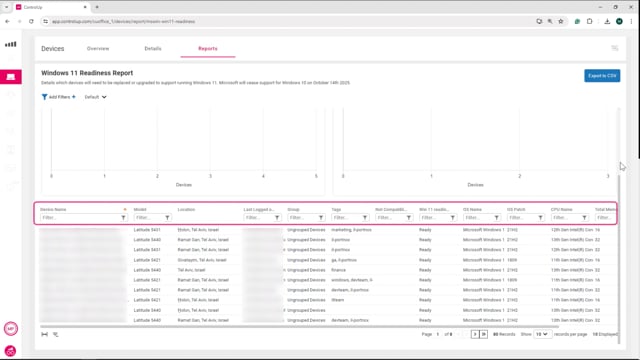
The Windows 10 end-of-support date of October 2025 has passed, leaving your environment exposed and unsupported. Move from panic to plan and accelerate an overdue deployment with clear visibility, so that you can act with speed and precision.
- One-click readiness report: ControlUp’s Windows 11 readiness dashboard and report provide you with all the high-level details about your physical Windows endpoints by automatically performing a readiness assessment with our agent.
- Deep insights: View key data, including how many machines are not yet running Windows 11, how many can be upgraded without any hardware changes, which devices can run Windows 11 after upgrades, and which devices should be replaced.
- Customize and export: Tailor the report by applying relevant filters or Windows 11-specific filters to other dashboards and reports available in the platform. Export the data to use in different tools or share with peers.