We just released a new version of the NetScaler Monitor with some nifty additions like the ability to monitor CPXs, more info about gateways’ certificates and policies, the ability to change connection settings and some other general improvements.
Download here
Whether you use NetScaler as a Gateway for your Citrix environment or as a Load Balancer for your web app, it is important to be able to see and understand whether everything is up and functioning as expected.That’s where The ControlUp NetScaler Monitor comes in handy. The ControlUp NetScaler Monitor is a web-based application designed to monitor and perform basic management for NetScaler VPX, MPX and CPX.
The solution enables administrators to monitor and manage the Citrix NetScalers in the system remotely, in real time, by collecting metrics from the NetScalers and displaying them in a convenient and intuitive interface.
The data it gathers includes information about the NetScalers’ Load Balancers, Gateways, HDX sessions, and the overall system.
Users can drill down into the service components to see the underlying data of each object, and can also activate and deactivate some objects directly from the NetScaler Monitor window.

| Item | Description |
| 1 | NetScaler Connection Name and Overview Statistics |
| 2 | Aggregated View of all the NetScaler Load Balancers |
| 3 | Load Balancer Name and Overview Statistics |
| 4 | Load Balancer’s Services and Overview Statistics |
Let’s explore some of The ControlUp NetScaler Monitor’s great features, how to set it up and where you can get it.
First, in order to demonstrate better, I wanted to create a small implementation not necessarily related to a XenApp/XenDesktop deployment, and what says small and fast more than containers?
My Setup consists of a Docker container, 2 Container based Apache Web Servers, and a NetScaler CPX Express.
Each server hosts a distinct web page, so we can distinguish between them when the NetScaler Load Balancer directs us to one or the other.
To make it a little more interesting let’s have our containers be represented by two Pop singers, so the first container’s homepage is a picture of Britney Spears, the other is Taylor Swift.
First let’s get the NetScaler CPX Express so we will go to Citrix website and get a download link, then we can use wget to download it to our machine.
wget -O cpx-11.1-48.10.gz https://downloads.citrix.com/12983/cpx-11.1-48.10.gz__gda__=1501505694_249718d46430a4fea5e9be81fb8fd8b1And
Load it as an image
docker load –I cpx-11.1-48.10.gz
And run it, we’ll expose ports 22, 80 and 161 for management and monitoring, so we’ll able to manage and monitor later using The ControlUp NetScaler Monitor.
docker run –dt 22 –p 80 161/udp –ulimit core=-1 –privileged=true cpx:11.1-48.10
Once we have our NetScaler CPX up and running, we’ll want to add our two container based web servers as services to the NetScaler, and bind them to our newly configured Load Balancer.
To add each web server, we’ll connect to their respective container and use ifconfig to note their IP (in our case, 172.17.0.2 and 172.17.0.3), after we have their IPs we will connect back to the NetScaler CPX and add each as a service.
First and Second Web Server.
cli_script.sh "add service Britney 172.17.0.2 HTTP 80"To see the services we just added we’ll use the following –
cli_script.sh "add service Taylor 172.17.0.3 HTTP 80"
cli_script.sh “show service”

Let’s create our Load Balancer, in this example I assigned the IP address 172.17.0.5 just to keep a sequential order.
cli_script.sh "add lb vserver web_cpx HTTP 172.17.0.5 8080"

cli_script.sh "bind lb vserver web_cpx Britney"

cli_script.sh "bind lb vserver web_cpx Taylor"

Next, we’ll want to create a rule to redirect any traffic coming through port 80 to our Load Balancer on port 8080.
iptables -t nat -A PREROUTING -p tcp -m addrtype --dst-type LOCAL -m tcp --dport 80 -j DNAT --to-destination 172.17.0.5:8080
To test the Load Balancer I access my Ubuntu machine on port 80, the address is 10.1.4.99:80 as shown in the diagram above. My Load Balancer has the default load balancing algorithm, LEASTCONNECTION, which means it will direct traffic to the service with the fewest client connections. I’ll refresh the page a few times to make sure I get redirected to both my containers.


Looks good, now let’s set up the ControlUp NetScaler Monitor, and connect with it to our NetScaler CPX.I won’t cover the installation process, it is a very simple install and more information is available in its User Guide. Once we have the ControlUp NetScaler Monitor installed and running, we can access it via a web browser on port 3333 to the computer it was installed on. The first screen we get is the NetScaler Monitor dashboard. As we didn’t add any netscaler appliance, it will be empty, so the first thing we want to do is to add our netscaler CPX to the NetScaler Monitor. Let’s switch to the settings pane.
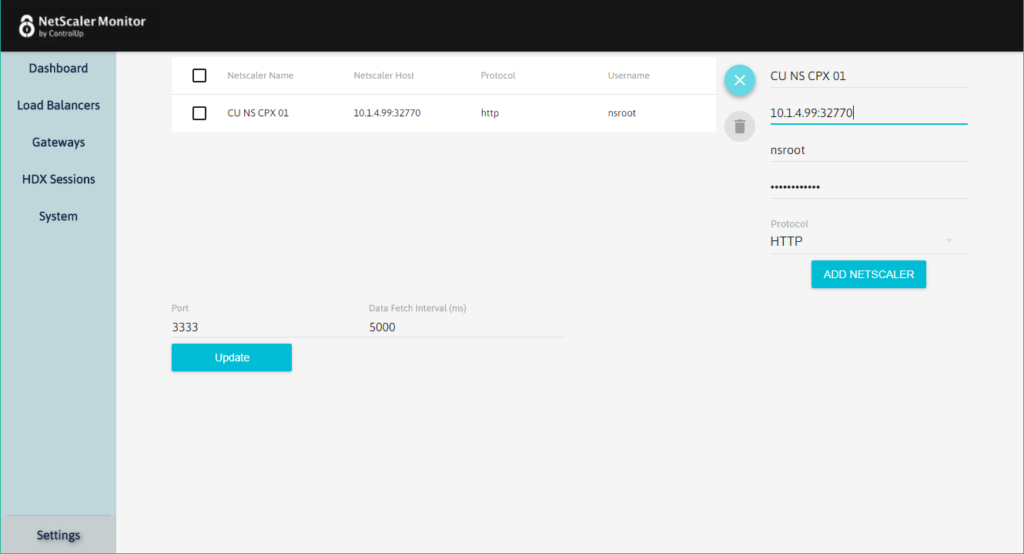
Under settings we’ll click on the blue plus sign and provide our netscaler CPX connection information and credentials.

In our case, as mentioned above, to access my netscaler’s management port I will have to access my server on port 32770 for which Docker redirects to my NetScaler management interface.
After i’ve added my NetScaler CPX I’ll switch back to the dashboard view and drill down to the load balancer to see if it shows up alright.

There is no traffic at the moment, so what we can do is write a simple loop that will access our linux machine, which will redirect the connection to the Load Balancer VIP in order to generate some traffic which we could see under the Load Balancer view on our dashboard.

Here we can see that our Load Balancer is starting to receive some connections, and therefore its traffic is going up too.
Looks pretty good, from within this dashboard I can see key metrics about my load balancers and carry out simple management actions like disable or enable a specific load balancer.
In conclusion, This deployment of 2 static web pages under the same load balancer was carried out in order to demonstrate some of the ControlUp NetScaler Monitor’s capabilities.
To see more, you are welcome to click on the link below and download the ControlUp NetScaler Monitor free of charge, so that you could see for yourself how it can fit with your monitoring and management needs.
We also welcome any suggestions or comments you might have if you’d like to help us make the ControlUp NetScaler Monitor better.
The NetScaler Monitor is Free – take it for a test drive today!