
We are excited to announce the launch of the “Application Load Time Profiler” tool.
The Application Load Time Profiler is a free tool that measures the time it takes any Windows application to load and provides a deeper visual analysis allowing you to understand the reasons causing an application to load slowly.
With the release of ControlUp version 6 we introduced a new set of metrics to measure the application load time of any application in real time. The Application profiler takes this a step further, allowing a drill down visual analysis of the given applications’ load time to map out the underlying processes.
Understanding the time it takes your users to launch an application can prove to be a challenging undertaking, as you would have to cross examine and compare data from several tools. The challenge becomes even more difficult if you wish to understand application load times retroactively – for example, when a user complains about an application which loaded slowly yesterday.
With the Application Load Time Profiler, you can measure application load time in real time, as well as analyze historical load times using logs generated automatically by the ControlUp Console.
The Application Load Time Profiler uses the following metrics and an advanced algorithm to calculate application launch times:
- Module count – the load rate of DLLs performed by the application
- IO Data Bytes – IO bytes generated by the application during the launch
- Visible Windows Count – the load rate of visible windows
- User input events – user mouse clicks or keyboard strokes within the launched application – used in order to correct Module/IO/Windows peaks that were generated due to user input
Before we begin, a few basic explanations and concepts to set the ground rules:

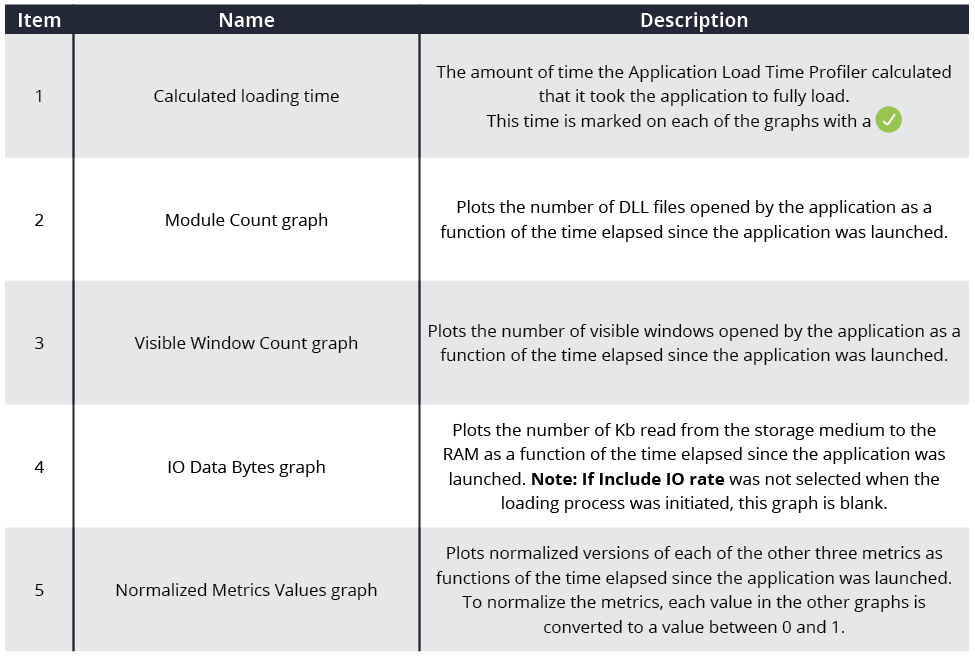
Fig. 1 – Legend
Keyboard and Mouse Input- examples
User input – keyboard or mouse interactions with the monitored application – is also monitored by the Application Load Time Profiler. When it occurs, it is marked in the first three graphs, as follows:
- Purple Keyboard marks times at which there was keyboard input
- Green Mouse marks times at which there was mouse input

Fig. 2 Results with mouse and keyboard input
Measuring and analyzing application load times with the Application Profiler
So what’s the fuss about? Well, here are the type of visual analytics you can get with the Application Load Time Profiler:
Fig. 3 shows the analysis of a slow loading excel file, which took almost twenty seconds to load. The results clearly show that this was due to exceptionally high I/O activity, or in simple terms – the file was just so large it took a long time to load. The Application profiler points to the root cause eliminating other possible contributing factors.

Fig 3. Slow loading excel file
Fig. 4 and Fig. 5 Show the Application Load Time Profiler’s results for two different instances of launching Microsoft Excel, showing the first 5 seconds of activity, and focused on I/O Operations.
Fig. 4 shows an Excel instance that only took one second to load.

Fig. 4. The green check mark indicates when the application loaded.
Fig. 5 shows a second Excel instance that took longer to load. Notice that the I/O Operations Vs running time graph displays a more moderate curve slope this time which implies that the machine couldn’t perform as much I/O Operations within the given time, resulting in slow load time.
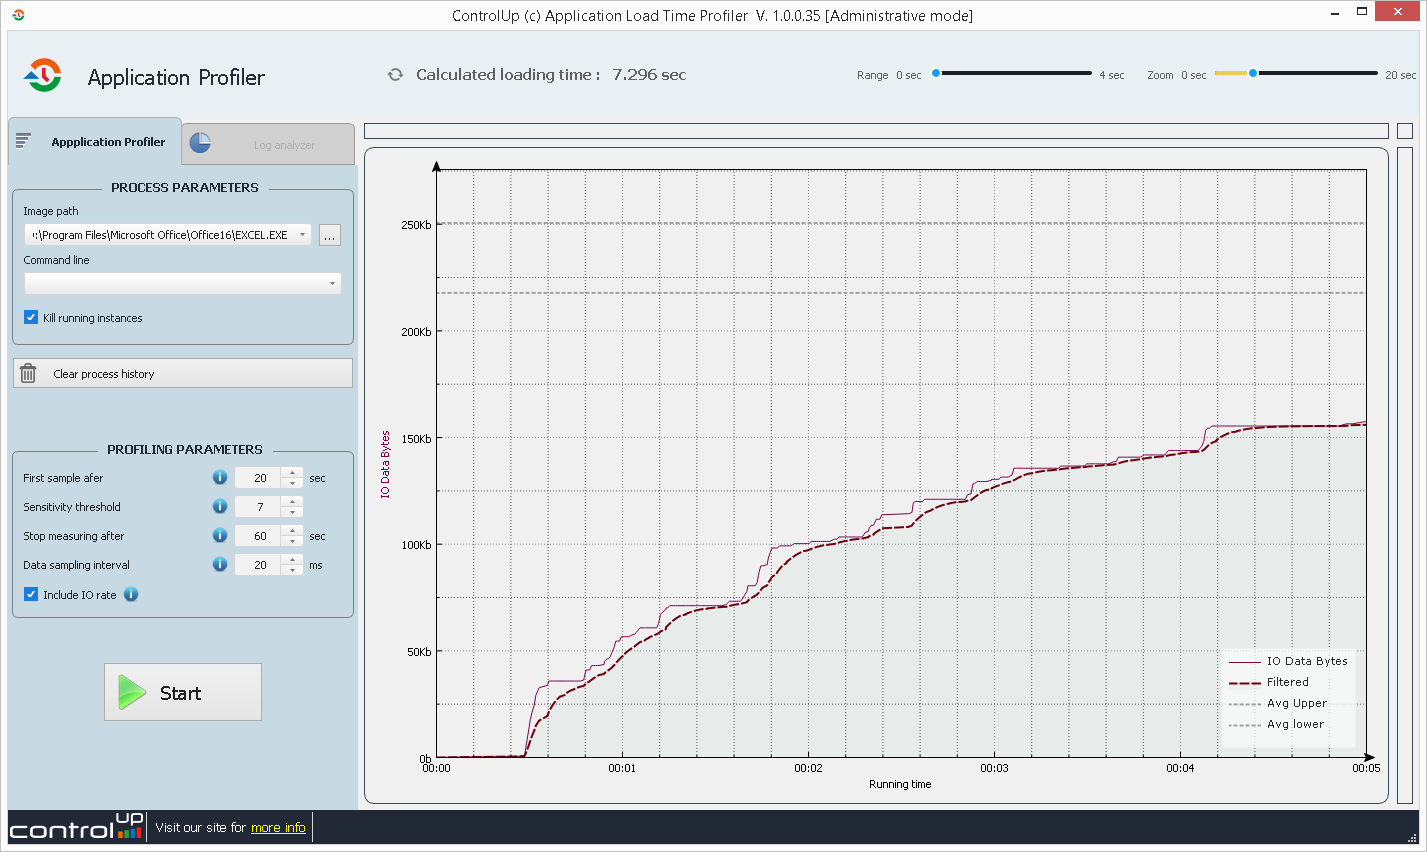
Fig. 5 Slow load time
The next two figures, Fig. 6, and Fig. 7, examine the same two Excel launch instances and show the graphs of the normalized metrics for modules count, visible Windows count and I/O bytes count.
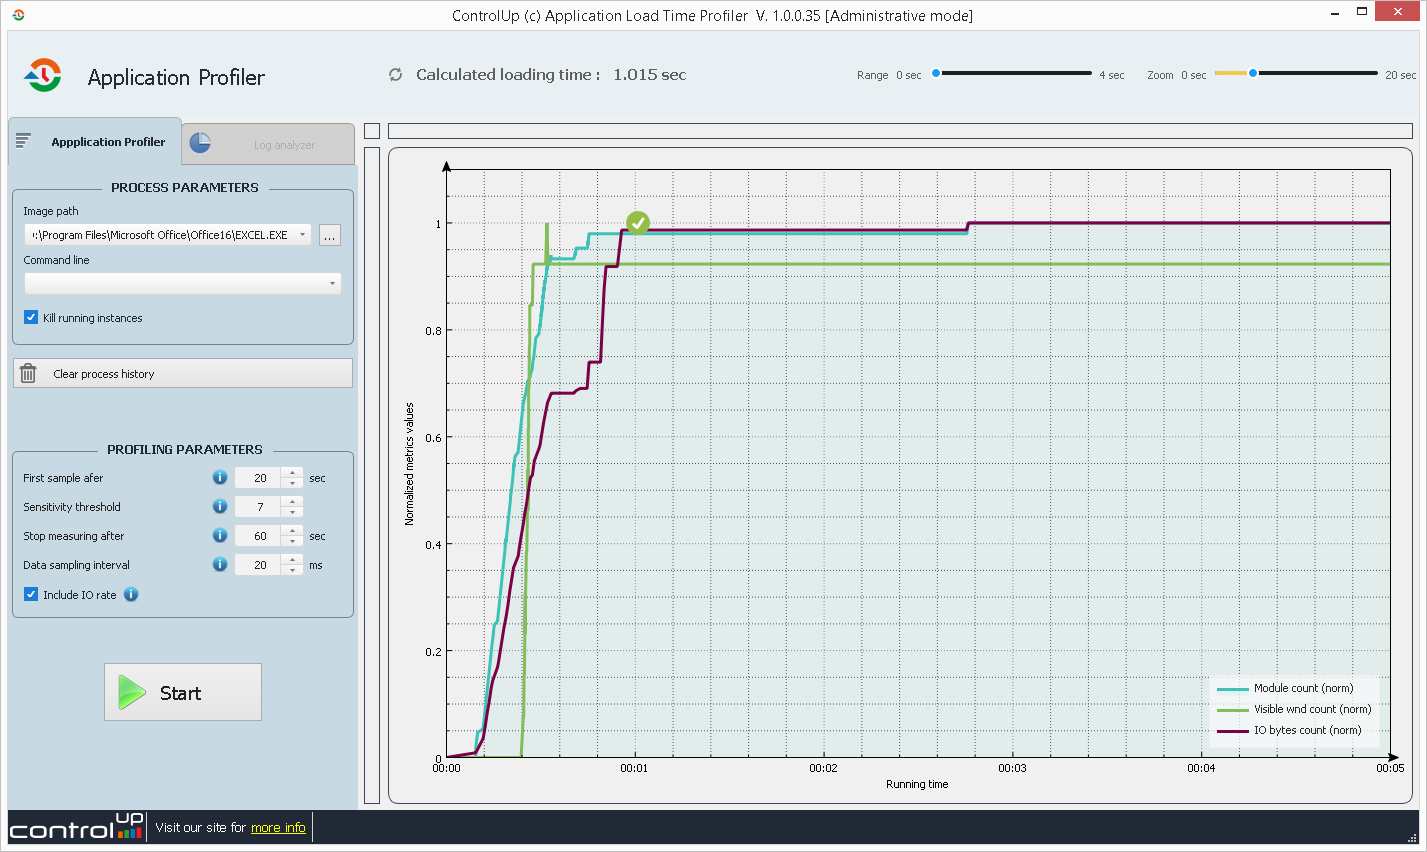
Fig. 6. The green check mark indicates when the application loaded.

Fig. 7 Poor user experience
As can clearly be seen, in Fig. 6 all of the counter graphs are situated closely together, While in Fig 7. the counter graph curves are more widely dispersed, which indicates that a lot of time has passed between Excel’s different operations.
Fig. 7 indicates that the computer running this instance of Excel has insufficient resources required to deliver a good user experience.
Another important use case for the Application Load Time Profiler is its ability to display visual analytics for application load time instances that happened in the past. (Read about the Prerequisites for this functionality here).
Fig. 8 shows the Application Load Time Profiler’s analysis of a past instance of an Excel launch log. The “Profiler Log Data” area in the window shows the time Excel was launched.
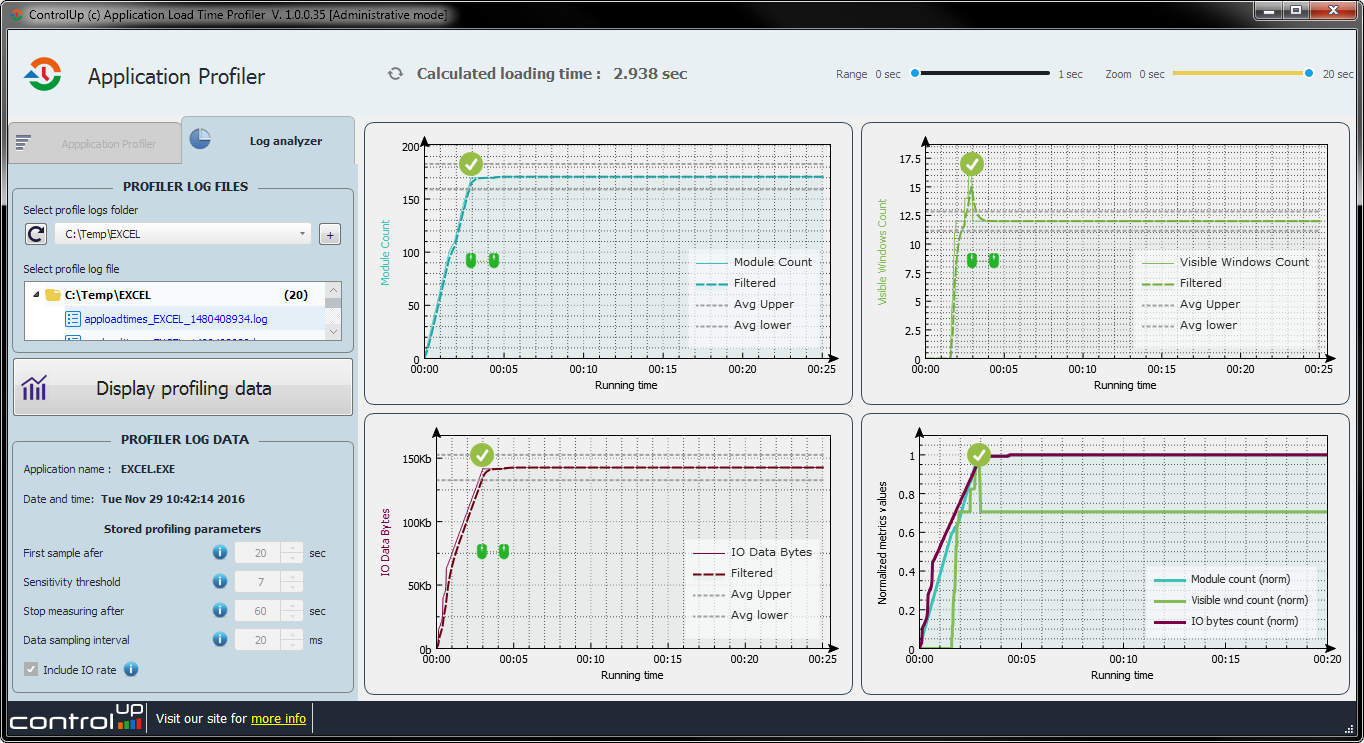
Fig. 8. The green check marks indicate when the application loaded.
According to the Application Load Time Profiler graphs in Fig. 6, it looks like Excel took about 3 seconds to be ready for user interaction, which translates to being fully loaded.
The Graphs also reveal that the user performed two mouse clicks, which indicates the application was ready. The top right graph further reveals that by clicking on the application the user initiated a spike in “Windows Count” – which suggests that the user interaction has caused some menus or windows to pop up.
What’s in it for me?
A free tool that empowers you to look under the hood of your applications’ load time and find out what went wrong and how to fix it. The ability to do so with applications that acted up today or look back and analyze applications that were sluggish in the past and discover why. A new power tool on your IT toolbelt that makes you better and more efficient at tackling any IT challenge thrown your way.