VDI & DaaS Performance Monitoring

Automated Root Cause Analysis in Seconds

Get real-time visibility across every layer of your virtual desktop stack, with AI-guided root cause analysis and automated fixes to prevent slow sessions from becoming escalations.

Try for Free Get a Demo

Virtual Desktops That Perform Like Local Ones

VDI and DaaS give organizations flexibility, security, and simpler application delivery. Getting the most from them means seeing every layer of the stack, from infrastructure to endpoint, in one place. ControlUp provides that view in real time, so issues are found and fixed fast, and frontline support teams resolve more without escalating. VDI and DaaS Management has never been easier.

Every Layer. One Answer.

The agent and native vendor APIs feed 3-second data from every layer of the stack into a single console. ControlUp’s agentic AI engine, Pulse AI, points to the layer and the process behind the problem, before trigger-based remediations apply the fixes you've already approved. Your engineers spend time on the problems that actually need their expertise.

The Whole Delivery Chain in One View

Most VDI monitoring stops at the edge of the vendor’s console. ControlUp pairs a real-time agent with native vendor API integrations to collect more than 1,500 metrics across hypervisors, datastores, DaaS and IaaS services, brokers, gateways, machines, sessions, and the endpoints connecting to them. Azure Virtual Desktop, Windows 365, Citrix, and Omnissa Horizon land in the same view, on Broadcom, Nutanix, Microsoft, or XenServer infrastructure. Whether the problem is in the data center or the home office, you can see it from one console.

Catch the Freeze Before It Disappears

Transient freezes are the hardest VDI tickets to close, because by the time anyone looks, the spike is gone. With data collected every 3 seconds, you can watch CPU, memory, disk, and network activity live and pinpoint the exact process or network event causing the freeze. Pulse AI correlates signals across the stack and recommends the shortest drill-down path to root cause. IT’s new agentic teammate, Pulse AI Assistant, explains what it found in plain language, so a Tier 1 agent closes the ticket instead of escalating it.

Fix Once, Apply Everywhere

A problem on one machine is usually a problem on fifty. Built-in management actions run across many servers, hosts, machines, or sessions at once, from bulk registry edits to comparing Windows service configurations and correcting those that have drifted. Link community or custom scripts to performance triggers, and the platform clears storage or restarts a crashed service the moment a threshold is crossed, before the employee notices anything.
Right-Size With Evidence, Not Estimates

Over-provisioning is a safe guess, but it’s an expensive one. ControlUp provides up to a year of history across hosts, machines, sessions, and applications to reveal how your environment is actually used: session counts, logon trends, app concurrency, and resource consumption. Use this data to size capacity to real demand, forecast cloud spend, and cut waste without putting the digital employee experience at risk.

Key Features

Agent and agentless collection

More than 1,500 metrics from the real-time agent and native vendor API integrations.

Three-second data collection

Live CPU, memory, disk, and network activity across every virtual desktop.

AI-guided root cause analysis

Pulse AI recommends the shortest drill-down path, and Pulse Assistant explains the findings in the console.

Multi-machine management actions

Built-in tasks executed across many servers, hosts, machines, or sessions at once.

Bulk registry management

Create, edit, or delete registry values across many computer and user hives as if they were one.

Windows services comparison

Spot and fix service configuration differences across machines on the fly.

Trigger-based remediation

Community and custom scripts that run automatically when a performance threshold is crossed.

Historical reporting

Up to a year of session, system health, and application usage data.

Explore the Products
This Capability Powers

This capability is included in the ControlUp products below. Each one brings it together with related features for a specific part of your digital workplace.
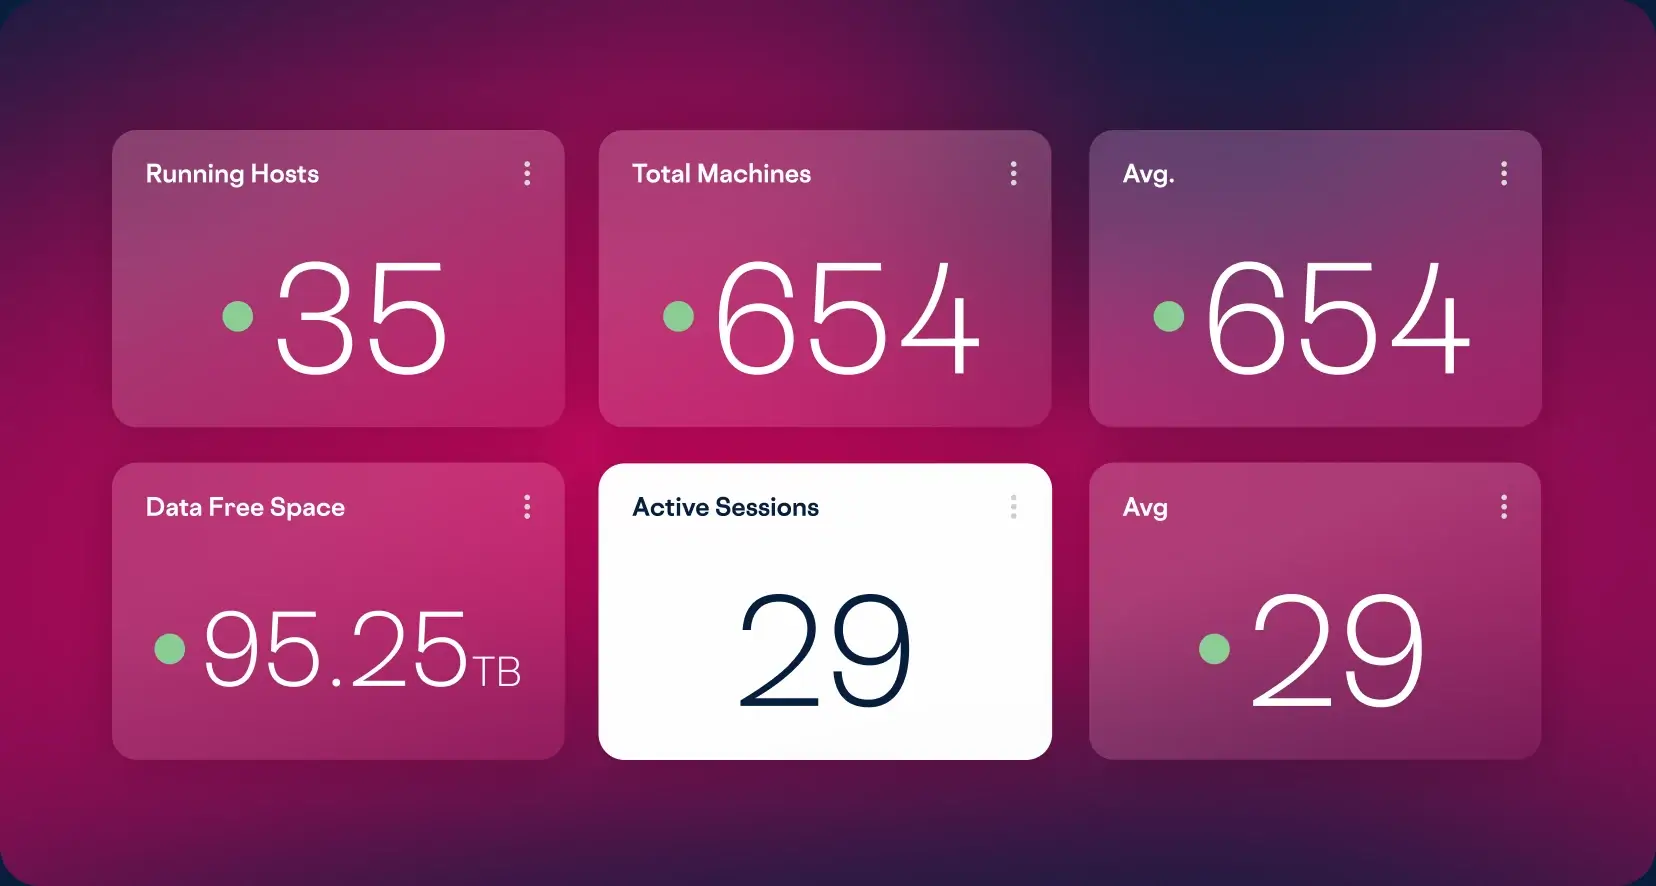
ControlUp for VDI: Running Hosts, Total Machines, Data Free Space and Active Sessions

ControlUp
for VDI

Learn More
FAQs
How does IT distinguish between virtual infrastructure issues and local home network latency for remote sessions?
ControlUp for VDI eliminates blind spots by providing end-to-end visibility across the entire delivery chain. The platform monitors hypervisors, brokers, and session hosts while simultaneously pulling real-time metrics from the connecting endpoint, such as Wi-Fi signal strength and ISP latency. This correlation allows IT to definitively prove whether session lag originates in the data center or the remote worker's local environment.
How does real-time architecture assist in troubleshooting transient freezes in virtual desktop environments?
ControlUp for VDI solves the problem of delayed metrics by leveraging its real-time architecture and 3-second data-collection interval. This provides a live stream of CPU, memory, and disk activity, allowing IT to troubleshoot transient performance spikes as they occur. Because the telemetry is live, administrators can identify the exact process or network event causing a freeze before the spike disappears from view.
How can AI-guided troubleshooting accelerate root-cause analysis for frontline service desk agents?
The platform features Pulse AI Assistant, the in-console assistant for IT, to provide instant explanations and troubleshooting guidance. By analyzing correlated signals across the virtual stack, the AI Assistant recommends the shortest drill-down path to the root cause. This empowers Tier 1 agents to resolve complex VDI tickets rapidly and with greater confidence without escalating to senior engineers.
How can virtual desktop environments be configured to autonomously remediate recurring performance issues?
ControlUp for VDI is designed for proactive, automated remediation through a library of community- and custom-written scripts. IT teams can link these scripts to performance triggers; if a virtual machine hits a critical resource threshold, the platform autonomously executes a fix—such as clearing storage or restarting crashed services—in the background. Issues resolve automatically, within thresholds IT sets. Significant actions pause for admin review.
How can IT organizations use historical telemetry to right-size virtual infrastructure and reduce cloud spend?
ControlUp for VDI stores long-term historical performance data to identify over-provisioned virtual machines and underutilized resources. The platform provides actionable sizing recommendations based on actual consumption patterns across VDI and DaaS deployments. These insights let IT right-size their environment, forecast cloud costs accurately, and maximize efficiency without compromising the user experience.
Which VDI and DaaS platforms does ControlUp support?
ControlUp supports Citrix Virtual Apps and Desktops and Citrix DaaS, Omnissa Horizon, Microsoft Azure Virtual Desktop, and Windows 365. It runs on Broadcom, Nutanix, Microsoft, and XenServer hypervisors, so multi-vendor estates get one view.