
As engineers and IT professionals, we at ControlUp thrive on data. Data provides the ultimate validation (or discreditation) for popular narratives, such as the widely anticipated mass migration from Windows 10 to Windows 11, driven by the Windows 10 end-of-life on October 14, 2025. With access to anonymous, aggregated statistics from millions of endpoints within our customer environments, we have a unique vantage point into these operating system upgrade trends. Let’s dive into what the data tells us about the Windows 11 adoption rate!
Windows 11 Migration: Real-World Adoption Trends
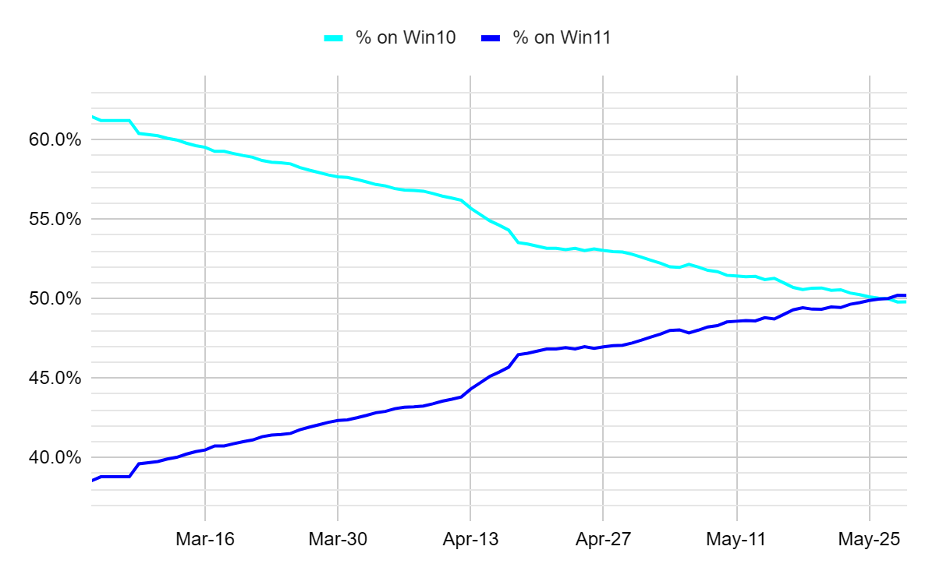
Here’s a glimpse into the kind of insights we’re tracking. We’re seeing a clear decline in Windows 10 usage and a corresponding uptick in Windows 11 adoption. (Seeing the Windows 11 number cross over to become the majority was especially satisfying!)
This trend is critical for IT infrastructure management, as organizations plan their migration timelines, compatibility assessments, and budget forecasts.
Assessing Readiness with ControlUp
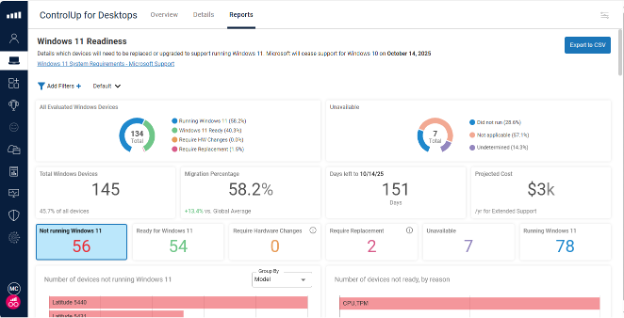
ControlUp customers can see their unique status in our Windows 11 Readiness Dashboard, which helps dissect the number of machines already running Windows 11, those capable of migrating, and which devices may require hardware upgrades to meet Windows 11 system requirements (e.g., memory, TPM, disk space). For endpoints that fall short, organizations can assess whether to upgrade Windows 10 to 11, replace, or consider an alternative operating system strategy.
This level of visibility supports smarter IT asset lifecycle management and aligns with modern endpoint management practices.
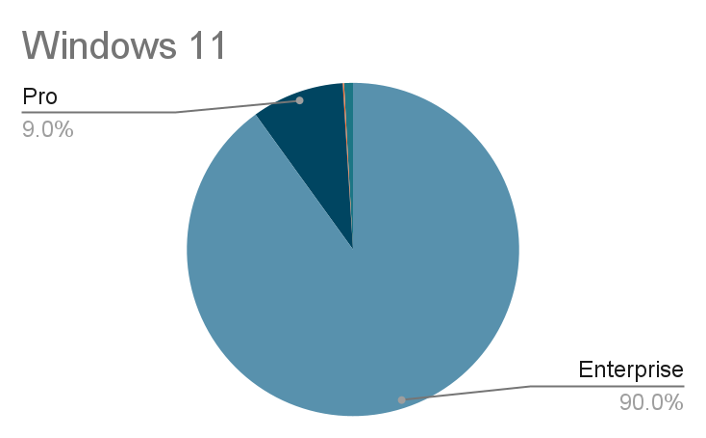
Enterprise vs. Pro: A Closer Look at Windows Editions
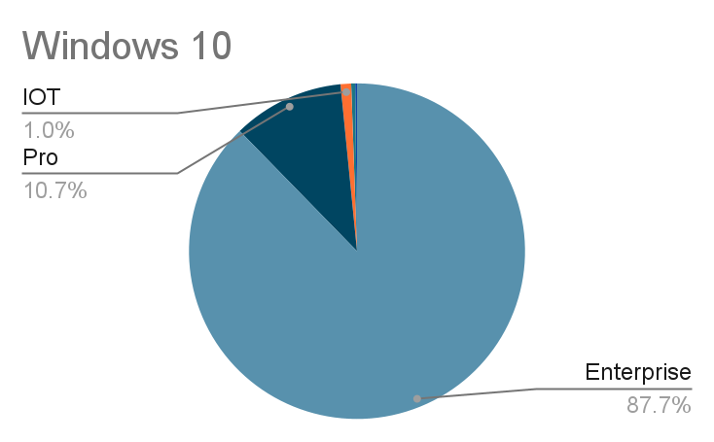
Beyond overall adoption rates, our data allows us to segment by Windows OS editions. We’ve observed consistent dominance of the Enterprise edition—around 90% of machines, whether running Windows 10 or Windows 11, are Enterprise SKUs. This aligns with the needs of enterprise IT environments, where advanced features, scalability, and security are paramount.
One notable observation is the slower Windows 11 IoT adoption compared to its Windows 10 counterpart. This raises questions: could the integration with ‘Windows Link’ be a factor? And if so, when can we expect to see ‘Windows Link’ fully rolled out and impacting adoption? Time will tell how that effects IoT device management in enterprise deployments.
Dominant Hardware Vendors in the Enterprise: Who Powers Your Machines?
Endpoint hardware plays a critical role in device readiness for OS upgrades. OEM vendor choice is ultimately a matter of preference and procurement; our data shows that Dell, HP, and Lenovo continue to dominate among enterprise customers. Across the millions of machines we monitor, these OEMs hold the top three vendors, all maintaining a similar share across the millions of endpoints that ControlUp monitors.
The Persistent Past: Legacy OS Versions Still Alive
Despite Microsoft’s push towards newer operating systems, our data reveals that a small number of machines are still running legacy Windows versions. We observed:
- Windows 8.1: 45 machines, mostly Pro Edition.
- Windows 7: 21 machines still in use. This truly highlights the longevity of some of these older deployments.
This underscores the challenges of legacy system support and raises important questions about compliance, security risk, and device lifecycle management in large IT environments. I would be curious to understand why those systems are still around—it’s not as if they are being monitored!
Key Takeaways: Prepare Now or Fall Behind
The Windows 11 migration is underway—and accelerating. However, if current adoption rates hold, a significant number of organizations will still be using Windows 10 when it reaches end-of-life in 2025. This highlights the urgency for IT leaders to assess their endpoint environment, prioritize OS migration planning, and reduce risk before support ends.
These are just a few insights we’ve gleaned from analyzing real-world data across millions of endpoints. Understanding these trends is crucial for IT decision makers planning their operating system strategy and optimizing their digital workplace.
→ Join the conversation on LinkedIn. What are your thoughts on these findings? Do they align with what you’re seeing in your own environment? Share your insights or questions from your organization’s journey with us.
→ Explore more with these related resources: