
Among the trickier things for IT administrators to nail down are the causes of slow logons and how to fix those problems quickly. That’s why ControlUp created the “Analyze Logon Duration” (ALD) script. And now, we’ve made five key changes to the ALD script that will make spotting problems—and remedying them quickly—simple. In this series, we’ll go over the enhancements and what additional information we can glean from them.
The five changes:
-
Citrix Resultant Set of Policies (RSoP) analysis
-
Resultant Set of Policies Logging (RSoP Logging)
-
Windows Management Instrumentation (WMI) Filter duration analysis
-
Individual AppX Package Load Times
-
Loopback Processing Mode state
About Logon Duration Analysis
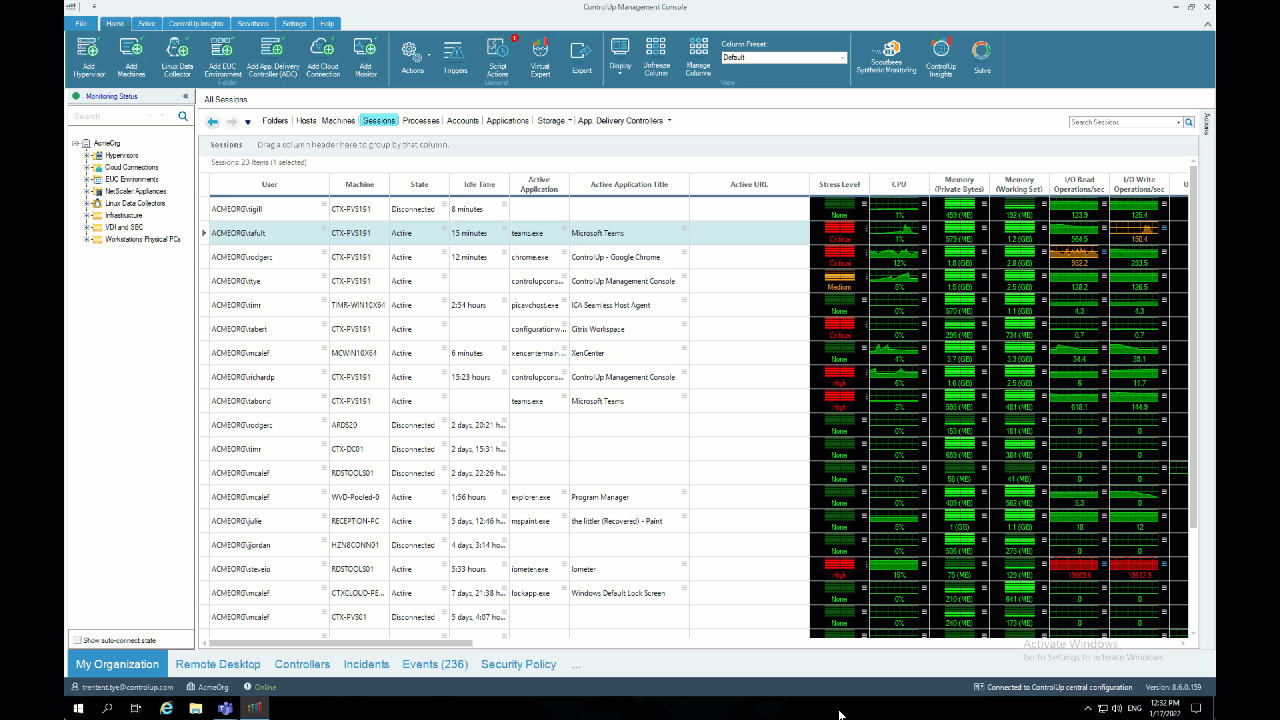
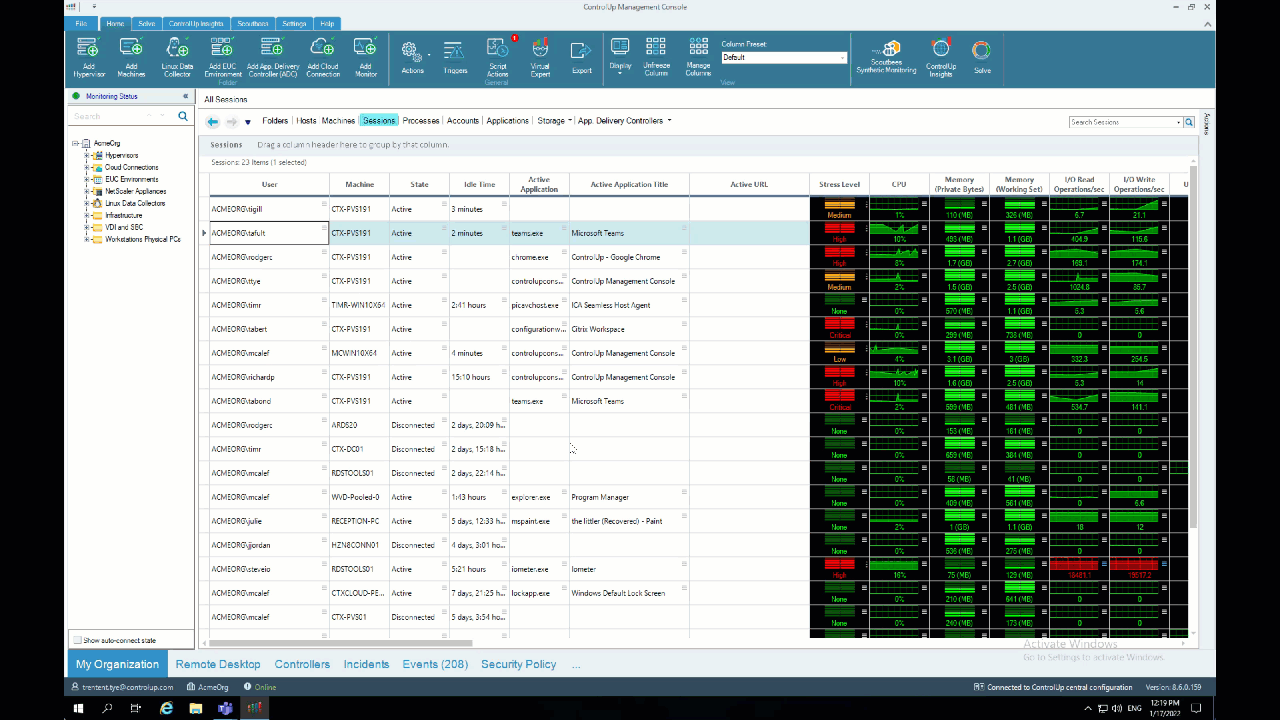
Out of the box, ControlUp offers some amazing technology for reporting on logon durations for users. Overall Logon Duration, Profile Load Time, Group Policy Load Time, Desktop Load Time and a column for unknown logon duration contributors are all calculated and displayed—in real time—right after a user has logged on.
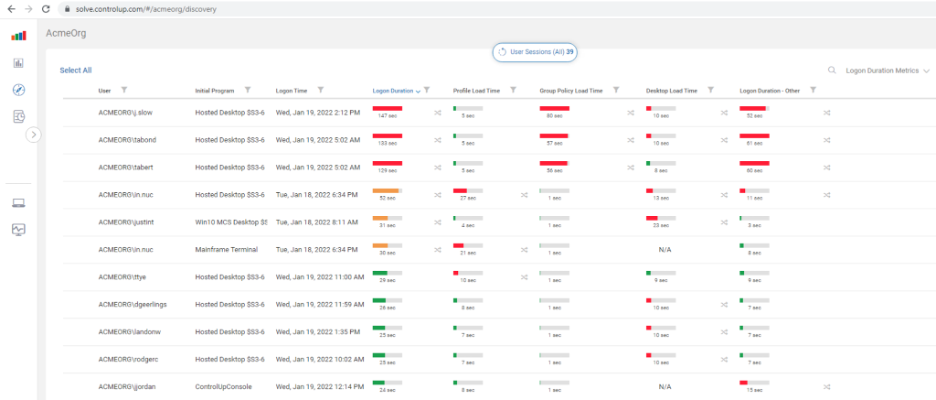
This is extraordinarily helpful for identifying low-hanging fruit optimization opportunities.
Originally introduced in 2015, ControlUp (along with help from our community members—particularly Guy Leech) has been continually improving and increasing the functionality of the Analyze Logon Duration script, which can break logons down into granular phases, based on technology or logon processes.
But ALD can only report back on the things it understands.
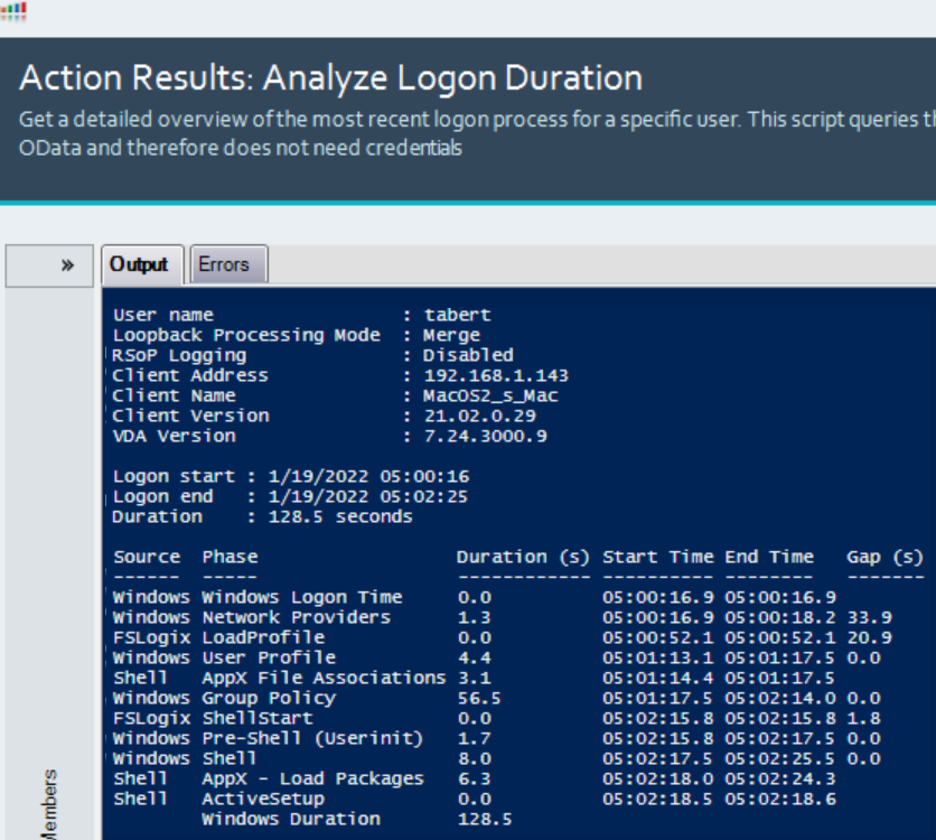
See those two large gaps of time on the far right of the image? 33.9 seconds and 20.9 seconds?
When ControlUp customers have unexplained logon duration gaps, they can reach out to us to help them assist in troubleshooting the root cause of these gaps. From here, ControlUp Professional Services can assist in identifying the technology or reason for the gaps. This article will go into the technical details of the gap in this screenshot, what it is we discovered, and how ALD reports it after we added this technology into the script.
About WMI
This article examines WMI filtering, what it means, and how it can impact your environment.
Before we get into using it, though, let’s answer, “What is WMI?”
WMI—also known as Windows Management Instrumentation and loosely as the Common Information Model (CIM)—provides an interface to query information or execute some action.
After working with a couple of ControlUp customers with slow logon issues I suspected were caused by WMI, I put out a poll to see how many people still use WMI filtering on their GPOs. Over 53 percent of respondents reported that they use WMI filtering in their environment!
How many people have WMI filters on their GPO’s?
— Trentent Tye (@TrententTye) July 16, 2021
I was surprised, but a lot of people still use them.
Where does WMI come into play?
In the context of WMI affecting logon duration, WMI is used for Group Policy filtering and item-level targeting (ILT) filtering. Most customers I’ve worked with use WMI filtering solely against Group Policy Objects. To maximize ControlUp’s ability to provide information to the community, I focused on providing value for this use case.
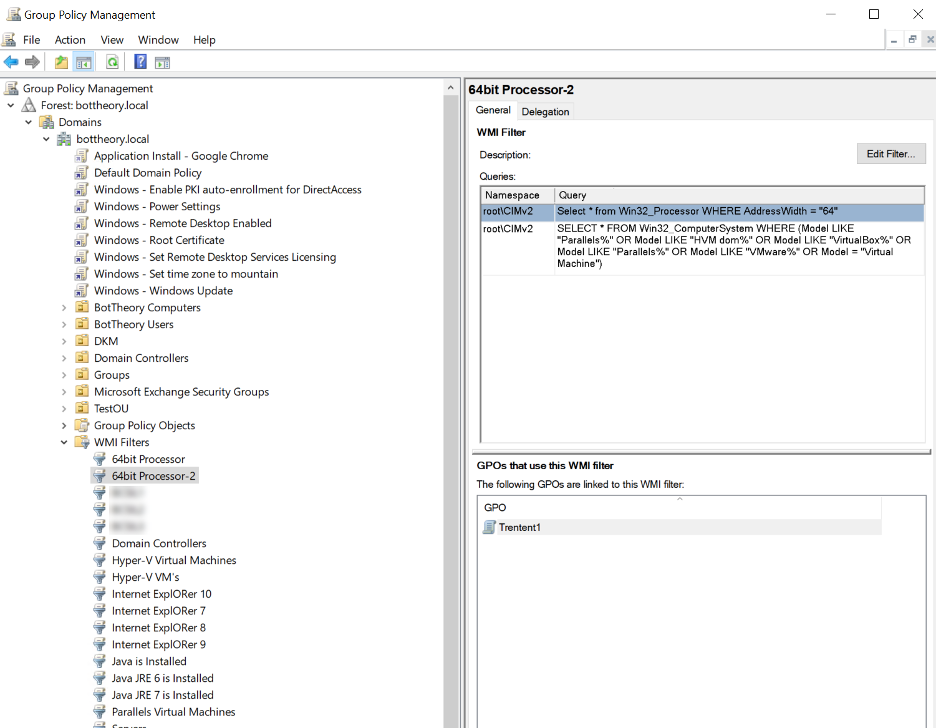
When you create a WMI filter in Group Policy Management, you can add multiple queries to the filter, like in this example:
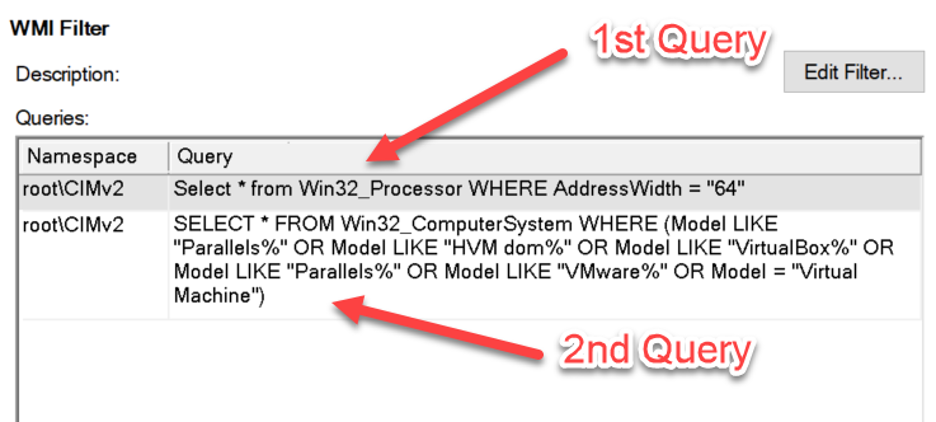
Queries execute in order, from top to bottom. I’ve observed that WMI queries assigned to GPOs operate on a PASS / FAIL system. In order for the GPO to apply, all queries must pass. In my example, if the first query passes, but the second query fails, then the processing for this GPO is stopped and the Group Policy engine will move on to the next GPO.
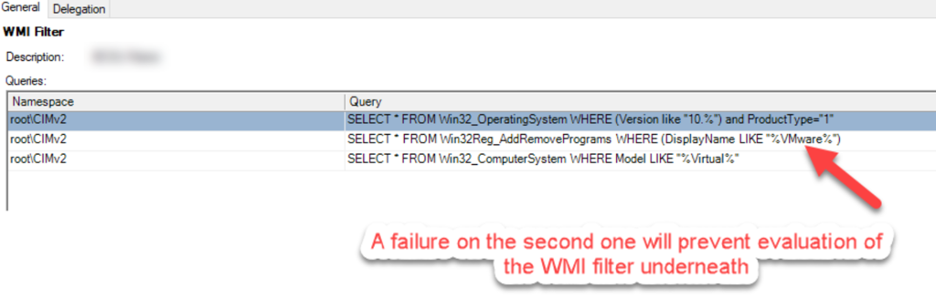
Understandably, this can lead to some variable delays if your queries fail at different places for different machines, causing inconsistent logons.
For example, with WMI, you can query for installed software or to see if a specific file exists on the file system. Querying installed software can be especially egregious with WMI, as the variability is related to lots of things (number of installed software packages/patches, length of time to ‘repair’ msi packages, etc). There are other methods or queries you can use to get installed software faster (e.g., querying registry values), but I think Microsoft tainted WMI’s reputation with their implementation of Win32_Product. But I digress.
Another drawback to WMI is the performance of the repository. The WMI repository does store things (like Resultant Set of Policies data), but it’s been observed that the performance of the repository is related to the size of it. The larger the repository the longer it takes to query or store data. And with RSoP enabled, this can be a double whammy of adding more data to an already bloated repository and slowing it down even further. Potentially worse is that WMI can lock the repository, preventing anyone from reading from or writing to it until the lock is removed. If something locks the WMI repository at the same time as another process is attempting to use it (say RSoP during a logon) then that logon will stall until the lock is removed.
How does ALD track WMI query performance?
There are two methods that I’ve coded into ALD to track WMI performance. The first is a precise method, but it requires setup; the second is a “best effort” method, but it’s more reliable. Another caveat of the more precise method is that it isn’t supported by Microsoft. However, it still works (even as of the release of Windows Server 2022).
Precise Method
The precise method involves setting two registry values:
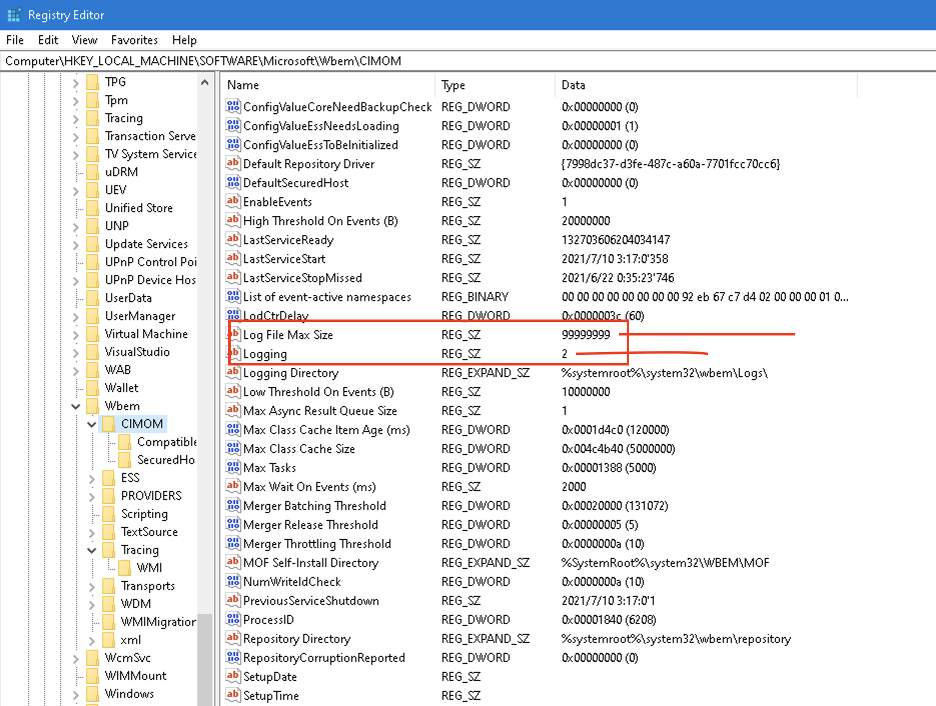
HKLM\Software\Microsoft\WBEM\CIMOM\Log File Max Size
HKLM\Software\Microsoft\WBEM\CIMOM\Logging
These values are documented in the Microsoft Knowledge Base..
You can set these values using ControlUp’s ‘Controller’s feature to enable it en masse, or just to view current values. ControlUp makes this a snap, as demonstrated here:
The “Log File Max Size” is measured in bytes. The “65535” default size only retains about an hour’s worth of data in my lightly loaded lab. If you enable this, you’ll want to play with this value to ensure you capture enough time. A valve of 10485760 would produce a ten-megabyte log file.
The logging value of “2” enables “Verbose Logging,” which is required to get the start / stop events.
Once these values are set, they take effect immediately. However, you cannot disable the logging until you set the value of “Logging” to “0” and reboot.
If ALD detects the log file, it will preferentially use it to determine WMI query performance. It does this by looking into the log file for the start / stop events of the query:
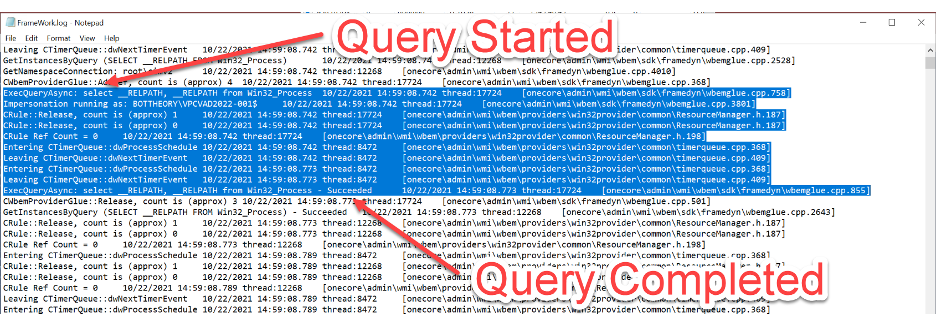
Nice! We can track the exact time the query is executed and completed.
Among the caveats of this method are queries that fail are NOT tracked here, only successful queries. Since failed queries can still consume a lot of time, we need to track them. In investigating how to do that, I came up with another method of WMI performance tracking: the “best effort” method.
Best Effort Method
The precise method is great if you want exact measurements. But enabling additional logging can have some drawbacks, including potential pitfalls created if the log file is locked, which can stall WMI until the lock is released. ControlUp would like this feature to work out-of-the-box as much as possible.
With that, I found another way to track WMI queries. By correlating events preceding WMI events in the event log, I was able to determine an accurate method in measuring the WMI query performance. The preceding event happens when the WMI query is started, and the event log tracks when the WMI query completes. In order for this method to work, you may need to extend the event log size of your WMI Activity log to ensure that the relevant events stick around. For a small environment, the default WMI Activity log size of 1MB only captures about two to three hours worth of data. For most environments, I would recommend setting this to 100MB, but it’s easiest to just pop in the event viewer, scroll down to the oldest event and just subtract your current time to get your time to MB ratio. Then you can calculate out how big to make it to capture events for a day or two (or more).
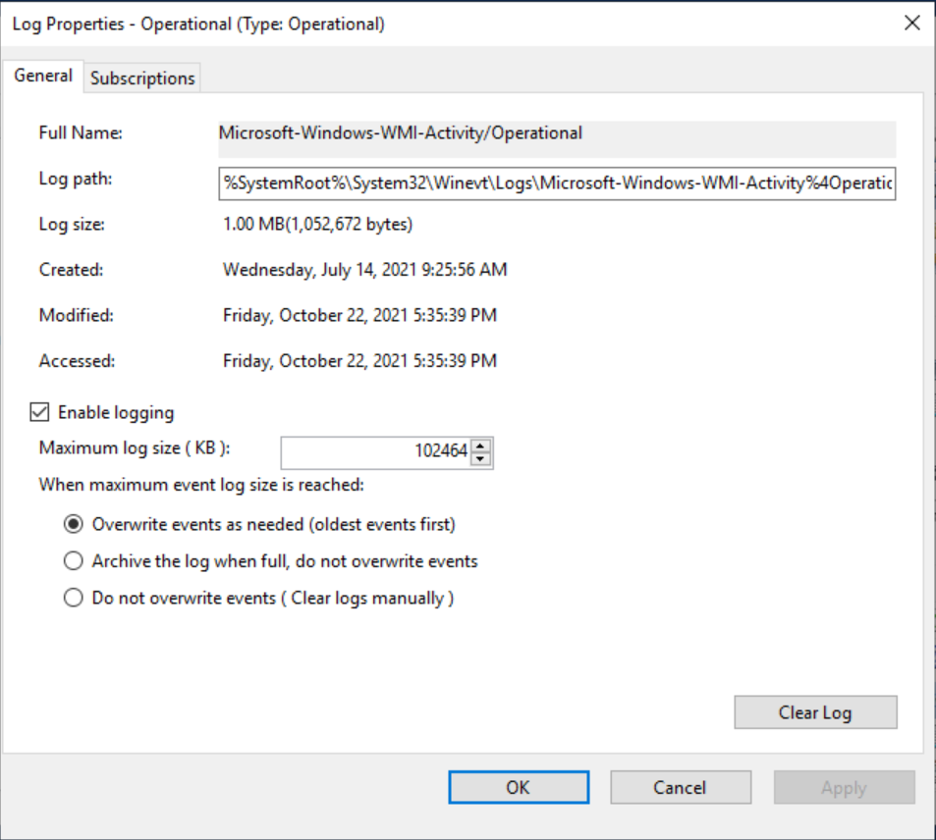
To change the event log size for the WMI Activity Log, open Event Viewer and navigate to “Application and Services Logs” > “Microsoft” > “Windows” > “WMI-Activity” > “Operational”
Right-click on “Operational” and select “Properties.” Adjust the “Maximum log size ( KB )” to whatever value you desire. In this screenshot, it’s set to 100MB.
With that said, let’s examine some slow WMI queries attached to some Group Policy Objects and see what ALD will capture for us.
How does this impact logon duration?
Well, it depends. It can impact very little, not at all or significantly. This is pretty much the same answer for every technology that touches the logon process. 🙂
ControlUp makes it incredibly easy to analyze it though, and determine WHAT the impact is and who is the impactor. To analyze sessions in your environment, right-click on a session, select “Script Actions”, “Analyze Logon Duration” and than “OK.”
Alternatively, you can use the ControlUp Virtual Expert™️, click on the “menu” icon next to “Logon Duration,” then select “Analyze Logon Duration.Easy, right?
Of course, before ControlUp, you’d have no way of knowing the impact of WMI. But that’s just one more way that ALD makes things better!
If you can design an OU / GPO structure that avoids WMI filtering, that would be the ideal scenario. The less processing you do during logon, the faster your logons are likely to be.
If you must use WMI filtering, I created a few GPOs and added a bunch of WMI filters just to see what ALD would output.
Here’s a sample:
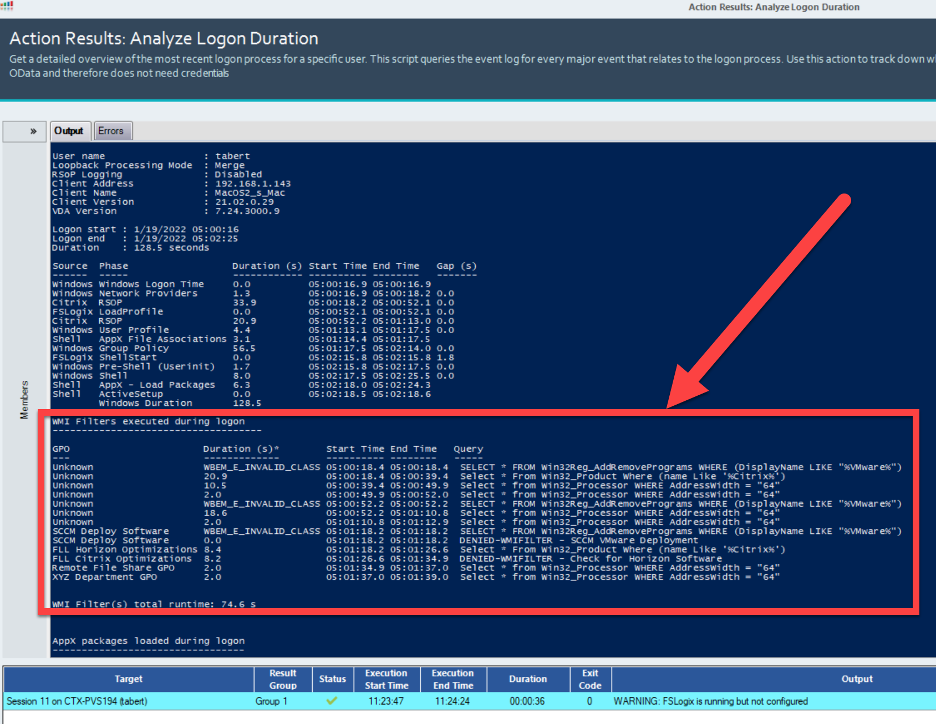
Some interesting things here! We can identify GPOs and the filter that is attached to them, as well as how long that query took to process. Cool!
We’ve added detailed tracking for WMI queries. We display the individual query and how long it took. If a GPO was denied by WMI from processing, we’ll show which GPO, the reason for the denial, and which WMI filter was assigned to it.
Now, long-running queries can be identified and reworked to reduce their impact. In this sample, “Select * from Win32_Processor…” is a major cause for concern. It ran six times with runtime durations of 10.5, 2.0, 18.6, 2.0, 2.0 and 2.0 seconds, respectively. Around 37.1 seconds of our 74.6 seconds to process WMI were spent on this single query being called six times!
We also track invalid queries. The three WMI queries with a duration of “WBEM_E_INVALID_CLASS” occurred because this GPO was calling a query for a namespace that wasn’t installed on this machine. So, ControlUp can track and show you that information, too.
With ControlUp and Analyze Logon Duration, we can pull back the curtain on some of these technologies and hope this helps you identify slowness in your environment and gives you enough information to do something actionable!
Analyze Your Environment
To get insights like these in your environment, start a trial of ControlUp today (it’s FREE; there’s no sales call required!). Just connect to one of your machines and analyze one of your recent logons. If you need further assistance getting the proper data, reach out to sales@controlup.com and one of our pre-sales engineers can help get your environment set up.
For additional information on what can impact logons check out the ControlUp blogs and check out the rest of our Analyze Logon Duration deep dive series:
-
Better Than Ever: 5 Key Updates to ControlUp Analyze Logon Duration5 Key Updates to ControlUp Analyze Logon Duration: AppX Package Load Times
-
5 Key Updates to ControlUp Analyze Logon Duration: AppX Package Load Times
-
5 Key Updates to ControlUp Analyze Logon Duration: RSoP Logging
-
5 Key Updates to ControlUp Analyze Logon Duration: Citrix RSoP
-
5 Key Updates to ControlUp Analyze Logon Duration: Loopback Processing Phase