
NOTE: This post comes from Esther Barthel, MSc, solutions architect, owner of cognition IT, and a consultant to ControlUp.
A couple of weeks ago, one of my clients experienced some unexpected behavior that seemed to be linked to the High Availability (HA) configuration of their Citrix ADCs. In reaction the client asked me to run a quick health check on their Citrix ADC environment. As I had no additional tooling available at the time, I found myself logging into multiple ADC management consoles to go over the HA configurations of each ADC.
For those of you familiar with the ADC management console, you know this meant I had to navigate through different screens to collect the data that I needed to troubleshoot the unexpected behavior of the ADCs.
Collecting the data
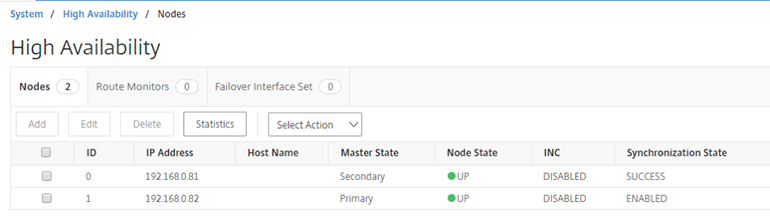
To understand the ADC behavior, I first needed a look at the HA configuration in the ADC management console. My first visit was the High Availability settings (System – High Availability) to get a good overview of the ADC configuration. These settings provide a quick overview of the Master, Node and Synchronization State of the ADC I was logged into and an overview of the other node in the HA pair.
The next screen containing important clues on the health of the ADC is the HA Statistics page, which provides a summary and detailed overview of the HA statistics, where the detailed overview also shows the Error Statistics.
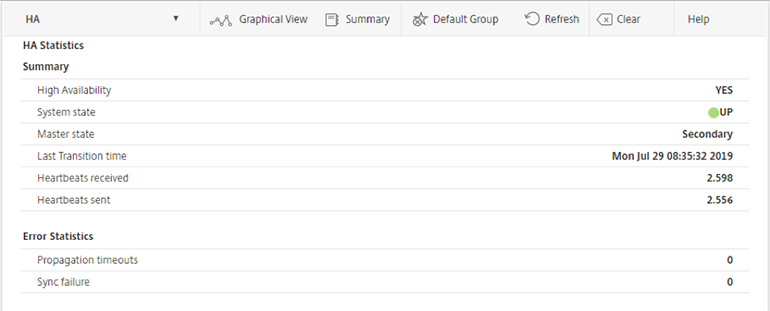
Unfortunately, the heartbeat received and sent Summary information displays only the total packets received. To check using the management console to see if the counters increase, I had to hit refresh a couple of times.
Even when I opened a console session and use the CLI command stat hanode -fullValues I still didn’t get an overview of the received and sent packets per second (rate metrics):

…which does seem a bit strange, because the NITRO API Reference Guide states that this information is part of the HA statistics, as we can see in the response payload of stat hanode:
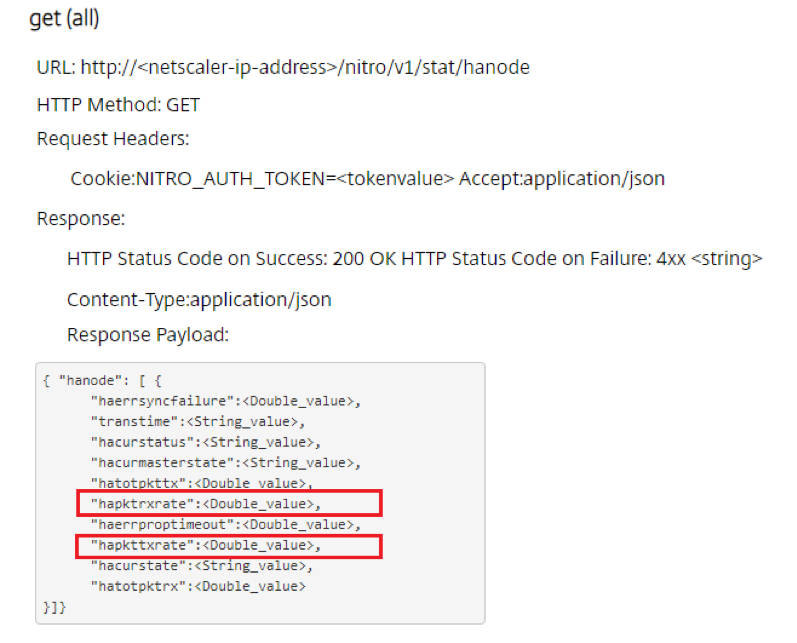
Based on this response, I know that a REST API call to the ADC can quickly show the received and sent heartbeat packets per second, making it easier to check if heartbeats are missed. When HA is configured with the default value for hellointerval (200ms), a healthy heartbeat has a rate value of 5 (per second) per interface that is configured with HA heartbeat ON.
So using a PowerShell script to retrieve the HA statistics makes it easier to simultaneously query multiple ADCs and also makes it possible to get a quick overview of both the HA config and HA stat information, including the received and sent heartbeats per second. This approach can aid me to easily detect possible heartbeat failures.
The Run Citrix ADC HA Healthcheck PowerShell script
I needed no more encouragement to work on a HA Healthcheck PowerShell script that retrieves both the HA configuration and statistics information for each ADC and gives me a quick overview of the health of the High Availability configuration of the ADC.
Because I found some interesting behavior when I was testing different HA configuration and troubleshooting scenarios, I decided to build additional logic into the script to interpret metric and signal failures so the script would highlight the deviating metrics.
Monitoring Citrix ADC with ControlUp
In addition to building PowerShell scripts to troubleshoot ADC configurations, I also am a big fan of ControlUp for monitoring my environment, especially now that ADC monitoring is part of the product.
To monitor the HA health of my ADCs I simply add the columns to my NetScaler view that contain the HA metrics.
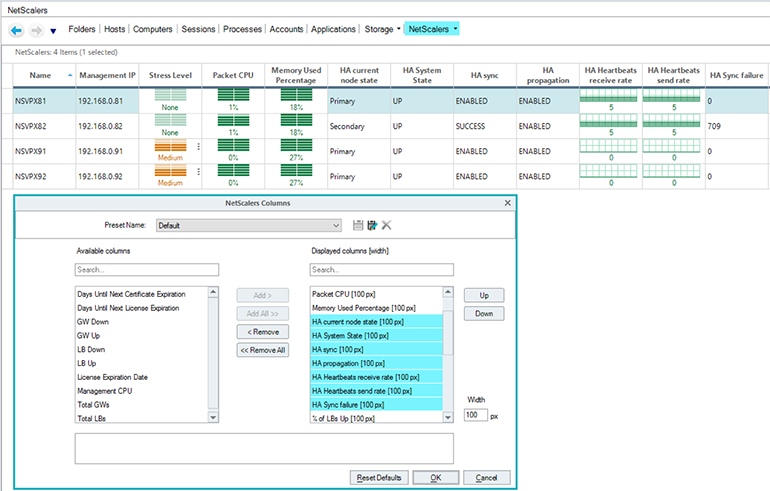
This allows me to quickly see the Master State (HA current node state), Node State (HA System State) and the Synchronization State (HA sync) of my ADC, as well as the heartbeats received and sent rate and HA sync failures.
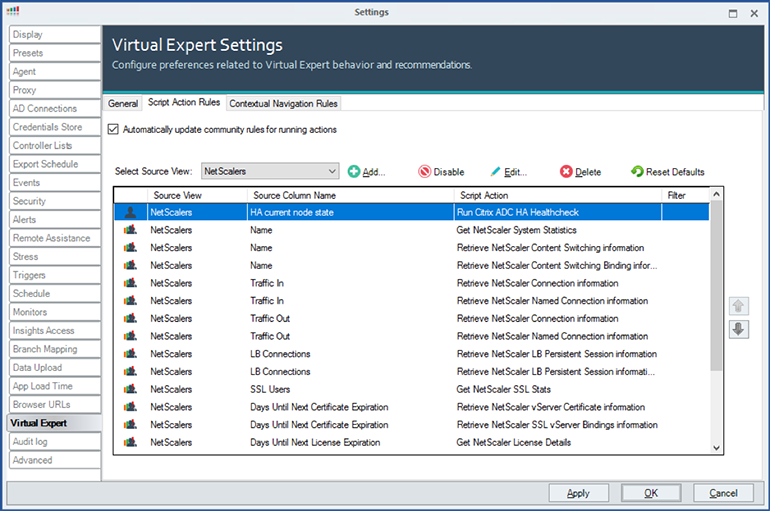
And, IMHO, the cool part of ControlUp is that you can now run Script Actions, which can be any PowerShell script that you’ve written. In my case I’ve added the Run Citrix ADC HA Healthcheck script as a Script Action to ControlUp, so I can complement ControlUp’s ADC HA metrics with some additional troubleshooting logic.
Since ControlUp focuses on the metrics of a single ADC (like HA current node state) it does not show which ADC is part of the HA configuration. To see node 1 of the HA configuration you need to log onto the ADC management console or run the Citrix ADC HA Healthcheck script.
Scenario 1: HA is not configured
This was the easiest check to build in the script. I discovered that even standalone ADCs show a Primary Master State using the HAStatus of the HA statistics to check if the ADC is part of a HA configuration.

Another bonus of the script is that it lets you know if HA is configured.
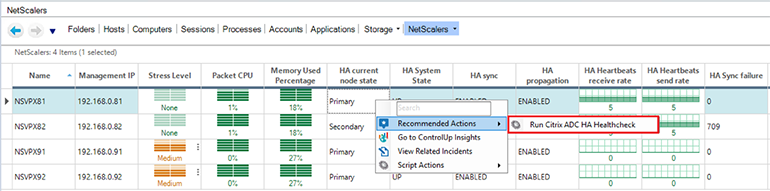
By configuring a Virtual Expert Script Action rule, we can add the script as a recommended action when you right click on a column, so you know which Script Actions can help you get more detailed information.
This way you can use the HA Healthcheck script to get an overview of the metrics for both nodes of the HA pair.
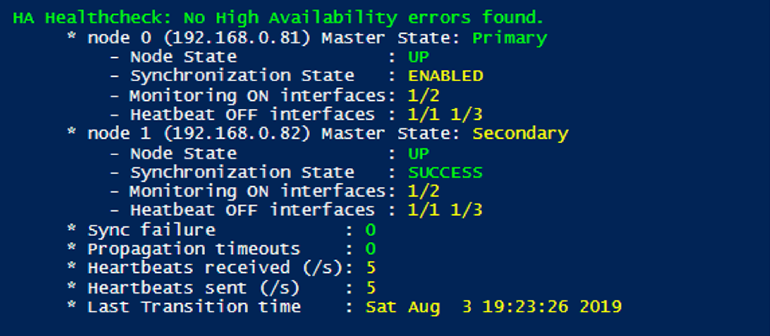
Note: The following script outputs are from the HA Heathcheck on both ADCs to get the full picture of the reported metrics for both ADCs. The first ADC (192.168.0.81) starts as the Primary node in a healthy state and the second ADC (192.168.0.82) starts as the Secondary node.
Scenario 2: HA heartbeats are not sent by node 0 (Primary)
When I disabled the HA heartbeats on ADC interface to simulate a scenario where either the interface or network infrastructure is preventing heartbeat messages to be sent to the Secondary node, I discovered that the nodes show different metric information that can indicate a problem with the heartbeats.
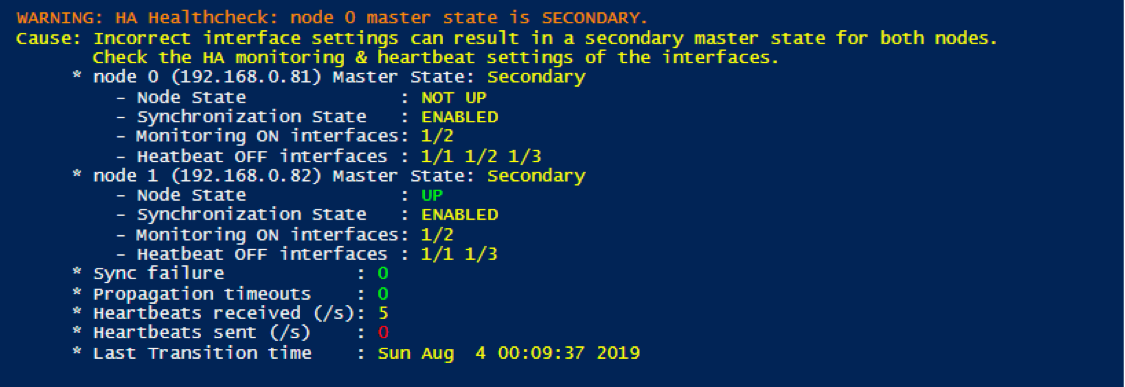
Looking at the metrics returned when the script is run against the Primary node (ADC 192.168.0.81), I noted that the node changed its master state to Secondary when it discovered it is not sending heartbeats. The metrics for node 1 are not updated and still show the original information, with a Secondary master state.
If I am only monitoring node 0, I would start to get nervous as this definitely is not a situation I want to see in a production environment.
If we run this HA Heathcheck on the second node using the same scenario, we get different metrics.
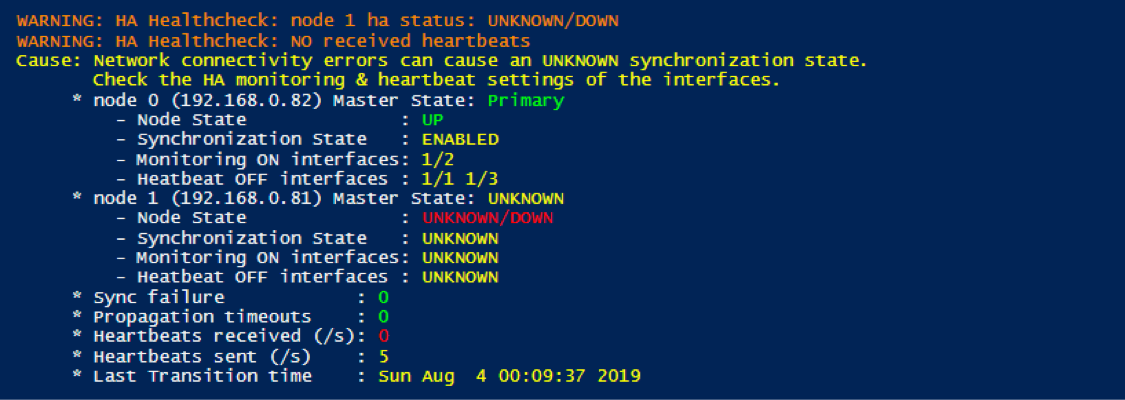
The Secondary node (ADC 192.168.0.82) has changed it master state to Primary when it discovered no heartbeats were received, realizing that something must be wrong with the other node of the HA pair. Because the Secondary node has received no heartbeats, this node has no way to know the current state of the other node and marks all metrics as UNKNOWN.
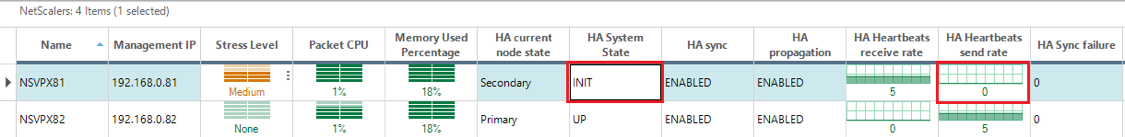
If we look at the ControlUp console, we notice that the state changes are shown from the ADC node 0 perspective, which of course holds the most accurate information.
I am working with ControlUp to ensure the state changes are flagged and recommended actions will be presented to aid you in monitoring your ADC environment and taking corrective actions when all states are not displayed as green.
Scenario 3: HA heartbeats are not sent by node 1 (Secondary)
Even though this scenario does sound like an almost identical scenario as the previous one, I did notice some differences in behavior.
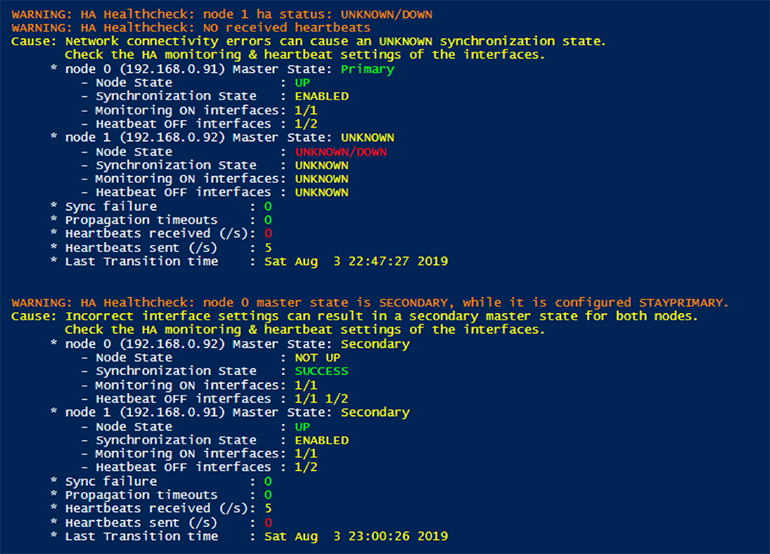
Looking at the metrics returned when the script is run against the Primary node (ADC 192.168.0.81) I noted that the node did not change it master state. It just marked the node 1 states UNKNOWN as no heartbeats were received.
The metrics on the Secondary node (ADC 192.168.0.82) did change the master state of node 0 to Secondary and marked the node state NOT UP, creating once again a situation with two Secondary master states in one HA pair.
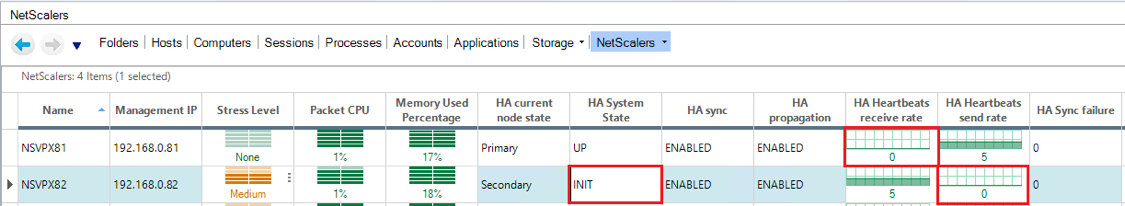
Checking the behavior in the ControlUp console, we notice that the state changes are shown from the ADC node 0 perspective, which of course holds the most accurate information.
This made me realize that it is very important to keep track of metrics for heartbeats sent and received per second. These metrics are the major indicators that something is wrong with the network configuration, automatically initiating failovers to ensure uninterrupted service.
Scenario 4: HA Sync failures
Another important metric to track is Sync failure.
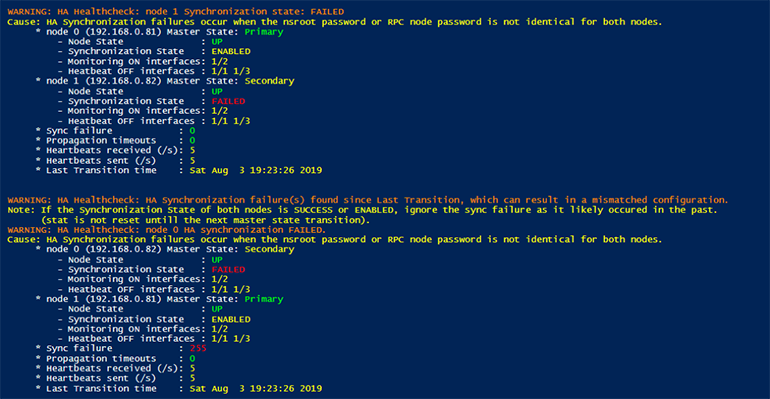
In this scenario, I changed the RPC node password on the Secondary node (ADC 192.168.0.82) to ensure the sync failure metric would increase. This metric logs the number of times a synchronization failed since the previous node transition time. The transition time indicates the last time the master state of the node changed.
The above script output shows that the synchronization failure is only logged on the Secondary node (ADC 192.168.0.82) that has the mismatched RPC node password. Both nodes do log a FAILED synchronization state, which is the best indicator to check for any synchronization failures that currently occur.
If we reset the RPC node password on the Secondary node (ADC 192.168.0.82), we’ll see that the synchronization state is changed back to SUCCESS, where the sync failure counter is not reset until the master state of the node changes (and the Last Transition time is changed).
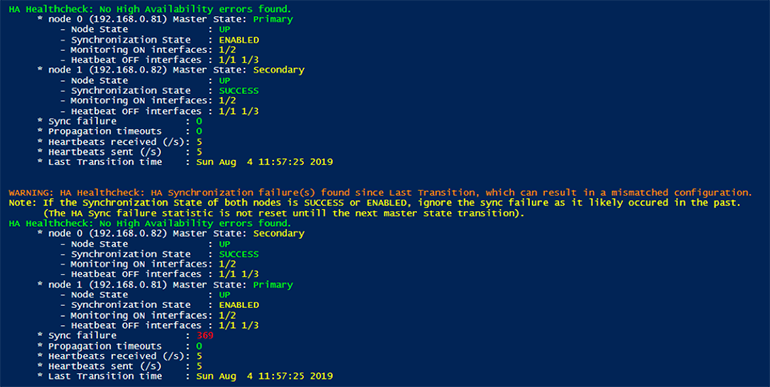
Since the sync failure statistics are not reset, even when the next synchronization is successful, the HA Healthcheck script focuses on the FAILED synchronization state and only shows a warning regarding sync failure statistics.
Checking the behavior in the ControlUp console, we notice that both the HA sync failure and HA sync metrics are logged.
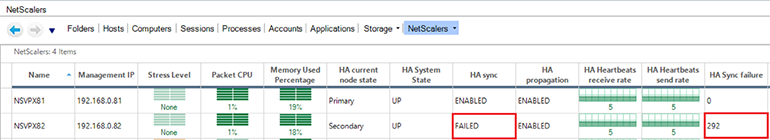
I will work with ControlUp to ensure the HA sync FAILED state is flagged and marked RED, as well as provide recommended actions to solve the problem.
Scenario 5: HA is disabled on node 1 (Secondary)
The script will also take manually configured states into account, like STAYPRIMARY and STAYSECONDARY, and it will even check for a DISABLED node.
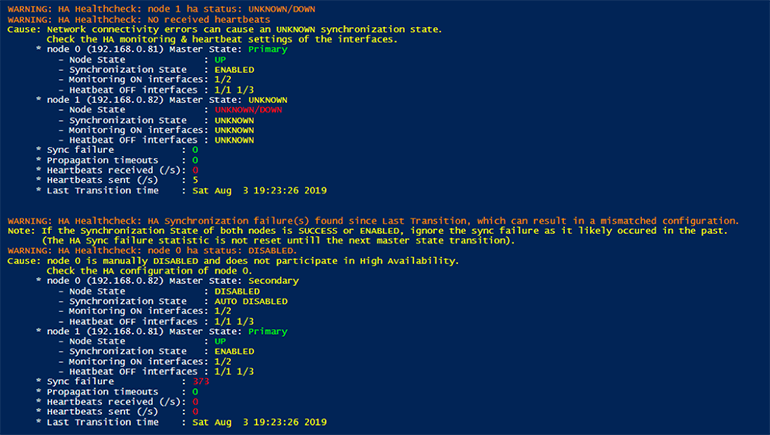
For example, when I manually disable the Secondary node (ADC 192.168.0.82), the script output from node 0 (ADC 192.168.0.81) shown below indicates that it cannot get any state metrics from the Secondary node and marks them UNKNOWN. This time the missed heartbeats are once again an indicator for ADC network connectivity challenges.
On the Secondary node (ADC 192.168.0.82) the DISABLED node state is correctly shown, making it easy to identify the risk this configuration introduces, as any primary node (192.168.0.81) failure will result in a failed service, since the Secondary node (192.168.0.82) will not take over any services due to being DISABLED.
Checking the behavior in the ControlUp console, you can see that both the HA System State and the missed heartbeats are logged, once again emphasizing the importance of the heartbeat metrics.
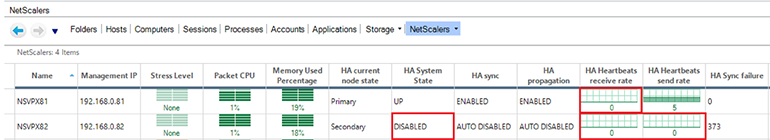
I will work with ControlUp to ensure that the HA heartbeats received and sent rate metrics are marked RED when they are 0 and to provide recommended actions.
ControlUp Automated Actions
Another great feature introduced with ControlUp 7.4 is Automated Actions, so my next challenge for the Run Citrix ADC HA Healthcheck is to work with ControlUp to get the script integrated in ControlUp as an Automated Action.
I think it will be pretty cool if we can ensure in the new Automated Action that when the HA health check is run, results are emailed automatically when the previously mentioned metrics indicate a problem with the current ADC HA configuration.
To enable the script to be part of any Automated Action, I have implemented an additional check in the Script Action that checks for the presence of stored NSCredentials (encrypted in a local XML file), so that a smartly programmed popup does not render the script useless when a non-interactive run is needed. The Script Action to store the NSCredentials is provided as well, to ensure you can create that XML file before implementing an automated HA health check for your ADCs.
Stay tuned for more updates on easy ways to keep an eye on the HA health of your ADCs.