
In today’s workplace, with people logging into work from locations all over the world, it’s imperative that IT professionals have unified endpoint monitoring and digital employee experience software that’s simple to use, helps them spot and solve problems quickly, and keeps employees productive and happy. ControlUp for Desktops is exactly that kind of solution.
ControlUp for Desktops is a powerful tool for monitoring the health of Windows, macOS, and Linux devices, no matter where they’re located. It’s SaaS-based, so you don’t have to set up or maintain infrastructure; you simply install a lightweight user-mode agent and then view the health of your device in our portal. In this article, I will share a few real-world scenarios where I was able to use ControlUp for Desktops to diagnose and resolve a variety of issues with end-users’ devices.
Scenario One: “The Hog”
The CPU is a good indicator of the overall performance of a system. When CPU usage is unusually high, it can be an indicator of an application that has gone amuck (or simply been badly coded) or that a user has outgrown the capabilities of their current endpoint device. With this in mind, CPU hogging is one of the first metrics I examine.
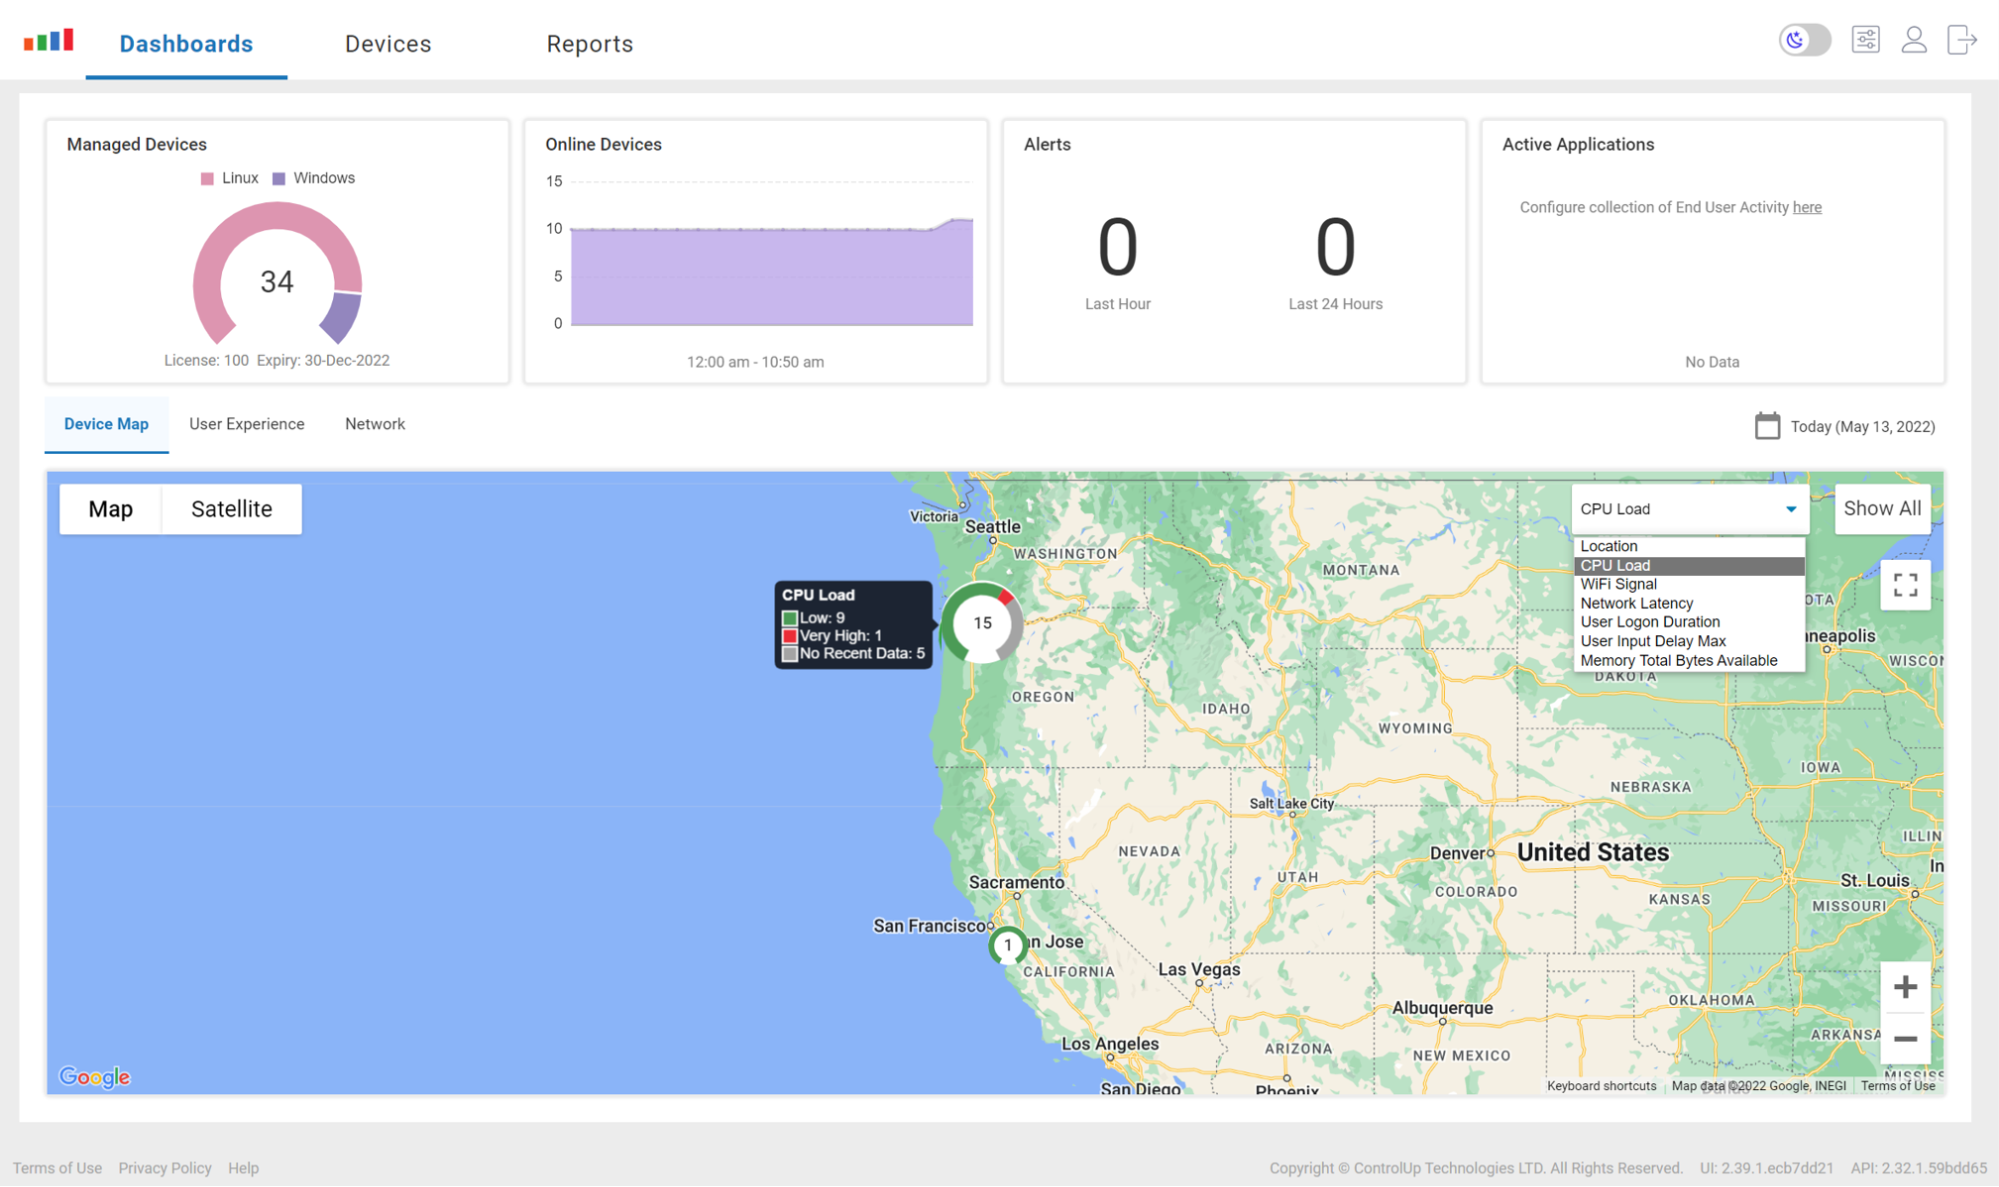
When you first log in to the ControlUp for Desktops portal, you are presented with the “Home” dashboard. If you are somewhere else in the portal, you can return to Home by selecting the Dashboard tab and then selecting Home from the drop-down menu.

This Home dashboard is where I start my day because it provides me with an overview of the devices I’m managing. From there, I go through the different metrics in the map drop-down menu.
In the screenshot below, you can see that after I clicked CPU Load from the menu, one of the devices had a red indicator showing an elevated CPU load.
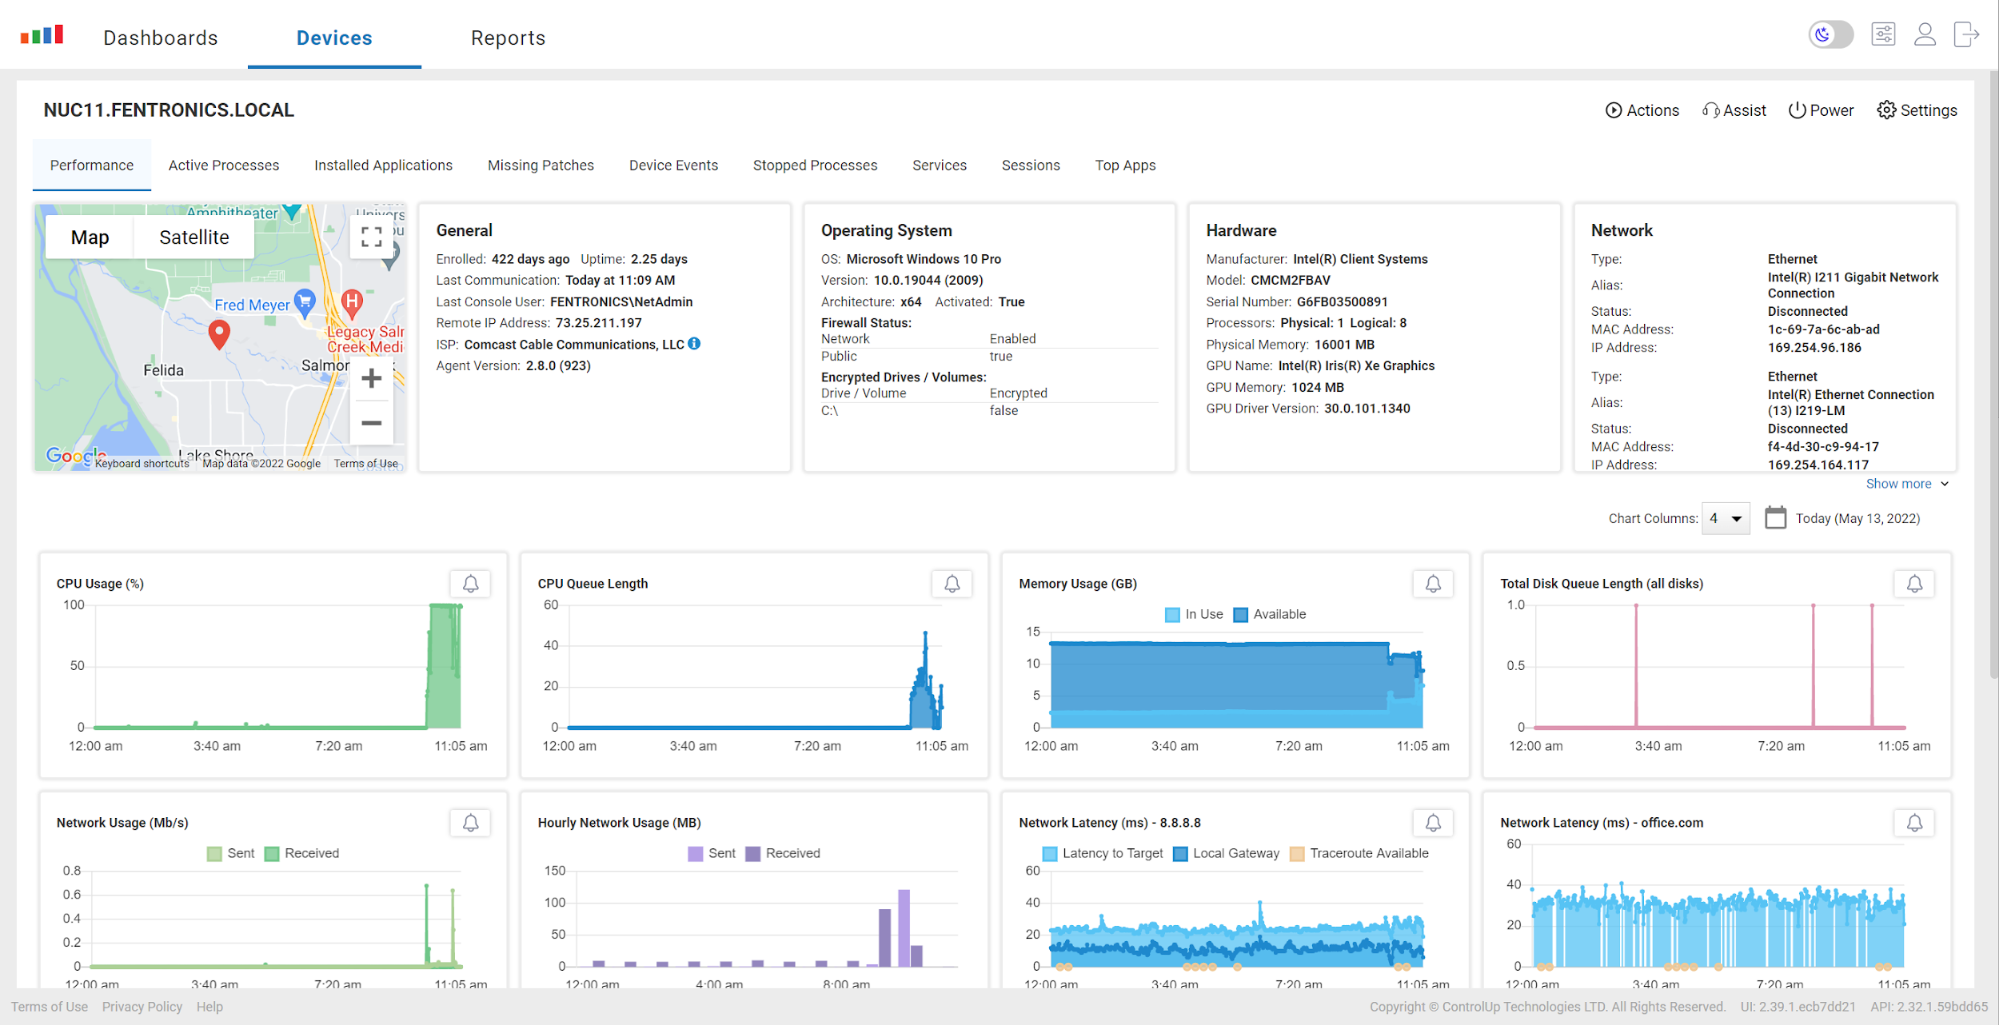
I clicked on the target, which brought up a list of the devices in that location. By sorting the CPU Usage field, I was able to identify the device with high CPU usage at the top of the list.

I clicked on the CPU graph to bring up a more detailed view of the device.
From this view, I could see that the CPU issue had started only recently. When I hovered over the graph, I could see the exact time (9:59 a.m.) when the high CPU usage began.
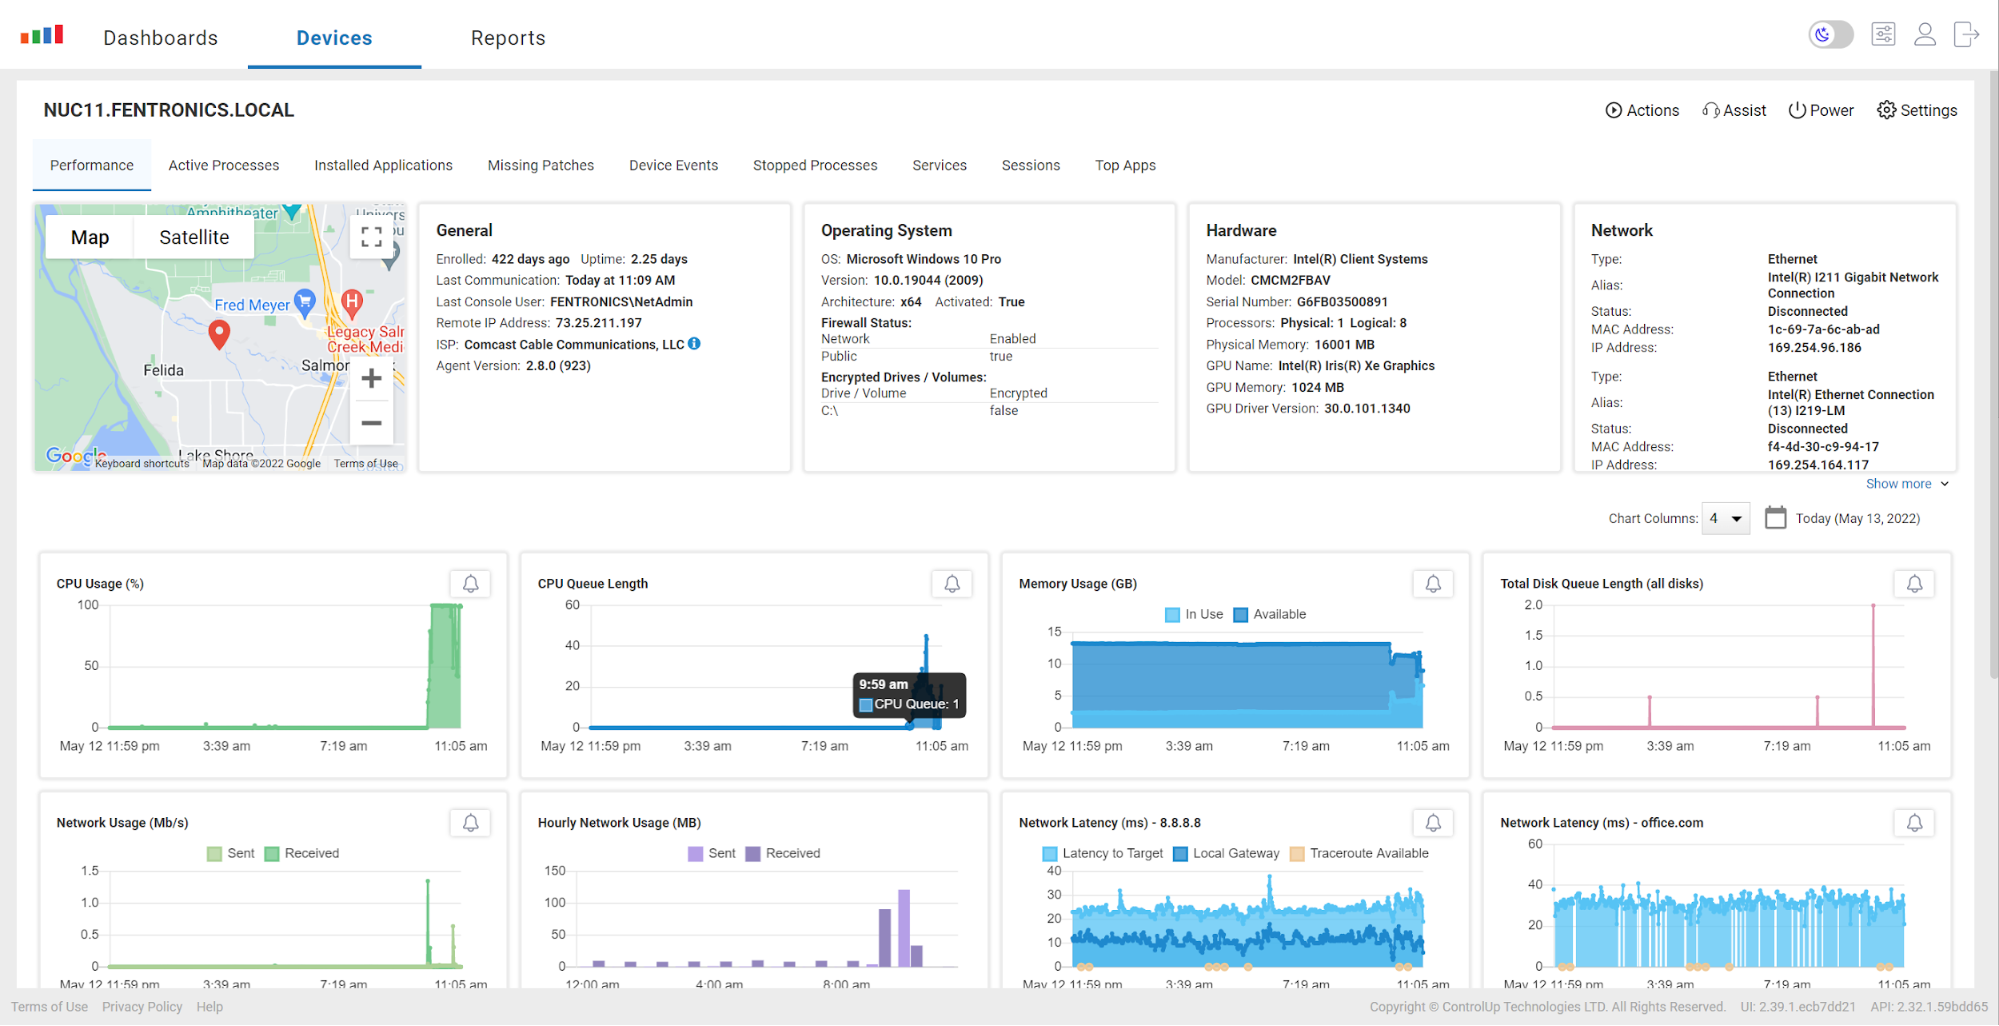
By clicking the graph, I could further zoom in on the CPU queue.

I clicked Active Processes to identify the cause of the issue, which, in this case, was viewperf.exe.
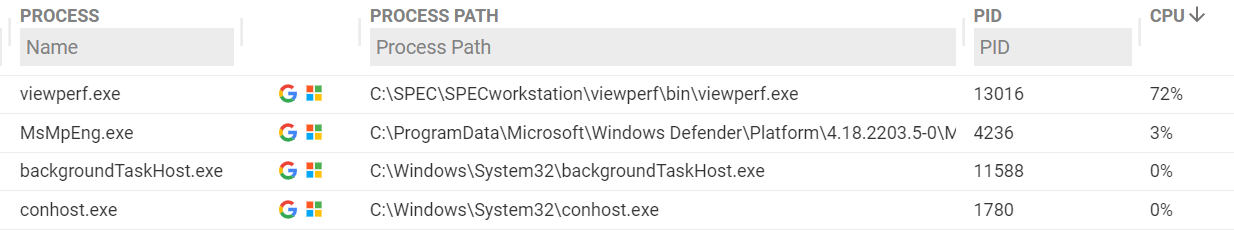
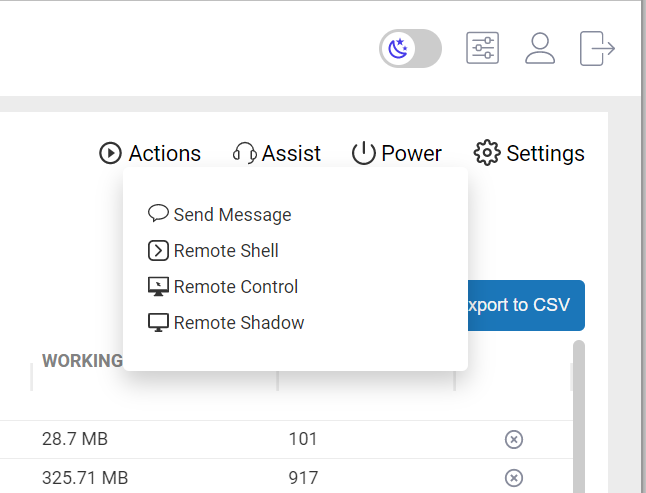
I could’ve killed the process by clicking the “x” at the end of the row, but since I wanted to see what was going on, I selected Remote Shadow from the Assist drop-down menu, which notified the user that I wanted to shadow their screen.
The remote shadow session showed that the user was running SPECworkstation to benchmark the computer.

When I called the user, he told me that they were benchmarking the system because they were considering purchasing a bunch of these systems and they wanted to see how well they performed.
With just a handful of clicks and in under a minute, I was able to identify the program that was using a majority of the CPU cycles on a device, and also get visual confirmation of what the user was seeing. If I had needed to, with another click, I could have ended the process that was causing the issue.
Scenario Two: “Plastered”
One of the more common issues that we are seeing with regards to remote work environments is that of home networks. These issues can be difficult to diagnose given the plethora of possible causes and variables.
In one case, a user called me to report that they were having issues with their SaaS applications.
I went to the Devices tab and entered their username (user01) in the search box, and I could immediately see that their Wi-Fi signal and network latency were bad. At one point, the Wi-Fi signal dropped down to 24% and at other times, the network lost connectivity completely.

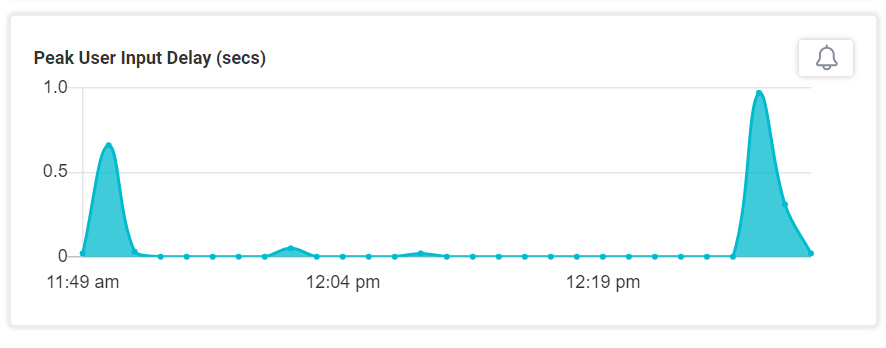
During this time, the Peak User Input Delay (the time it takes from clicking an object to getting feedback) was one second!
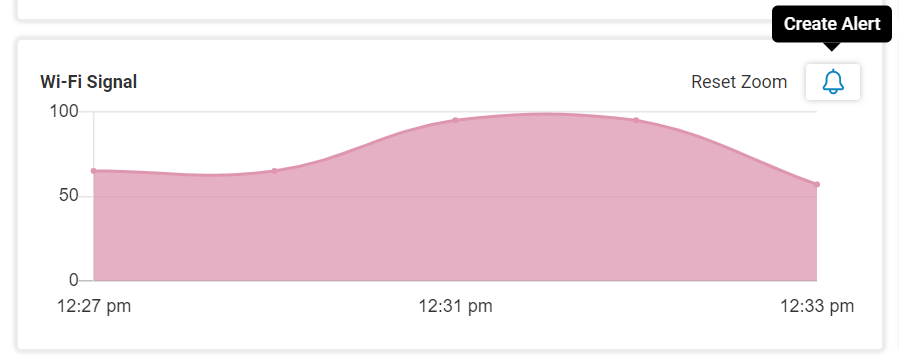
I examined the last month of his Wi-Fi signal strength and noticed that the strength had only degraded within the previous hour. After talking to him, he said that he had recently started working in a new location. Once he moved back to his original spot, the Wi-Fi signal was back to near 100%. After further chatting with him, I found out that he lived in an older house that was of lath and plaster construction. Lath is a metal screen that blocks electromagnetic transmission, which acts as a Faraday shield and impedes the Wi-Fi signal.
After thinking more about it, I set up an alert to notify me when the Wi-Fi was below 80% on any of the systems that I was monitoring.
It took just a few minutes to see that the issue was not with their SaaS application, but with the physical space in which they were working.
Scenario Three: “Too Much Authority”
I was tasked with identifying all the users on Windows devices that had administrator privileges. This one was dead simple because under the Reports tab, there is a pre-built report that does just that.
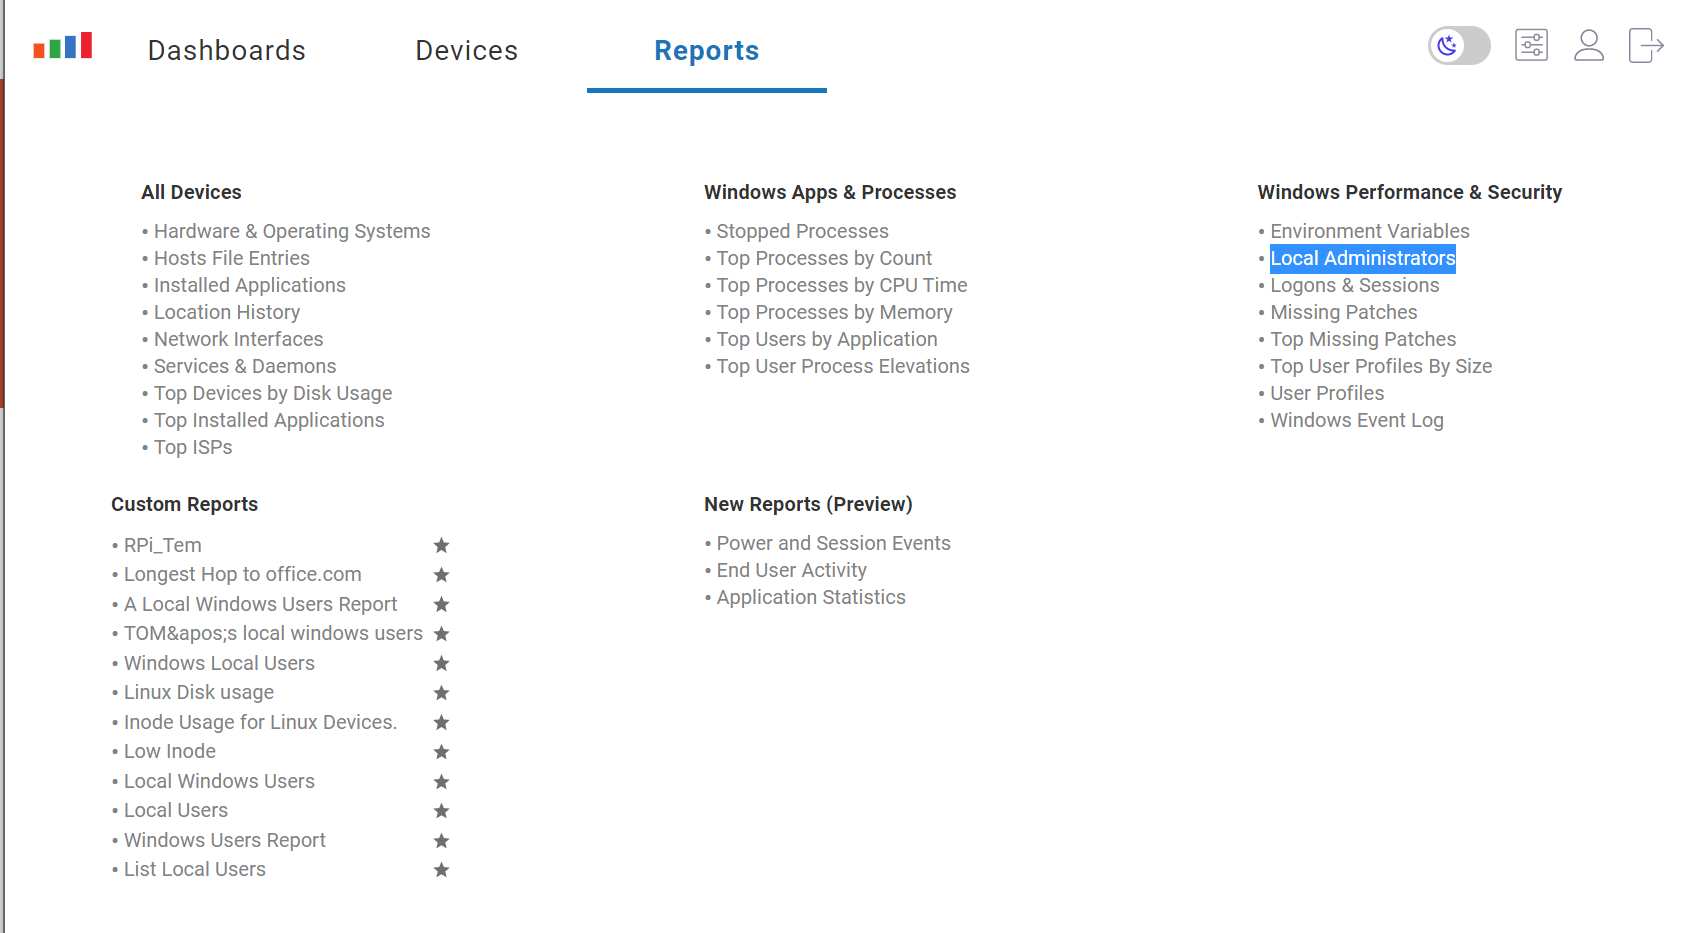
By clicking the Local Administrator report, I was given a list of local administrator accounts.
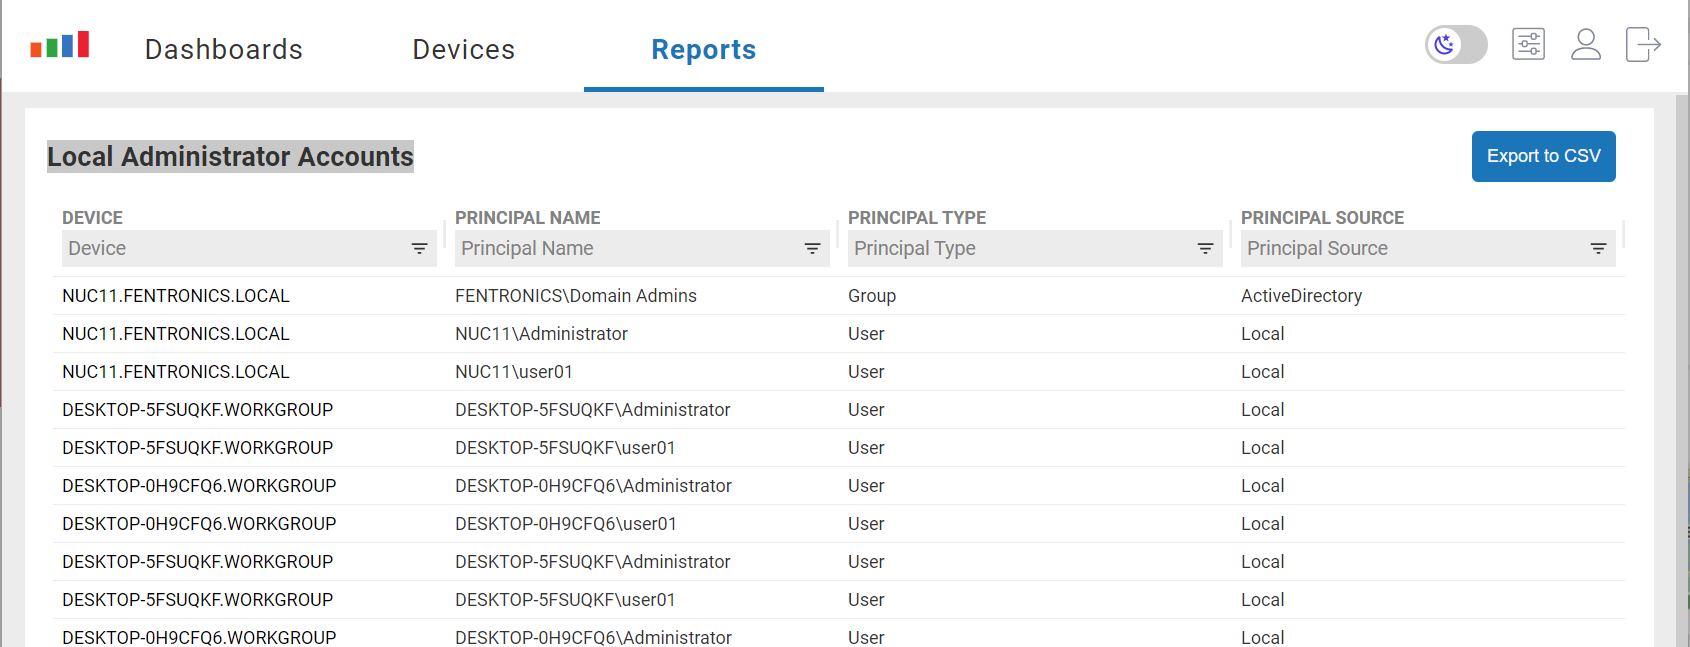
I was able to export the list as a CSV file and send it off to the manager who’d requested it.
Although this particular report was pre-built, one of the cool things about ControlUp for Desktops is that custom reports can be built from any of the hundreds of metrics that it collects.
This article barely scratches the surface of the power of ControlUp for Desktops, but I think that these scenarios illustrate how, by using only one tool, IT administrators and help desk professionals can more easily identify the root cause of problems and resolve them quickly and efficiently.
For more information on ControlUp’s solutions, be sure to read some of the other blogs and articles we’ve written, or simply reach out to our sales team to schedule a demo and see how, in less than 10 minutes, you can start monitoring devices in your environment.