ControlUp has evolved and grown significantly over the years, adding more value and functionalities. Our teams constantly strive to make ControlUp as useful and user friendly as possible, making sure you get all the visibility you need, the power to take action and fix problems immediately, and the ability to make sense of the information in the form of ControlUp Insights, drilling into past events and not limiting your exploratory powers to real-time. Continuing our tradition of constant development and improvement, we are proud to unveil ControlUp V7, the next step in our evolution.
Enhanced DataStore Views
Thus far, ControlUp has displayed some storage metrics via the hosts. As we considered this to be an important aspect of your environment, DataStores now have a whole new view in the ControlUp real-time console, providing live rich and detailed metrics about your Datastores, Datastores on hosts, vDisks and Logical Disks. The familiar principles of the ControlUp real-time grid apply here as well, which means you have the built in ability to sort and drill down into any object and explore issues to get to the root cause, as well as take action and assign alerts in order to get notified when thresholds are crossed. This makes for powerful and swift troubleshooting of any storage related issue in your environment.

Cloud Integration Management
With ControlUp V7, we are introducing a brand new capability – managing your AWS EC2 instances using ControlUp. Simply add your AWS connection details and your AWS EC2 instances to ControlUp and you’ll get a plethora of real-time performance metrics as well as cost metrics, see all the different regions and instances consolidated in one view, manage them and get alerts based on triggers which you define. Controlling your AWS EC2 instances from one central place in an easy and intuitive ControlUp interface.

Top Insights Dashboard
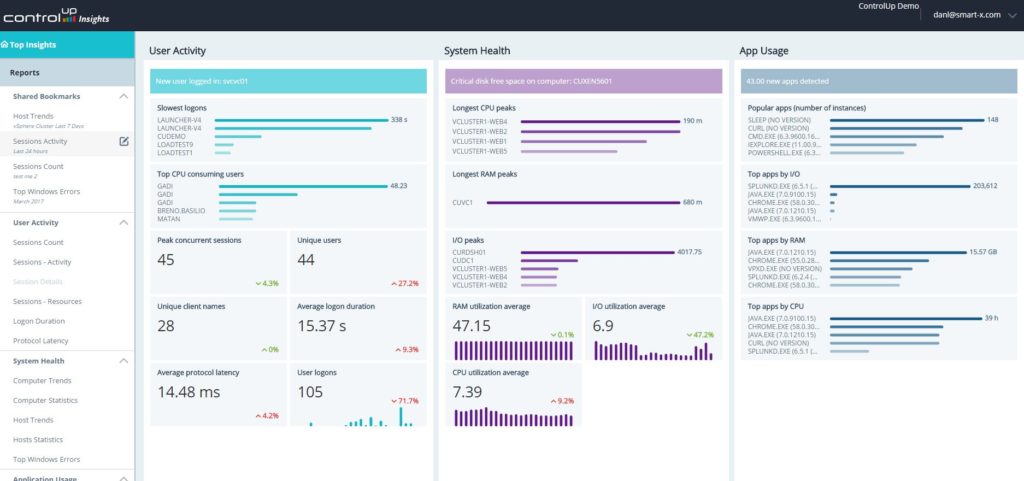
ControlUp Insights is an extremely powerful analytic tool, with a vast selection of reports spanning as far as a year back. It’s potential becomes even more apparent with our new Top Insights dashboard – an interactive dashboard guaranteed to quickly become your first place to visit when using ControlUp Insights, as it brings you top KPI’s such as slowest logon, longest peak CPU or I/O, Most popular app and more. All of these are interactive – simply click on any of them to be directed to the specifically pre-defined report showing that data. There are also unique BI findings to show you unusual or interesting facts about your environment, which would otherwise be difficult to reach. For example, A user who’s logged in after a long absence, a VM showing critically low disk space or the amount of new applications detected. All of which are of course interactive, allowing you to drill down to the report showing you that specific data.

Browser URL Metrics
Our business environments are increasingly dominated by browsers, used for both external sites as well as internal ones. ControlUp now delivers new columns which display the users’ browser URL domain and the users’ browser URL, allowing you to easily correlate performance issues to specific URLs – for example, if you’re using a CRM or PM software via intranet you’ll know to associate any peaks or strained resources related to those specific applications. Having the URL shown as a real-time metric can prove to be a very valuable tool.

Join The Ride
Get your free trial by clicking here.
To read the V7 release notes, click here.