Edge DX customers love being able to monitor the performance of Unified Communication (UC) applications like Zoom or Teams and to carry out forensic analyses when they fail or behave poorly. But our customers have wanted more, so we are proud to announce that we now offer real-time UC monitoring – you can now instantaneously identify the UC calls having issues and, more importantly, why.
This feature is located under the Dashboards tab as Live Callers Dashboard (Figure 1).
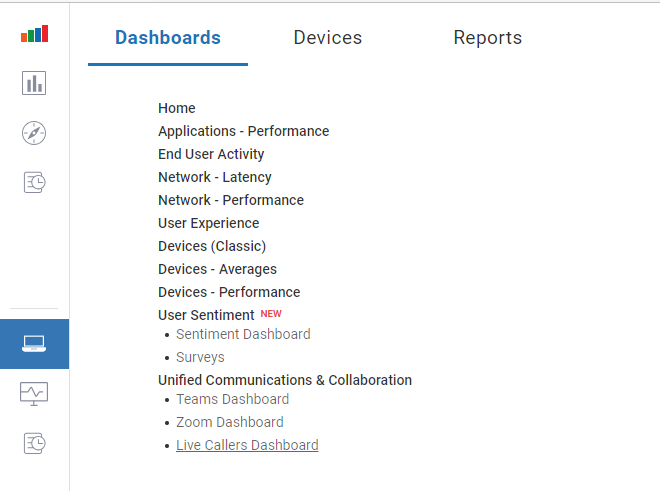
Figure 1 – Live Callers Dashboard
This dashboard shows all the currently active Teams and Zoom calls.
The top of this dashboard (Figure 2) gives an overview of all the calls being monitored. This is useful for determining the overall health of an organization (User Distribution by Experience) or identifying the users having issues with their UC applications (Top Users by Worst Experience).
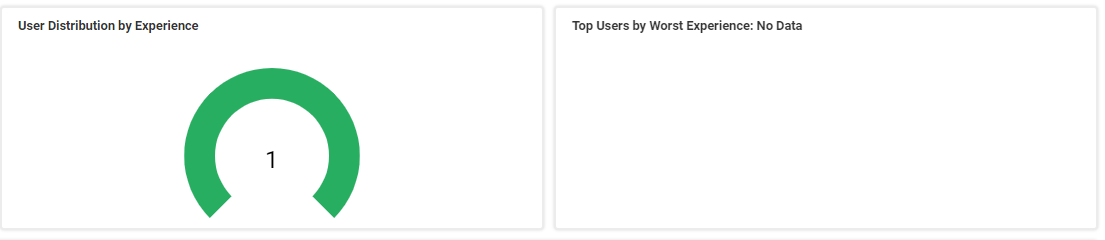
Figure 2 – Team and Zoom Calls Dashboard
The lower portion of the dashboard (Figure 3) lists all the live calls.
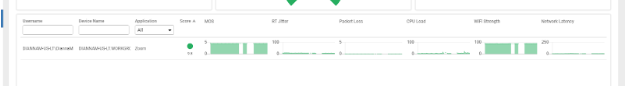
Figure 3 – Live Calls
If you are investigating a particular user, enter their name or the device’s name in the search box. If you are looking for users having a poor experience, you can sort by the Score column.
Clicking a device will bring you to its dashboard (Figure 4), where you can look more closely at it.
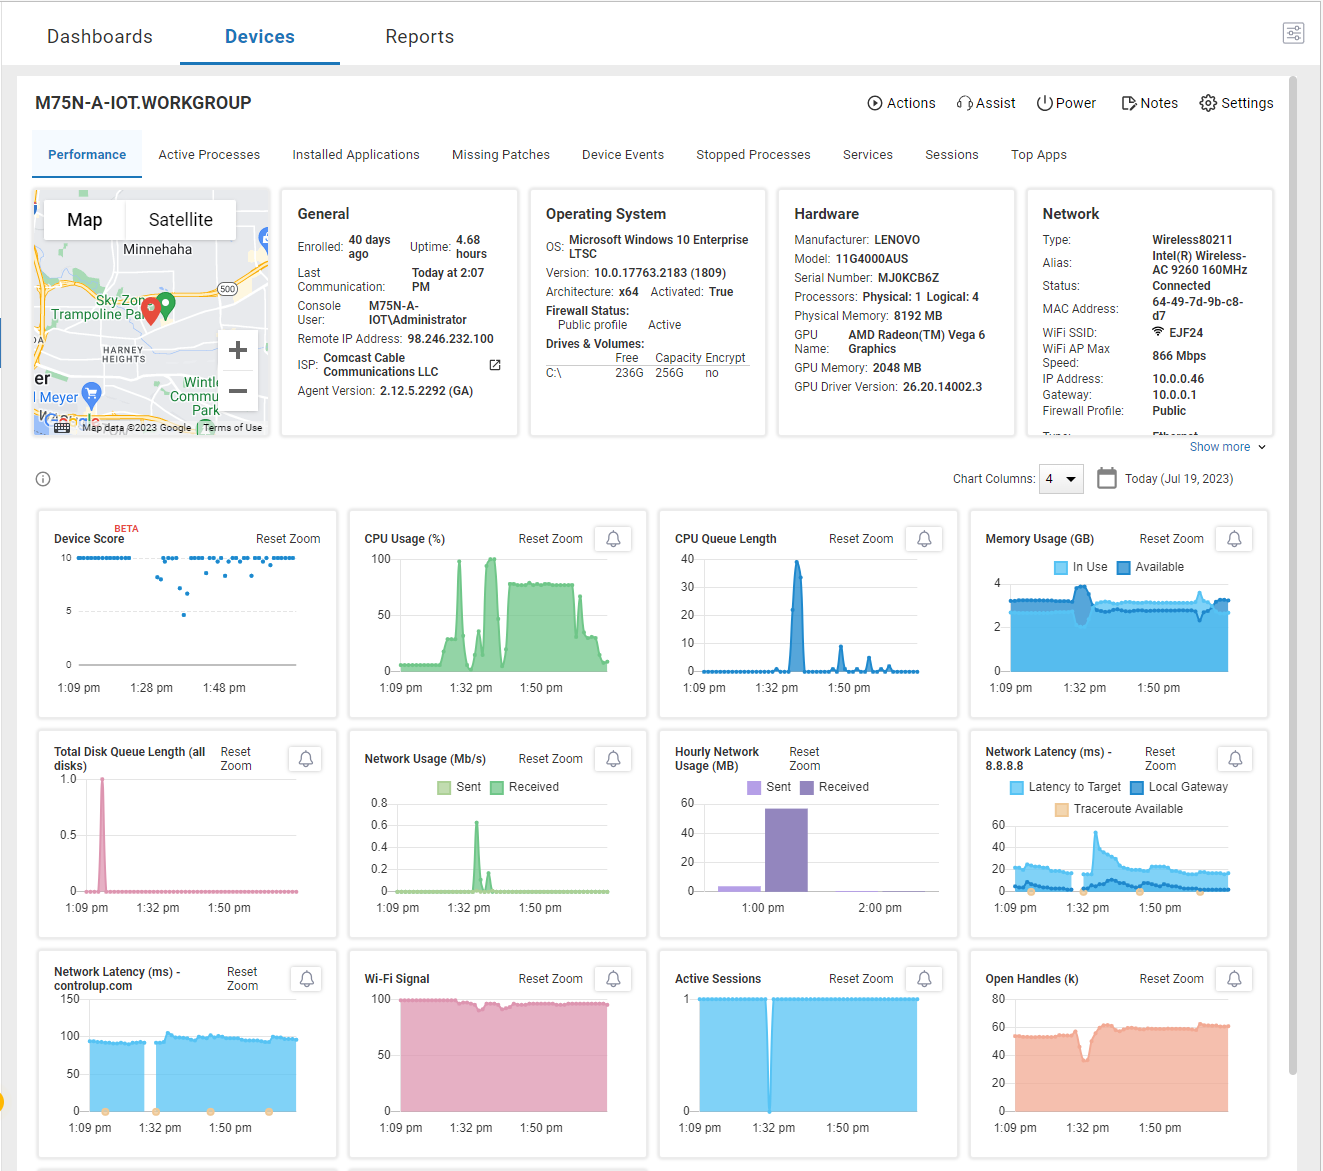
Figure 4 – Device Dashboard
From this page, you can view all metrics for the device or interact with it using Edge DX’s Actions and Assist features. For example, if you need to clear a user’s Zoom cache, you could run a predefined script on it or instantiate a remote shell and do it manually. If you want to see what the user is experiencing, you could use Remote Control or Remote Shadow. These tools allow you to quickly identify issues that may be causing the problem.
In one case, a Zoom user’s call kept cutting out. We could see the problem in real-time using the Live Callers dashboard; we navigated to the device we saw had high CPU usage (Figure 5).
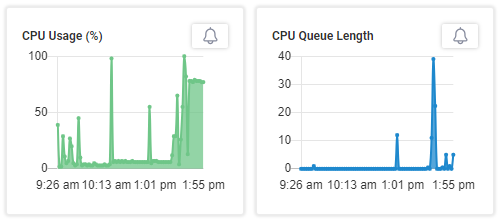
Figure 5 – Live Callers CPU Usage
We used the device’s Active Processes dashboard (Figure 6) to determine that PowerShell scripts consumed about 75% of the CPU cycles.
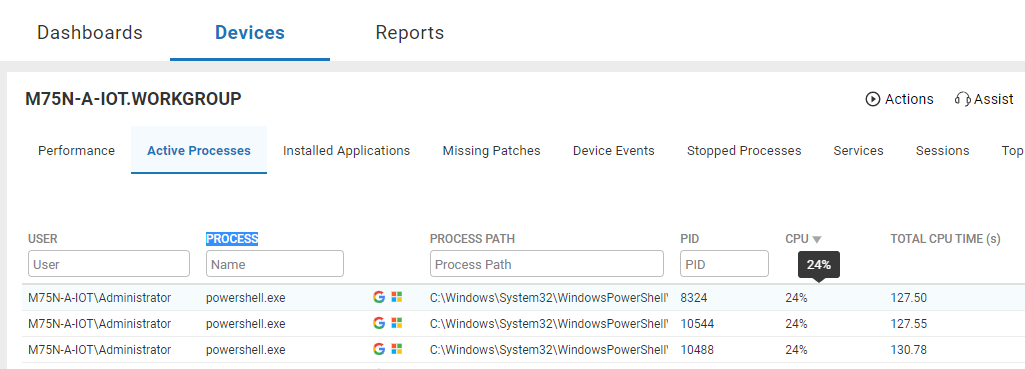
Figure 6 – Active Processes Dashboard
After conferring with the user, we killed the applications (Figure 7) from the same dashboard.
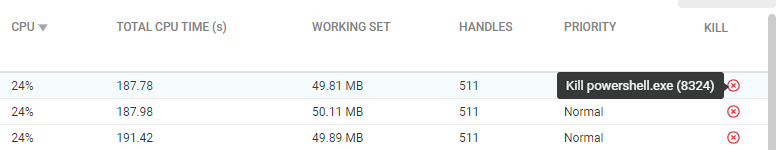
Figure 7 – Applications
Within seconds, the call improved, and the CPU utilization returned to normal (Figure 8).

Figure 8 – CPU Status
We know that UC applications like Teams and Zoom are the communications backbone for many organizations. Using our new Live Callers dashboard, you can monitor these applications in real time and correct issues that may be causing users to have a less-than-ideal digital experience.
For more information, be sure to visit our Edge DX page or schedule a demo with a ControlUp sales engineer.