We are happy to announce the addition of our new Sizing Recommendation Report, the second member of our Virtual Expert™ line of reports.
ControlUp Top Insights Dashboard was our first Virtual Expert report, which beyond summarizing usage over the last 24 hours, also delivers valuable insights about different moving parts within the monitored environment. I like to think of Top Insights as the admin’s personal navigator, red flagging issues that may arise in one of the computation components. For example, the average logon time changed drastically compared the previous period, a certain application used way more resources than the average global benchmark, a new trend is starting to form within your daily active users? You’ll know it all.
Top Insights allowed us to find and notify admins about suspicious trends, detecting abnormalities by running a machine learning based algorithm – but we stopped at the notification step. Admins still needed to manually drill down into these highlighted trends to find the reason, mainly because we cannot know, for example, what drove more users connect to specific published resource.
The Sizing Recommendation Report is Virtual Expert-based report which, like its name implies, takes it a step further and uses data analysis and crunching to deliver actionable recommendations on how your environment can be optimized.
Our goal for this feature is simple: It’s to make it easier to optimize your resources. This new capability clearly spells out whether a VM needs more resources, which gives you a better and more consistent performance, or whether a VM has been provisioned resources it’s not using, which saves you money and/or allows you to reassign those resources to other VMs.
Our line of thought was to start with the basics. ControlUp already tracks a history of server and computer resource consumption data, and it has unique visibility into resource consumption and performance as measured from both the host and from within the guest OS. Host view tells us what resources have been allocated and the guest OS view gives us exact performance information. This puts us in a unique position to be able to make fact-based recommendations on resource sizing of monitored instances.
The Sizing Recommendation report is divided into two main sections: The summary and clustering of the recommendations, and the per instance grid where you’ll see per server/computer data and its specific recommendations.
Before delving into the report, let’s spend a minute to discuss the algorithm behind the recommendations. First, we collected a month’s worth of data on a server and measured the 95th percentile of CPU and RAM utilization. That is the number that only 5% of metrics are above, in other words, the peaks.
Second, we add a 15% buffer on top of the 95th percentile CPU and RAM metrics, to stay on the safe side and keep enough space for future growth.
Third, we calculate the difference between that number and the resource allocation number assigned to the server.
In other words, amount of over – or under-provisioning = actual usage (95th percentile + 15% buffer) – actual allocation.
Let’s start with an overview of the first section of the report, where you will see a high-level summary of CPU and RAM utilization data.
Computers by CPU/RAM sizing widget will show details about the percentage of total computers at each sizing state, how many are over-, under- and right-sized solely based on CPU or RAM utilization.
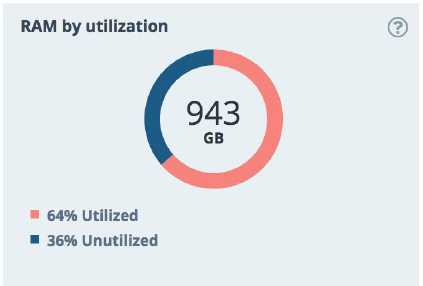
CPU/RAM by utilization widget will show how many CPUs or RAM units (GB, in case of RAM) are utilized and unutilized out of the total assigned resources.

On the same token, the average used/assigned CPUs or RAM widget will show the average metrics of used vs assigned resources across all monitored instances.
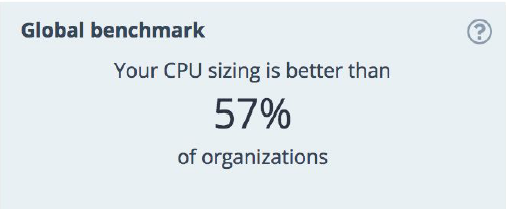
Remember my rambling about “admin’s personal navigator”? Good, because precisely for that reason we added a global benchmark widget, where you can see how your CPU and RAM utilization compares to other organizations worldwide.

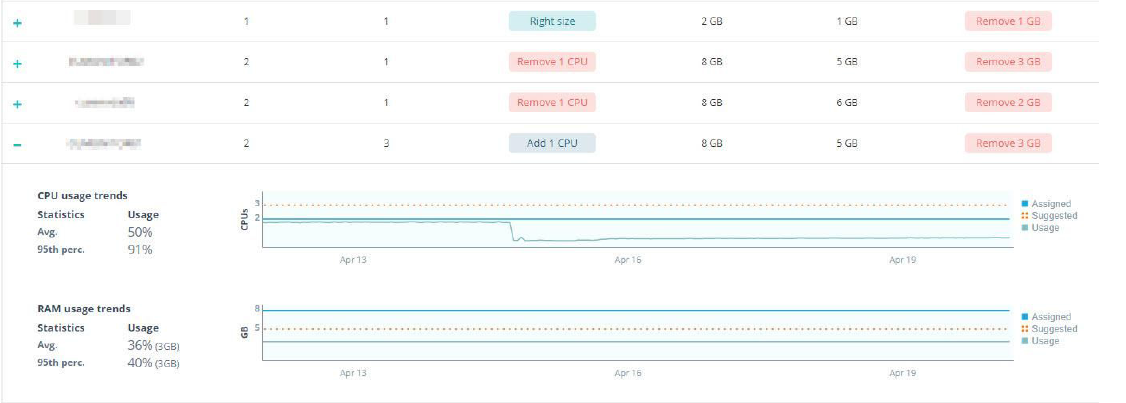
The second section of the report shows per instance data, such as current assigned resources, suggested resources and recommendations (how much resources to add or remove) based on your data.
You can click on any instance to see its CPU and RAM behavior during the past month alongside the assigned and suggested resources – to see the rationale behind the recommendations. Note that the RAM usage trend is based on actual in-guest data.

Gauging whether you’re over-spending or under-spending on your IT infrastructure can be a challenging task, and the repercussions, in terms of spend and in terms of your user experience and overall IT performance, can be significant.
Using ControlUp for this task means bringing solid factual information into the decision process. It enables you to make informed, intelligent decisions based on your actual current performance and needs. Because ControlUp continuously monitors your IT infrastructure, it makes perfect sense to put all that information into an algorithm which will churn out intelligent recommendations based on the actual usage and patterns.
Like what you see and want to try it out for yourself? Download your free trial here and experience it first hand, or talk to us if you have any questions.