
Some time has passed since my previous review of “What’s new in ControlUp Insights” so it’s time for an update – what’s changed? What cool features are available? And what’s in store for the future?
As ControlUp Insights chalks up more reports and functionalities, the historical reporting and analytics platform keeps improving, growing and evolving, providing more value as time goes by.
While there are plenty of efforts to improve the back end, responsiveness and overall user experience, I’d like to tell you about the new reports available, the report automation feature, and the improved drill down capabilities.
New reports
- Host Statistics Report
This report shows a table view of your hypervisors with an array of performance metric columns, which makes for easy detection of your top consumers. Which is my highest CPU consuming host? How many VMs are running on each hypervisor? Which host has the highest disk usage?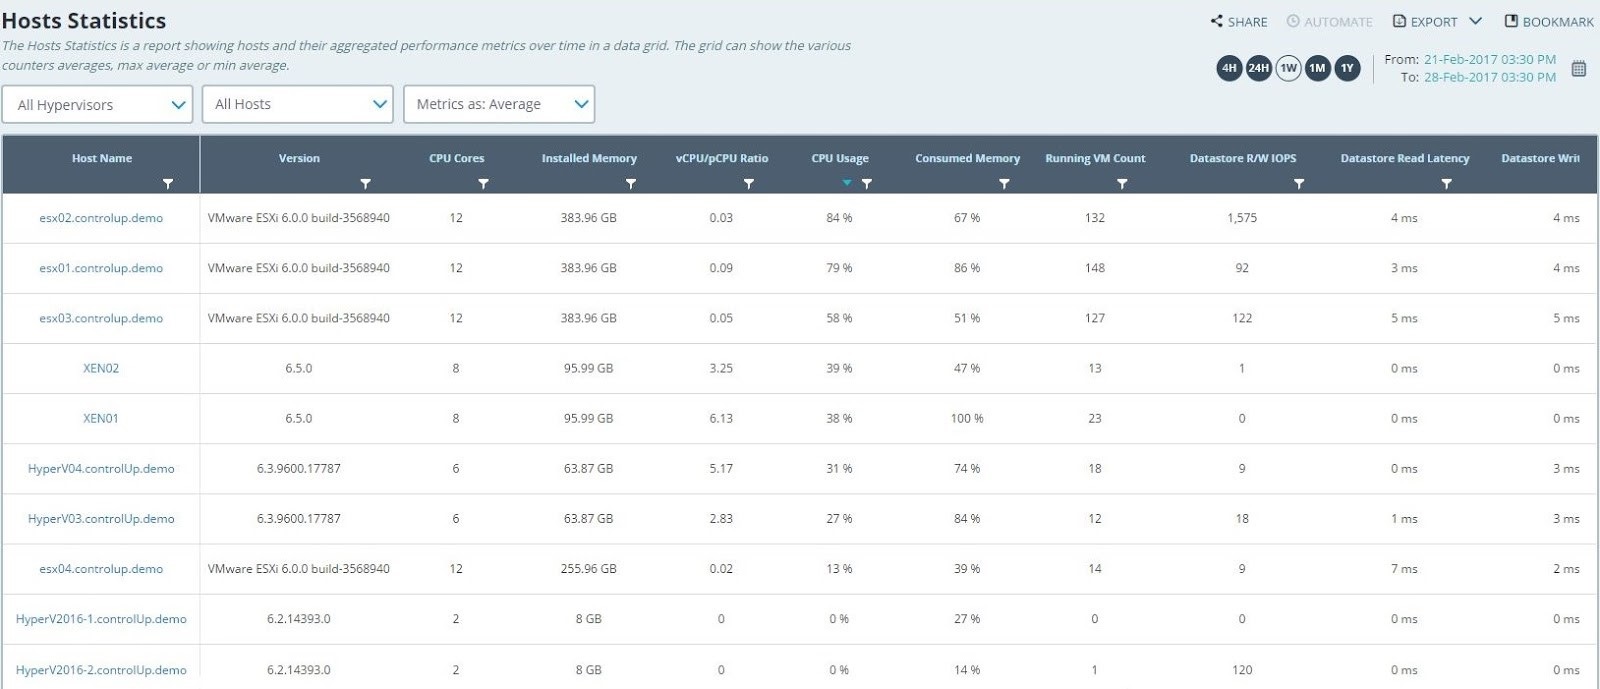
Host Statistics – Table View
By spotting the highest scoring consumers over a selected period of time, you can analyze your hosts’ performance, determine which hosts are overworked and which are under utilized, distribute your workload in a more efficient manner, and easily drill down into the Host Trends report in order to explore the specific hypervisor’s stats to see the performance – I/O, latency, CPU, RAM and Network.
- Application Trends Report
The Application Trends report shows the resource consumption of specific applications in any selected period of time, further filtered according to app versions (including multiple versions of each application and their comparison).
The report also shows your organization’s average and a resource consumption global benchmark for that application. By selecting any application in your environment you can see the CPU, RAM and I/O utilization of the selected application and click on any data point to see the actual samples collected at that specific point in time, and drill down further into the usage patterns and actual users who were using the application in the Application Usage Details report. This provides a solid basis to understand which are your resource guzzling applications, or if there is a concrete problem which has been causing memory leaks, CPU drains or I/O spikes, and whether your application resource consumption is on par with similar organizations.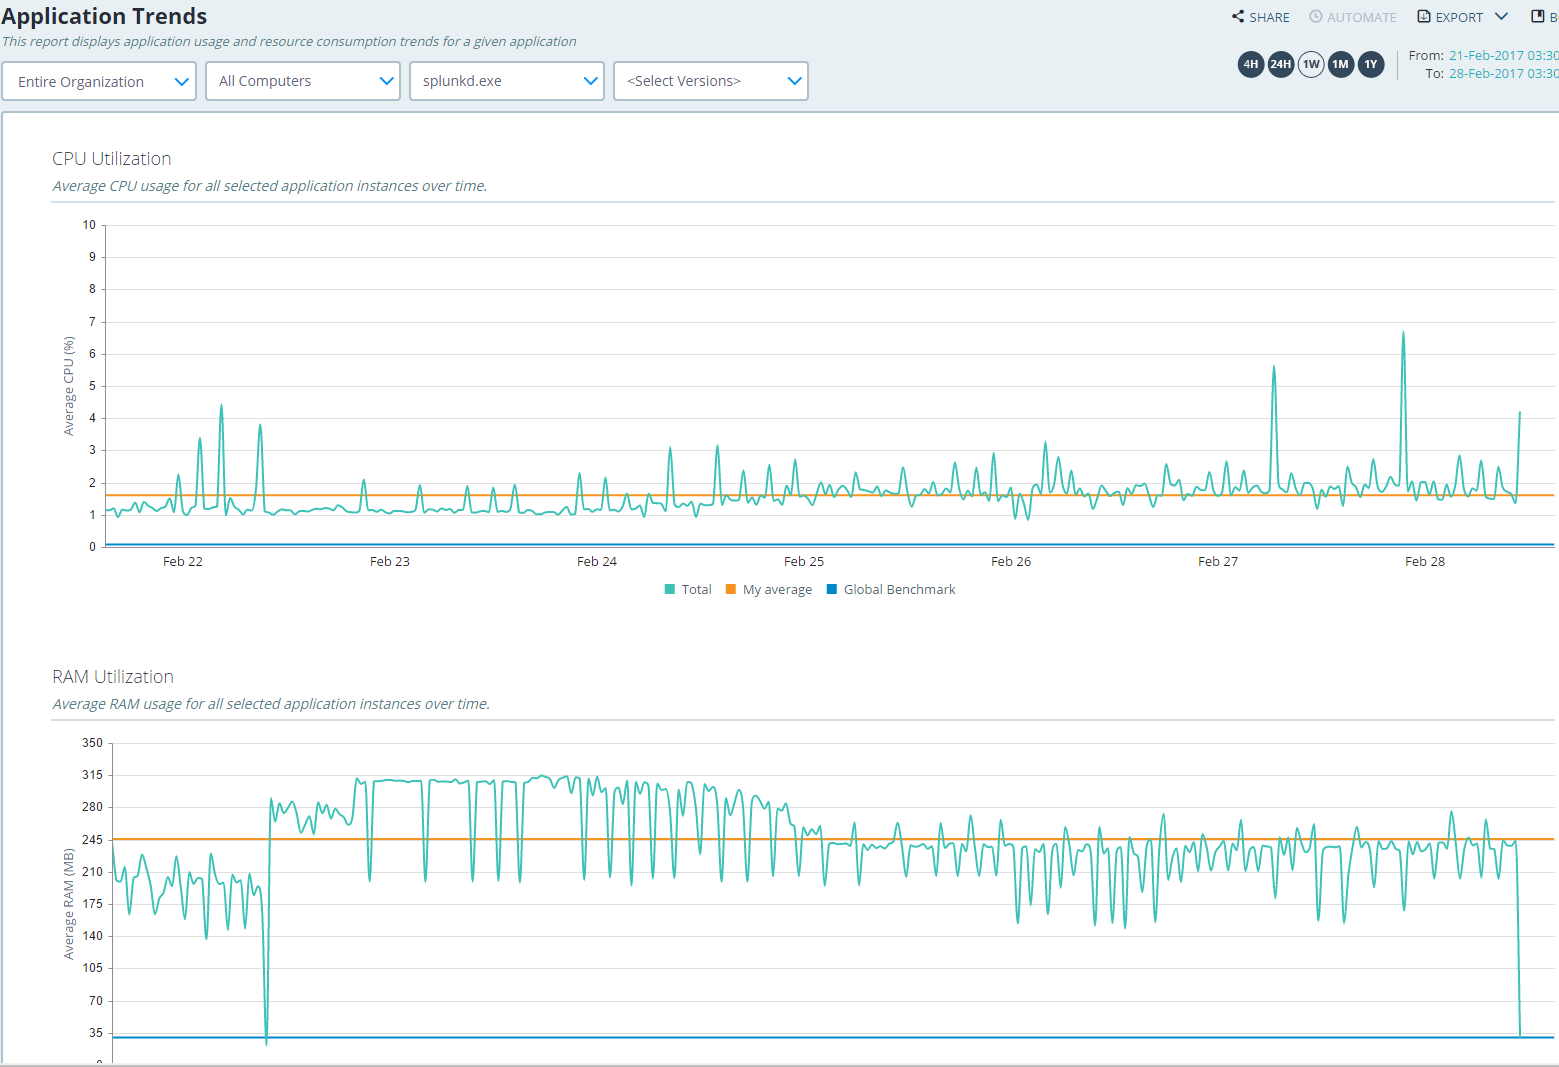
Application Trends Report – resource consumption per app over time
- Report Automation
Now you can easily share ControlUp Insights reports and schedule them to be sent out to a manager, a colleague or a customer at regular predetermined times. The recipient doesn’t need to have a ControlUp Insights user account, but the email will also include a direct link to the predefined insights report. A recipient who does not have a ControlUp Insights user account will be able to download the report as a file. Report automation extends the value of ControlUp Insights beyond the organization’s ControlUp users and makes the data readily available to anyone who could use it.
Each report allows for scheduling of automated reports by clicking on the “Automate” button on the top right corner. Manage all your scheduled reports by clicking on your user name on the top right hand side, and selecting “automated reports”.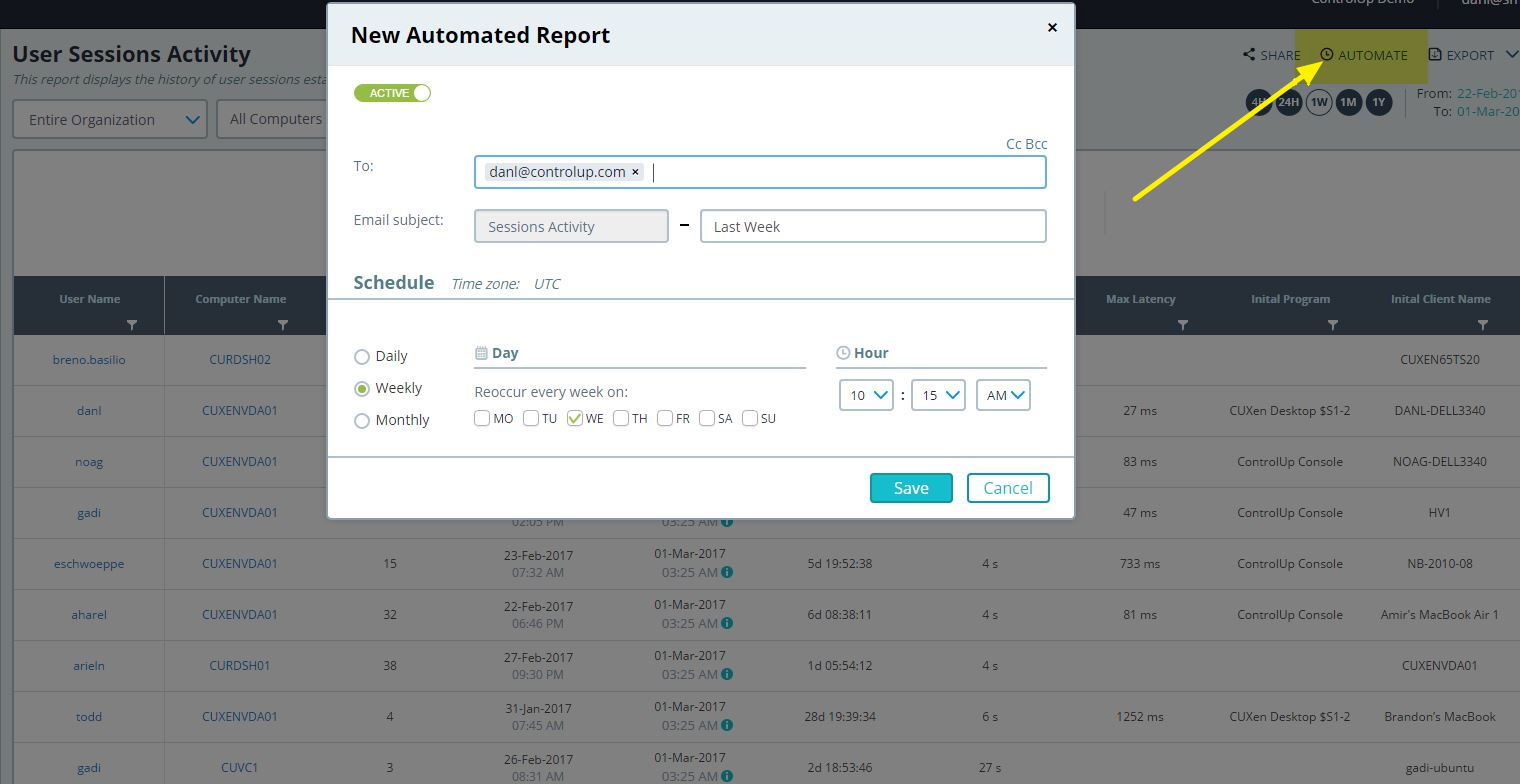
How to use report automation
- Export Any Report To PDF
Now any report of your choice can be exported as a PDF file – simply click on Export on the top right hand corner and select PDF. This makes sharing reports that much easier.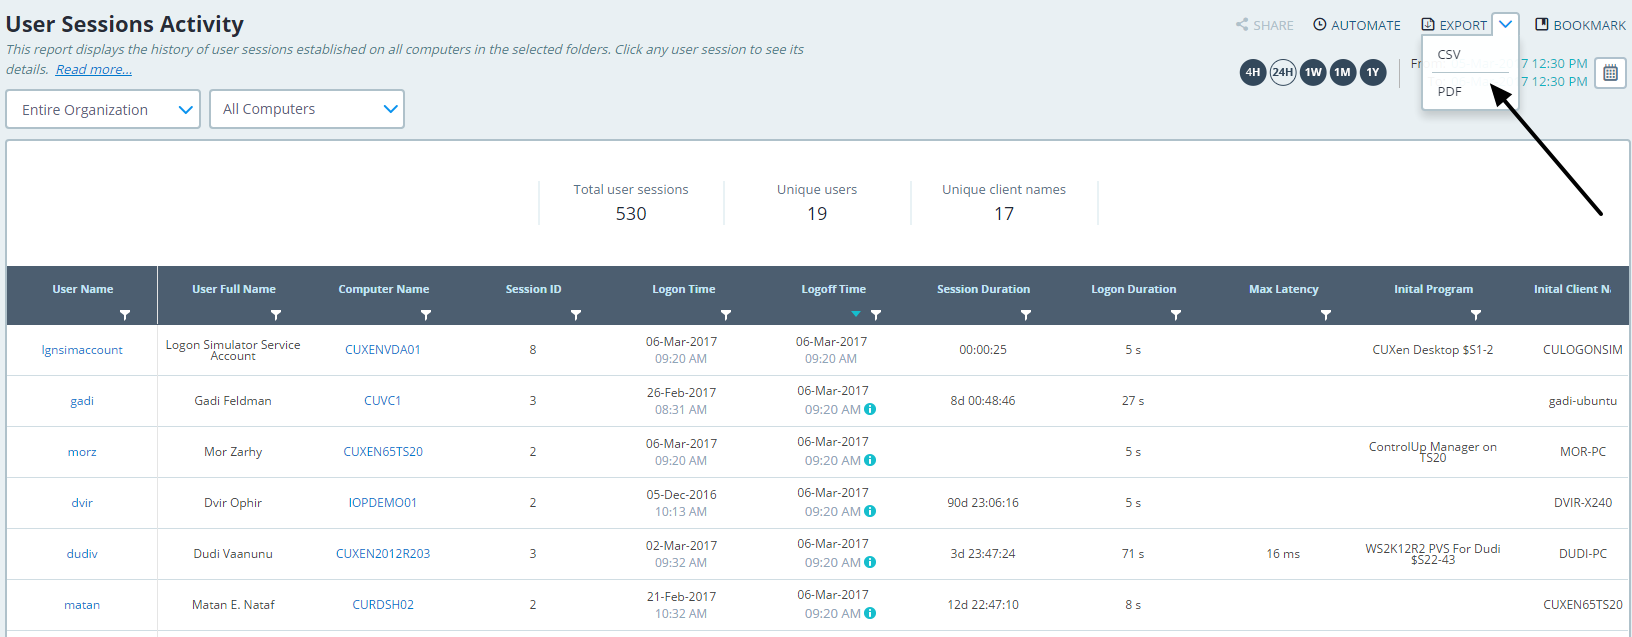
Exporting any report to a PDF file in ControlUp Insights
- Improved Drill Down Capabilities
ControlUp Insights reports drill down makes for powerful troubleshooting analytics capabilities. With the drill down you can easily maintain the context while trying to understand the root cause of an issue. ControlUp Insights originally offered multiple drill down options, allowing the detection of a problem at the host level within the Host Trends report, drilling down into the specific VM and then into the actual user session. Those options have expanded significantly and now include new reports and new drill down paths further expanding your analytic reach. As explaining all the new drill down options can be tedious on the reader, I thought it would be best to let a picture be worth a thousand words.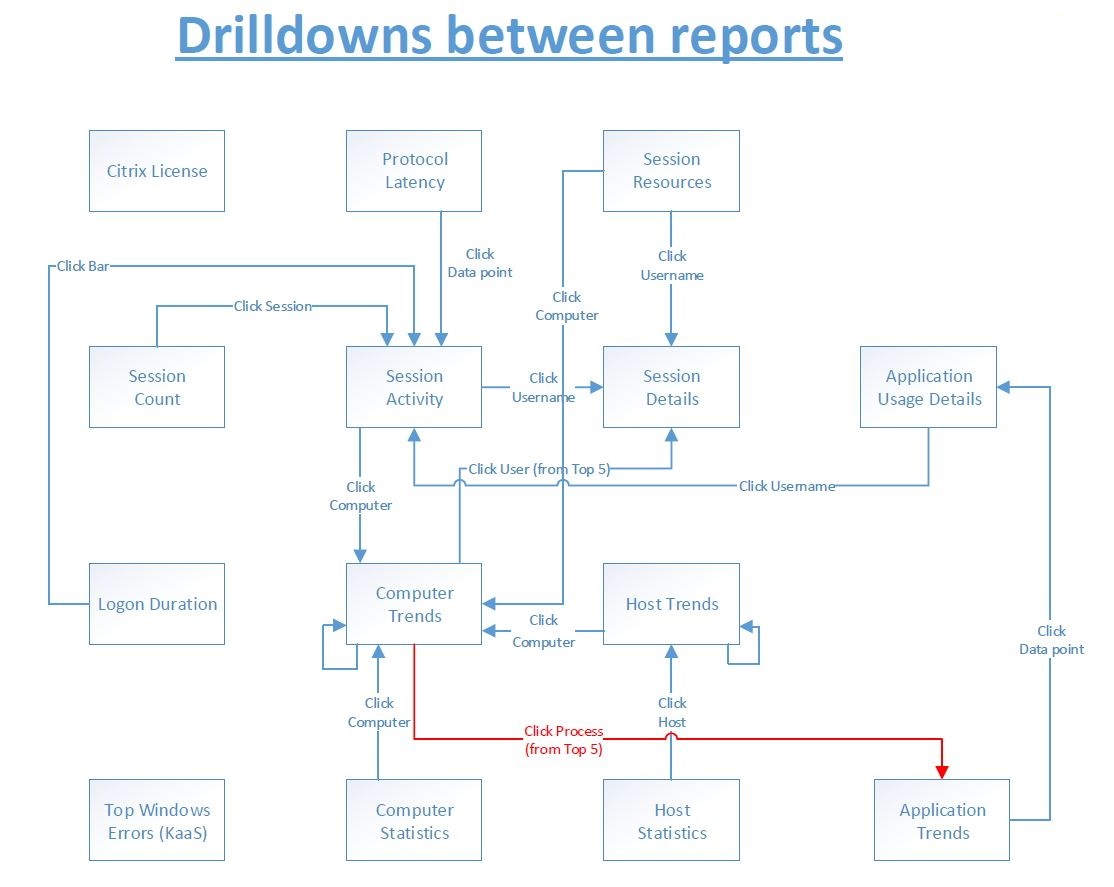
ControlUp Insights Drill Down Paths Diagram
- User OU Metric Added
Within the user session reports – Session Activity, Session Resources and Session Details you can now see a new metric for User OU. This is extremely useful as you can now filter your session reports according to a specific department in your organization, as defined in your active directory. How does the usage and resource consumption of your end users differentiate according to their department in the organization? Which department consumes more resources? Many other questions of this nature become easy to answer with the User OU metric.
Note that the User OU metric is hidden by default; to display it go to any of the column headers and click on the funnel icon; select Columns and check the box next to User OU.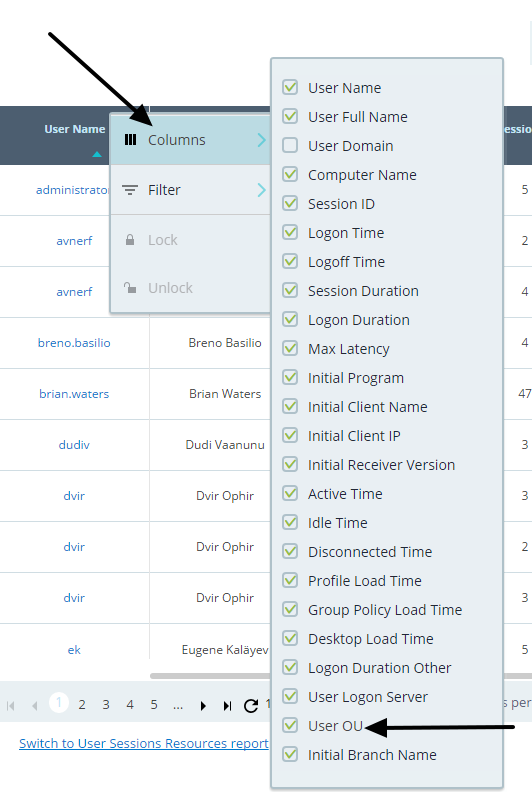
How to enable the User OU metric in ControlUp Insights
Upcoming reports
But that’s not all, folks! We have lots more exciting new reports coming your way. One of which is the Application Statistics report which will give you interesting information about the version variances within your organization, most popular application, top consuming applications and more. Another report in the works is the Application Usage Report, which will include a new interactive global benchmarking capability, with valuable drill downs and other surprises. There’s much more coming your way, so stay tuned and I’ll keep you posted!