At ControlUp, we believe that data is only as powerful as your ability to access, understand, and act on it. That’s why we’re proud to unveil our Big Screen Dashboard — a fully functional, customer-ready dashboard powered entirely by the ControlUp API and built using Grafana.
Another Innovation Guild Creation — Ready for you to Explore and Customize
Developed by the ControlUp Innovation Guild, this dashboard is not intended to replace the ControlUp console. Instead, it serves as a “visual recipe book” — showcasing the depth, quality, and versatility of the real-time telemetry available across the ControlUp ONE platform, all visualized in a single pane of glass.
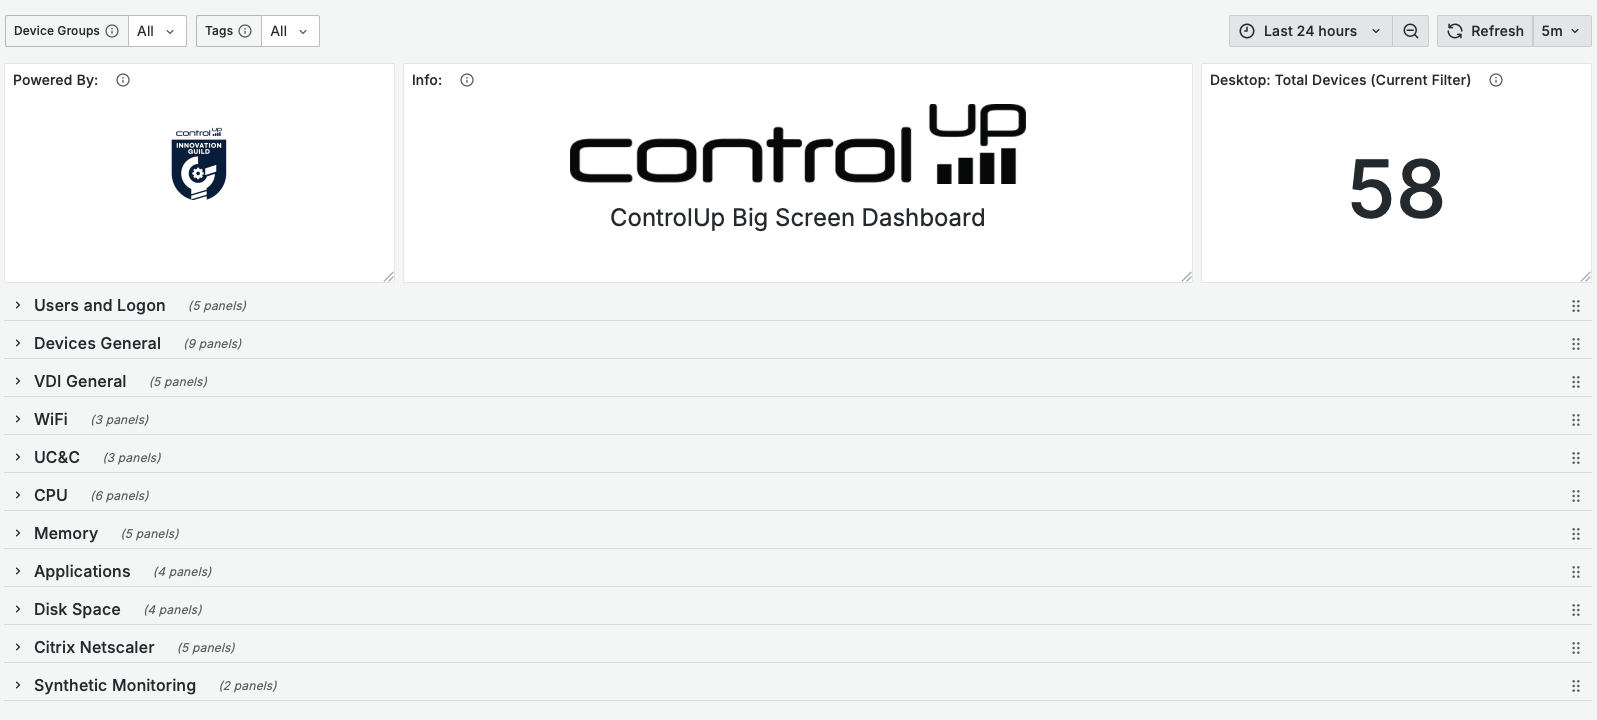
The Big Screen Dashboard was specifically designed for use by the IT helpdesk or operations centers. It is intended to be displayed on large screens (such as TVs), to provide continuous visibility into the state of your digital workspace environment. It brings together metrics and data from across the entire ControlUp platform into a single, unified view. This makes it ideal for proactive IT management!
The layout is organized in rows and includes over 40 widgets, which users can freely drag, drop, and arrange to create a customized dashboard tailored to their needs, whether for monitoring, alerting, or performance visibility.

Why Did We Create the Big Screen Dashboard?
Customers often ask us: What can I build with the ControlUp API? This dashboard is our answer.
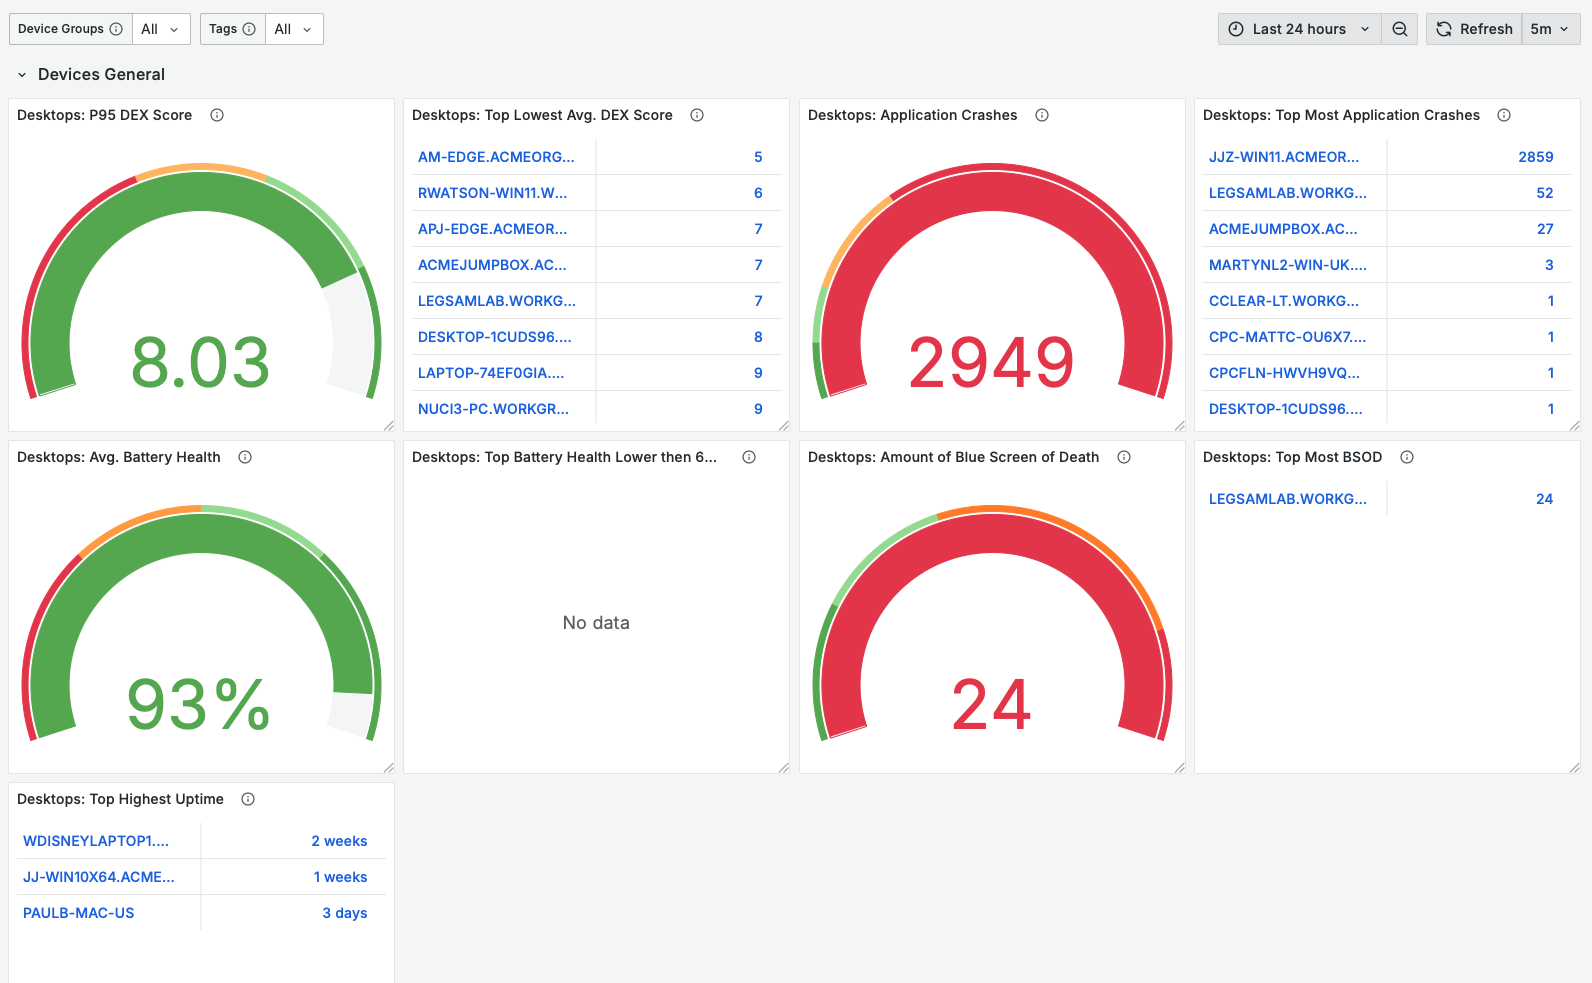
The Big Screen Dashboard brings together over 40 widgets organized by theme — from end-user experience and VDI performance to CPU load, memory usage, and even Citrix Netscaler metrics. Every widget is built on top of the same public API you can access today, proving just how rich and actionable your ControlUp data really is.
Each widget comes with:
- Clear descriptions of what you’re looking at
- Direct links to the relevant views in your ControlUp environment
- Fully editable JSON so you can reuse, remix, and embed insights in your own tools
What Can You Do with the Big Screen Dashboard? It’s a Blueprint!
Let’s be clear: this is not a new product or a new dashboard inside the ControlUp platform. Instead, think of it as a blueprint — a “reference implementation” that highlights what’s possible when you combine our powerful backend with your own reporting or visualization stack.
So what can you do with the Big Screen Dashboard? You can take any of the widgets (or “recipes”) from this dashboard and:
- Integrate them into your own Grafana or Power BI dashboards
- Use them to generate automated reports
- Share real-time insights with stakeholders outside the ControlUp console
We’re giving you not just the data, but the inspiration and building blocks to create exactly what your organization needs.
Built with Innovation in Mind
The Big Screen Dashboard is the latest release from the ControlUp Innovation Guild — our internal strike team of passionate technologists, customer advocates, and field-hardened IT pros who live and breathe scripting, solution design, and automation.
Formed to deliver rapid, high-impact innovations based on real customer needs, the ControlUp Innovation Guild moves faster than the traditional product cycle allows. Our mission is to create practical, lightweight tools that expand the value of the ControlUp platform — and the Big Screen Dashboard is a perfect example.
Whether it’s real-time storage monitoring, automated reporting frameworks, or now a fully API-powered dashboard to visualize your environment outside of the ControlUp console, the ControlUp Innovation Guild exists to bridge the gap between big ideas and real-world delivery.
The ControlUp Innovation Guild’s work is driven by real needs from the field and inspired by you. Your feedback, challenges, and creativity help shape what we build next. And while some Guild-built tools may require a bit more setup or customization, they offer an early glimpse into what’s possible, with many eventually making their way into the core ControlUp platform.
The Big Screen Dashboard is just the latest in a growing portfolio of innovations. We can’t wait to hear what you think — and to see what you build next. (Learn how our first release, Disk Monitor, improves IT efficiency.)
How to Get Started with Big Screen Dashboard
Getting started is simple and we’ve included everything you need:
- You can access the Dashboard JSON in the ControlUp Download Center
- Learn how to get started by reading the knowledge base article
Try it. Modify it. Extend it.
We can’t wait to see how you use the Big Screen Dashboard in your environment — and we’d love to hear your feedback. Which widgets are the most helpful? What’s missing? What would you love to see next?
Let’s keep building together.
Please get in touch with me at Chris.Twiest@ControlUp.com with any ideas for the Guild! You can also follow us on LinkedIn for the latest news.