We have previously published some global statistics regarding the time it takes users in virtual desktops to log on. A few very interesting conversations with industry experts followed, and one of the popular questions was: how about the additional wait that happens after the logon process is complete? In other words, what is the delay experienced by the user as a result of an application taking its time to become ready?
To address this question, ControlUp v6 introduced an experimental feature aimed at measuring application load time. We also published a free profiler tool that can help users diagnose load time in their environments. Now that this feature is live and kicking, it’s time to share and discuss some initial global findings!
The dataset presented below included some 6 million application launches in 91 organizations worldwide. The App Load Time feature in ControlUp is based on a whitelist, which by default includes Microsoft Office applications and popular browsers, so these applications comprise the bulk of the dataset. Some of our customers opted to monitor the load time of other applications, like Java and Epic (a popular electronic medical records app).
Here are the average load times, ordered from slowest to fastest:

So what is the meaning of those numbers as indicators of user experience? According to behavioral studies nicely summarized here, 5 seconds is a threshold that defines optimal continuity of user experience that fits into the user’s “flow”. Applications that take longer than 5 seconds to load are more likely to finish initializing after the user’s concentration and absorption in the task at hand are already broken. Moreover, if 10 seconds is taken as a threshold that defines the user’s attention span, in the case of the slowest apps observed here we might run the risk of losing the user’s attention altogether.
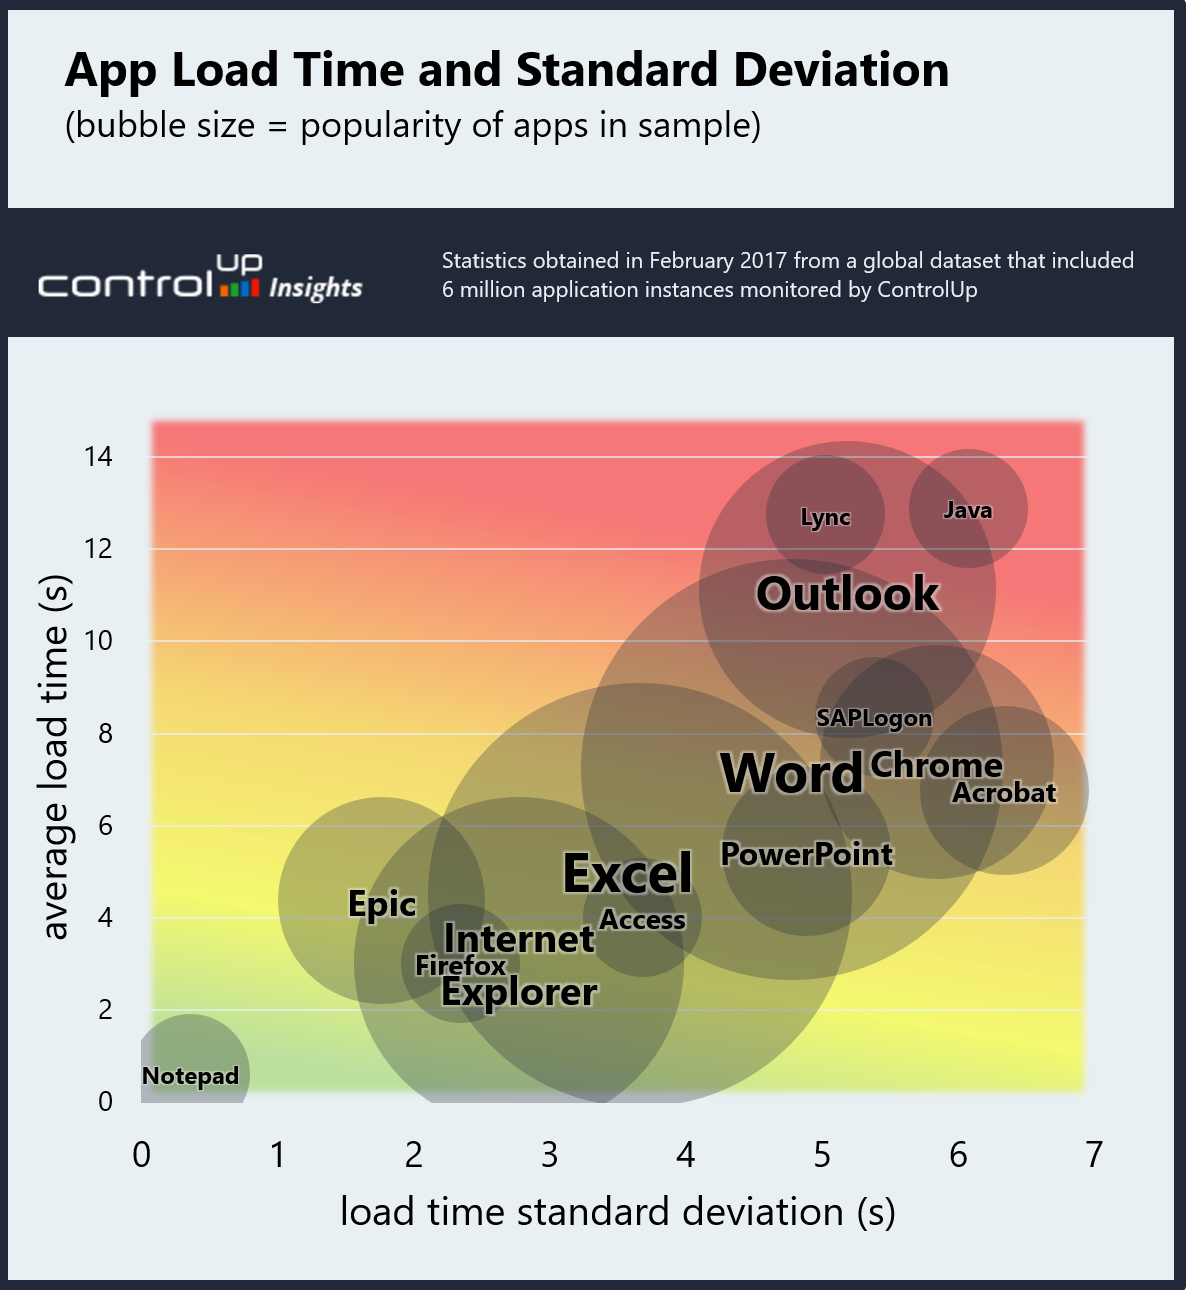
Before discussing some of the measurement caveats and possible interpretations of the results, here’s another chart that visualizes the dataset, this time with average app load time on the Y axis, load time standard deviation on the X axis, and bubble size representing the number of observed application instances in the dataset (for reference, Word and Excel were the most popular apps with 1.4 million instances).

The main reason for including the standard deviation in this chart is to emphasize the consistency of observed app load time. If an application is sometimes very fast to launch and other times presents a significant delay (will be presented on the right side of the chart), one can argue that the user experience is inconsistent and therefore worse than for an app that exhibits consistent load times. For example, Epic is not only fast to load, but also shows relatively consistent load times, because unlike Office apps, it does not load a document as part of its startup.
This brings me to several frequently asked questions and noteworthy caveats:
- What is defined as “load time”? Basically, the mechanism is aimed at measuring the amount of time it took the application to become available for the user. ControlUp starts measuring when the process is started and stops when it detects a significant decline in the process’s activity (which indicates that the app is done loading and is now waiting for user input). You are invited to read in more detail about the measurement methodology here.
- What about documents loaded by Office apps? When the user opens an Office document, the time it takes the associated Office app to load the document itself is included in the app load time measurement, so the averages above represent the entirety of the delay experienced by the user.
- What does the load time of web browsers represent? In the case of browsers, load time refers to the parent browser process, and disregards any child processes. This means that for browsers, load time only applies to the initialization of the browser engine itself, without opening any tabs / websites.
The time it takes applications to load may depend on a great variety of environmental factors, such as availability of local system resources, network bandwidth and latency, storage contention, size of document opened, and many more. As always, the most interesting statistics deal with correlations between these and other factors and their contribution to app load time. In future articles, we’ll publish such correlations and other associated findings as we discover them.
To summarize, application load time measurement, however complex, may provide insights into an important aspect of user experience which deals with systems responsiveness. When assessing user experience in a given environment, it can be useful to take into account the global benchmarks such as the averages cited here. In addition, ControlUp’s application load time feature can help establish an organizational baseline for the performance of key applications, which will help identify high-priority issues.
Are you interested in seeing how application load time in your environment compares to the community benchmark? If you haven’t already, check out ControlUp! Plus, here are some sources for further reading: Using the application profiler to research application load behavior