
A global dataset of Windows logon duration statistics reveals average durations of various stages in the logon process. These global results can be useful as guidelines for IT professionals when setting expectations, goals and budgets. This article presents statistics for every stage of the logon process and elaborates on some of the common misconfigurations that might be causing delays, wasting system resources and damaging productivity.
My previous article “What can be learned from 2 million logons?” has ignited several interesting conversations with experts, consultants and customers. It was great to hear how the global statistics we gathered resonate with the experience of end-user computing connoisseurs.
The current article will provide a deeper dive into the global dataset, which expanded greatly since January’s sample. We now have operational metadata from more than 21 million logons from 239 organizations worldwide! I will provide a more detailed account of the average duration of various stages of the logon process, and also elaborate on some specific examples of misconfigurations and issues that might introduce major delays into the logon duration process.
Here are some summary statistics:

Here’s a short guide for the global distribution charts you’ll find below. The bars represent the relative share of organizations in each duration category. Category labels on the X axis represent duration ranges (e.g. 15 in the chart below represents all organizations in which the average logon duration was higher than 10 and lower than or equal to 15 seconds). Green bars represent categories which fall below the median. The yellow bar is the one that includes the median (23.7 for the overall logon duration). The orange bars represent the 50-90 percentiles, and the red bars show the 10% highest average values observed in the current sample. If logon duration in your network falls in those categories, you have slower logons than 90% of organizations in the sample. However, don’t fall into despair! Chances are that you can solve at least some of the issues causing that slowness, as explained below.

Profile Trouble
The first logon stage to discuss involves loading of the user profile. This stage begins after the workstation or server completes authenticating the user. This phase should be completed within a couple of seconds, provided that the profile is stored in an accessible location and has a reasonable size.
Our global sample exhibits an average profile load time of 3 seconds. This probably doesn’t sound like an alarmingly high number, but remember that just like any averaged value, it conceals more information than it reveals.
Here’s what the global distribution of profile load times looks like in our current sample:
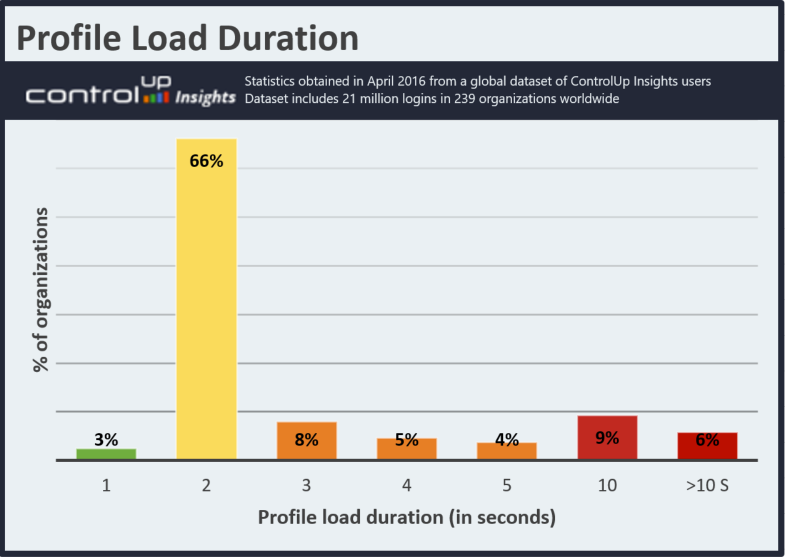
So the majority of organizations in our sample have a profile load time of less than 2 seconds. Even if you are among this elite group, you can still find anomalies if you look more closely at the individual logons in your network. The chart above shows that a full 15% of networks in our sample wait 10 seconds or more on average at this stage.
To demonstrate how problematic the reality of profile load time can be, let’s look at the distribution of profile load times in a single organization. For the intra-organizational examples provided here, I picked some networks which exhibit problematic patterns that demand investigation, so this is not a typical case but a real one nevertheless:

See those poor users in the far right edge of the chart? While a great variety of things could make them wait forever for their profiles, let’s mention a couple of common causes.
Issues resulting in slow profile load might arise when the profile is roaming (e.g. copied from a network share to the local disk during logon), especially if the profile contains large files or directories that contain large numbers of files.
One story I like to tell is of a logon lasting 40 minutes (!) observed at a customer site. An investigation of the contents of the user’s profile revealed a 4GB Outlook data file which was copied from a remote file server every logon, providing the user with ample time for his morning coffee and socializing with colleagues. And guess what was happening at the end of each workday? The file was getting copied back to the filer during logoff, only to be copied back again the next morning.
In this case, the waste of resources (network, I/O, and of course the employee’s time) is evident and grave. What makes it even worse is that all this redundant activity was happening at the worst time possible – the same morning rush hour during which all the other users are hitting the filer for their profiles.
In other cases, profile load takes a long time when the profile includes a directory with a large quantity of files, not necessarily large in size. My colleague Niron Koren has written on this in detail, and his article includes some instructions on identifying problematic location/s within the profile. Web browsers have a nasty habit of spraying the user’s profile with thousands of small files, which tend to accumulate over time and delay logon.
A Matter of Policy
Group Policy processing is the next phase in the logon process, which lasted 7.5 seconds on average across the 239 organizations in our sample. If you have heard of the statistician who drowned in a lake with an average depth of 10 inches, you are probably wondering what the distribution itself looks like. So here’s the global distribution of Group Policy processing:
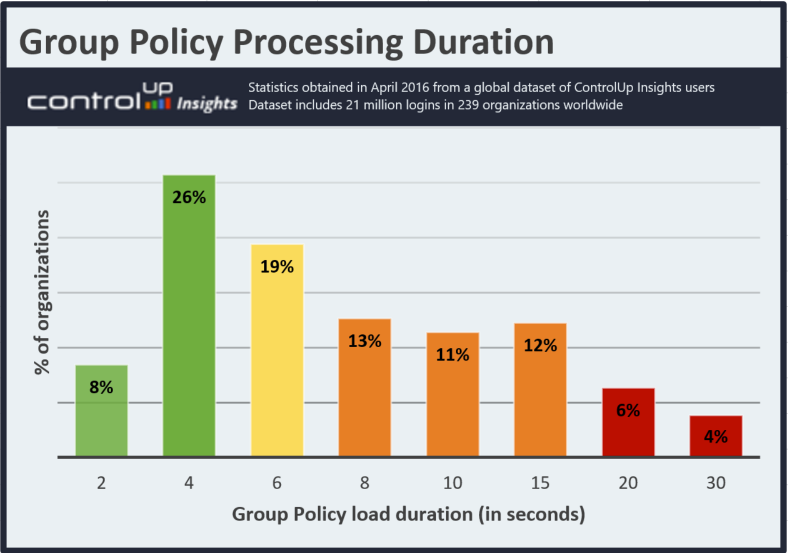
The distribution above suggests that if your organization’s Group Policy processing time is above 5.8 seconds (the median), then this sample puts you in the slower 50% and you might want to investigate further. If you take a look at your organization’s detailed statistics, the distribution of Group Policy processing times might resemble the following example:
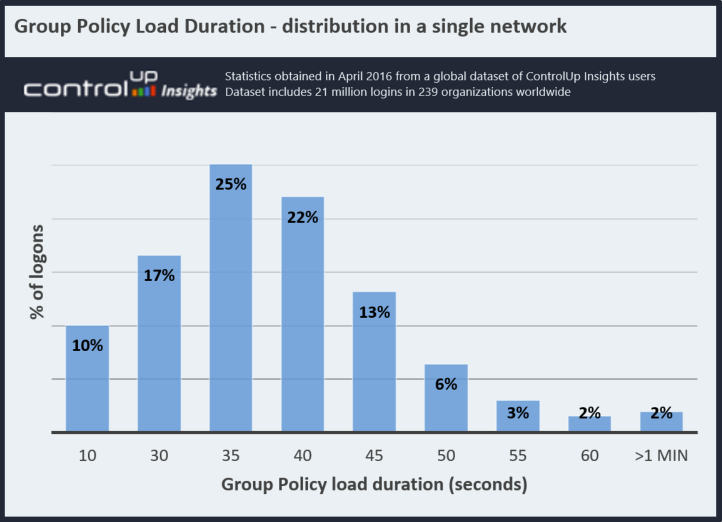
In this example, the bulk of the organization’s users are experiencing Group Policy load times which are much higher than our observed global average. If your organization exhibits a similar pattern, you might want to look more closely at the individual Group Policy settings in place. This is another challenge in which ControlUp can help, with a handy script-based action.
Group Policy is an elaborate mechanism, which can and will be misbehaving if configured incorrectly.
One example of a common Group Policy-related misconfiguration is Drive Mapping entries which point to non-existent or inaccessible file shares. If the shared location no longer exists, it might take the client a while to time out on the mapping request which stands no chance of succeeding anyway. If the problematic drive’s target path is temporarily unavailable or inaccessible to a specific group of users, you might want to remove it from the GPO, just to eliminate the unnecessary delay. Look at this Technet blog for some more geeky details.
Shell we proceed?
Chronologically, the final phase of the logon process is the time it takes your computer to load the shell (most typically explorer.exe). On average, this phase took 4 seconds for all organizations in the current dataset. Again, a closer look will show the gap and shed some light on the extreme values:

Your mileage may vary, but if your organization’s average is above 4 seconds, you probably need to drill down to see why.
Here’s an example of an intra-organizational shell load duration distribution that presents a cause for concern:

As you can see in the chart above, this network exhibits shell load times which are slow in general. The rightmost bar represents 8% of logons for which just the shell loading took more than a minute! What could go wrong there? Well, one notable issue in this context is a notorious portion of user environment initialization called “Active Setup”, which may be familiar to you in the form of a window similar to this one:

Some user environments are configured in a way that requires certain software components to undergo per-user initialization during logon. In most cases, this delay may be avoided, for example by setting up a template profile in which all the needed personalizations were performed in advance by the admin.
The Others’ side of the Island
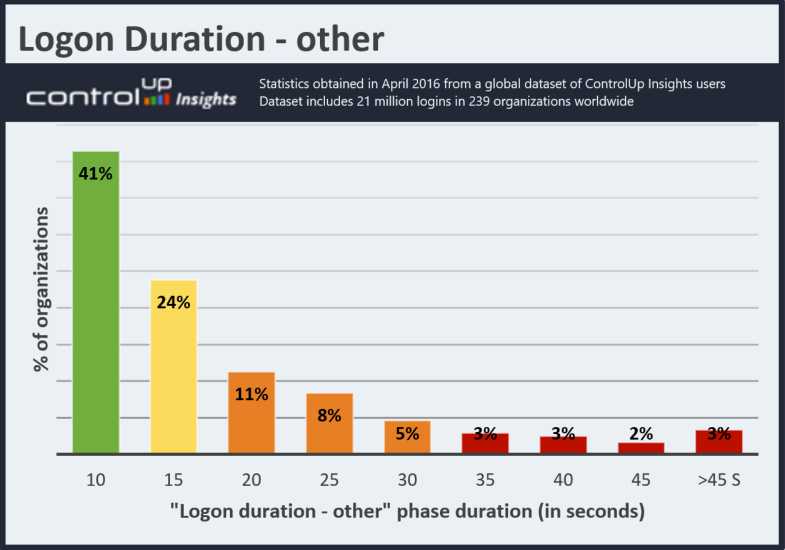
With ControlUp, the logon process includes a phase with the somewhat cryptic name of “Logon Duration – Other”. This phase is meant to include the many sources for logon delay which are not attributed to profile, Group Policy, or shell load. This phase is actually the one responsible for the longest average delay in logon time, and the one with the greatest cross-organizational variance. Here’s the global distribution:
And here’s what this phase’s duration looks like in a network with some relatively high values:
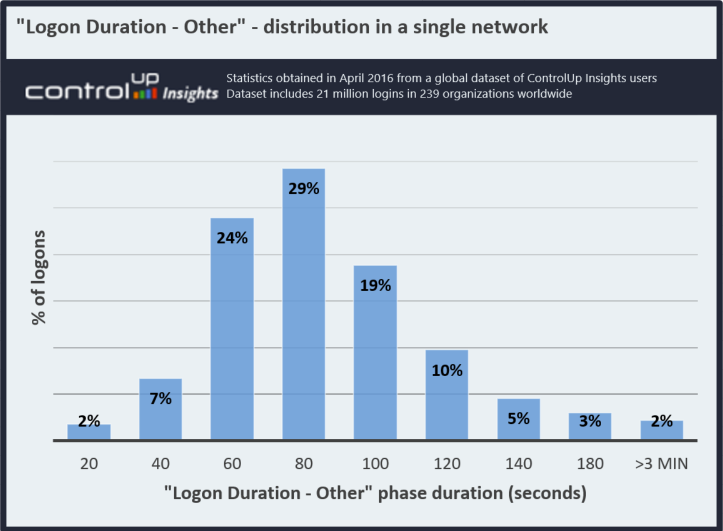
This is a radical example, showing a network in which most users wait between 1 and 2 minutes for components included in the “Logon Duration – other” phase. Again, real as it can be!
There is a variety of different causes for delay in this phase, and many of them are actually pretty interesting to look at in detail, so I decided for brevity’s sake not to dive into them in this article. Sorry for the cliffhanger, but I’ll have to elaborate on those in an upcoming chapter of this logon duration saga.
But Why?
From the end user’s perspective, the value in optimizing inefficient logons is clear – it allows for better focus on the task at hand. However, besides the obvious improvement of user experience, there is an additional non-trivial value for IT professionals in investigating abnormally long logons. This value stems from the fact that abnormally slow logons may be symptoms of misconfigurations or inefficiencies which cause unnecessary waste of resources on your network.
As seen above, the logon process can be seen as a Pandora box. It may not contain all the evils of the world, but it’s definitely a host to a great variety of symptoms that are worth investigating. And remember – any logon delay you manage to eliminate is net gain for your users’ productivity and your customers’ satisfaction!
P.S. I have received quite a few requests to elaborate on different subjects touched upon in this and the previous article in this series. For now, the plan is to continue with demystifying the “Logon Duration – Other” metric. Next in line is the ways in which logon duration is affected by logon storms. Want to read more about these or other related topics? Please leave a comment below.