
In a previous article, I discussed how a system administrator (SA) could collect basic disk information using Edge DX. The SA was initially only interested in whether a desktop’s storage device was an SSD or HDD. In the article, I showed how a simple PowerShell script could be run manually or automatically on one or more systems.
After reading the article, Rodger Colvin, a long-time ControlUp Sales Engineer and 2024 Elevate award winner, reached out to me with some additional suggestions on what additional information he would like to see collected.
In this article, I will expand on the original article to demonstrate how Edge DX can use advanced features in Windows to detect when a disk is showing signs of failure and then move from the reactive model shown in that blog, where you need to either run a script on a machine or examine the information stored in a database, to a proactive model where you will be alerted either by email or by having a ticket opened in ServiceNow.
Advanced Features in Windows Used to Detect Disk Failure
Microsoft has developed ways to use PowerShell to get information about the physical disks on a system. The command I used in the previous blog was Get-PhysicalDisk, which receives a list of all physical disk objects on a system and attributes about the disks, including the HealthStatus. The device’s health status can be Healthy, Warning, Unhealthy, or Unknown.
The Microsoft cmdlet Get-StorageReliabilityCounter provides even more information about the drive. This includes information about such things as the device temperature, errors, and wear; it can even obtain the length of time the device has been in use!
Some information that will be retrieved from the discs includes disk wear, current and max temperature, the write and read error information, the date when the device was manufactured, and how long the device has been powered on.
As a heads up, the information returned by these commands depends on what the disk can return, so in many cases, the returned objects will be null.
Script
Below is the PowerShell script that I cobbled together to gather information from the disk.
## [Console]::OutputEncoding = [System.Text.Encoding]::UTF8 # This line is added automatically to help with Unicode characters. Please add your code below
[array]$arrSysInfo = @()
$arrSysInfo  =   Get-PhysicalDisk |
ForEach-Object {
    ($RecordData = $PSItem) |
    Get-StorageReliabilityCounter |
    Select-Object -Property @{
                                Name       = 'DeviceId'
                                Expression = {$RecordData.DeviceId}
                            },
                            @{
                                Name       = 'FriendlyName'
                                Expression = {$RecordData.FriendlyName}
                            },
                            @{
                                Name       = 'Model'
                                Expression = {$RecordData.Model}
                            },
                            @{
                                Name       = 'Manufacture'
                                Expression = {$RecordData.Manufacture}
                            },
                            @{
                                Name       = 'SerialNumber'
                                Expression = {$RecordData.SerialNumber}
                            },
                            @{
                                Name       = 'MediaType'
                                Expression = {$RecordData.MediaType}
                            },
                            @{
                                Name       = 'HealthStatus'
                                Expression = {$RecordData.HealthStatus}
                            },
                            Wear, Temperature, TemperatureMax, WriteErrorsCorrected, WriteErrorsTotal, WriteErrorsUncorrected, WriteLatencyMax, ManufactureDate, PowerOnHours, ReadErrorsCorrected, ReadErrorsTotal, ReadErrorsUncorrected
}
Write-Output("### SIP DATA BEGINS ###")
Write-Output $arrSysInfo | ConvertTo-JSON
Write-Output("### SIP DATA ENDS ###")
Write-Output("### SIP EVENT BEGINS ###")
Write-Output $arrSysInfo |Format-List
Write-Output("### SIP EVENT ENDS ###")
The astute observer will notice that I use the SIP DATA stanza to write the data to a data index and the SIP EVENT stanza to write the device output.
Running the Script
The script can be run on demand by specifying the Custom Action trigger or on an automated basis by selecting the appropriate basis.
In the screen capture below, the script runs once per day and writes the output to a data index named Win_Disk_Health.
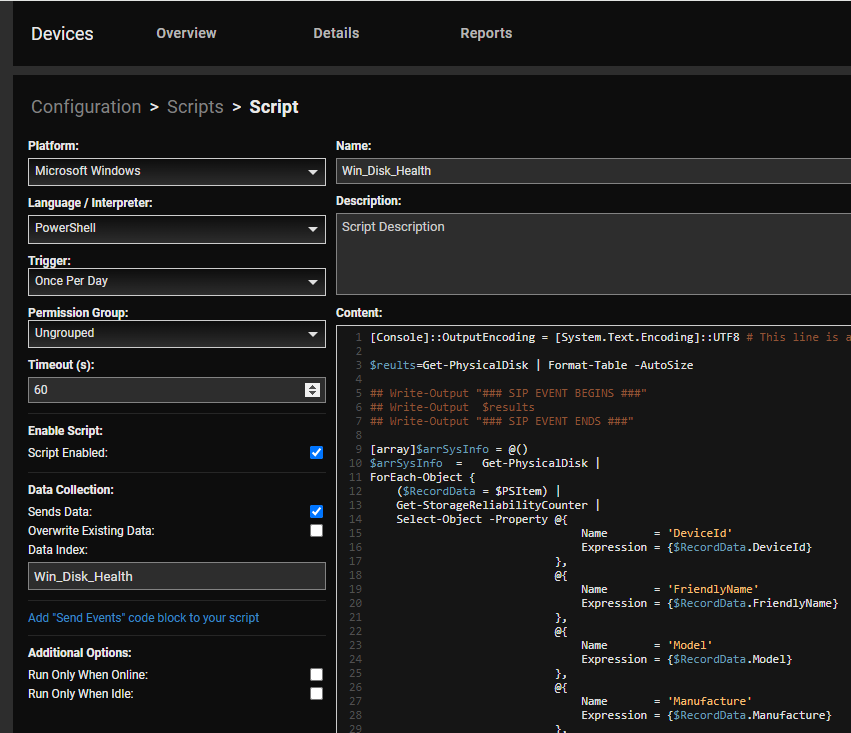
Figure 1 – Running a Script Daily
Output on the Device
The script outputs the data to the Device Events, as shown below.
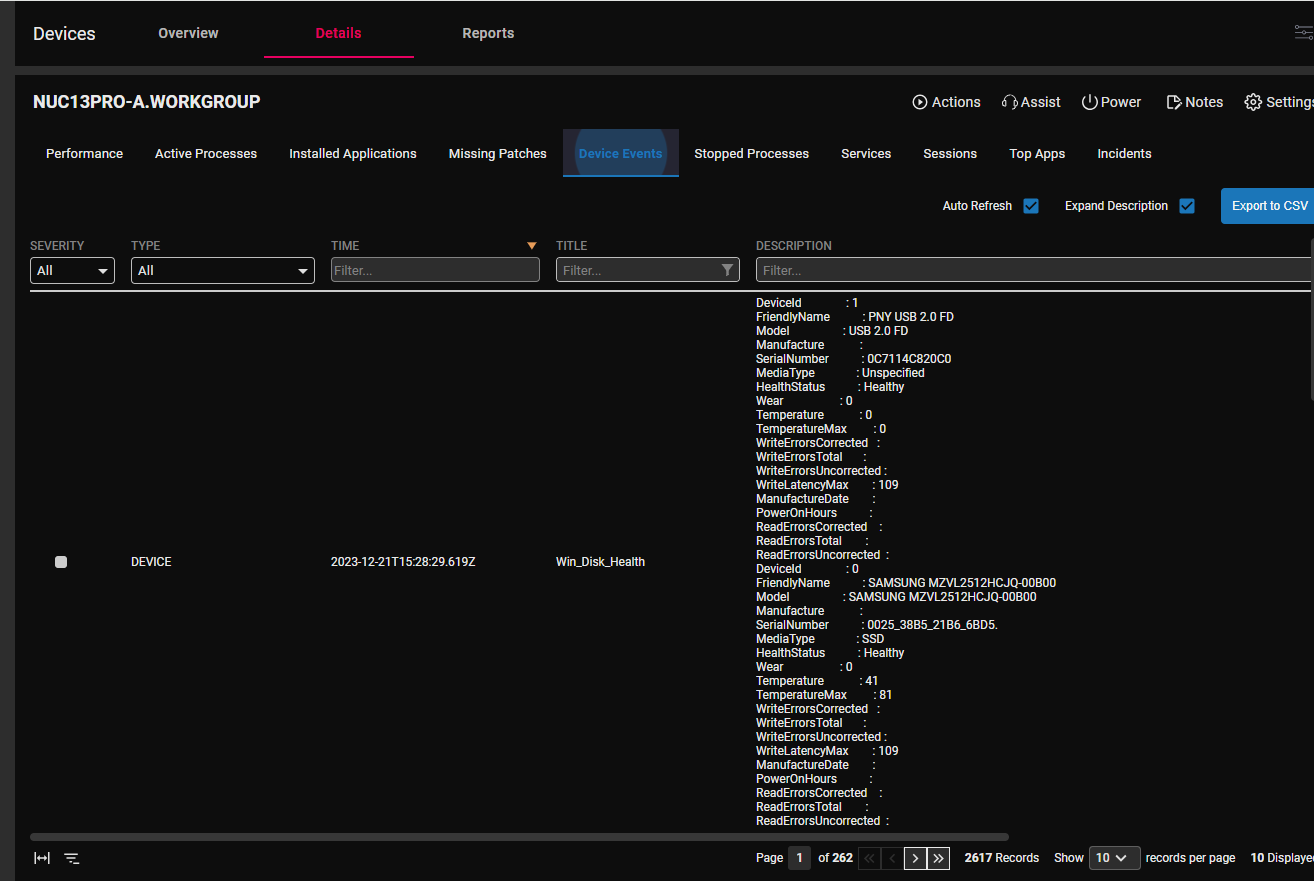
Figure 2 – Device Events
Output the Data Index
The output is also written in a data index. This and other indexes can be accessed from the Configuration page and selecting Data.
From the left column, select the fields that you want to display.
To get an idea of what information is being collected, I set the script to run daily, then looked at and examined the data. The data was collected from the sixteen Windows PCs in my environment. By sorting the various fields, I noticed that the Crucial CT500MX500SSD4 reported the most information, including the hours that the device had been powered on and read errors corrected.
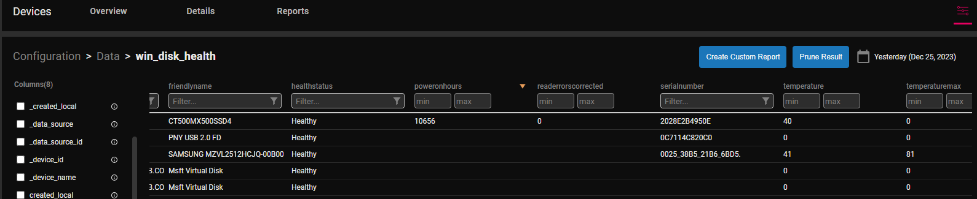
Figure 3 – Drive Data
I noticed that the maximum temperature was collected by the WD, SK Hynix, Intel, Samsung, and Kingston drives.
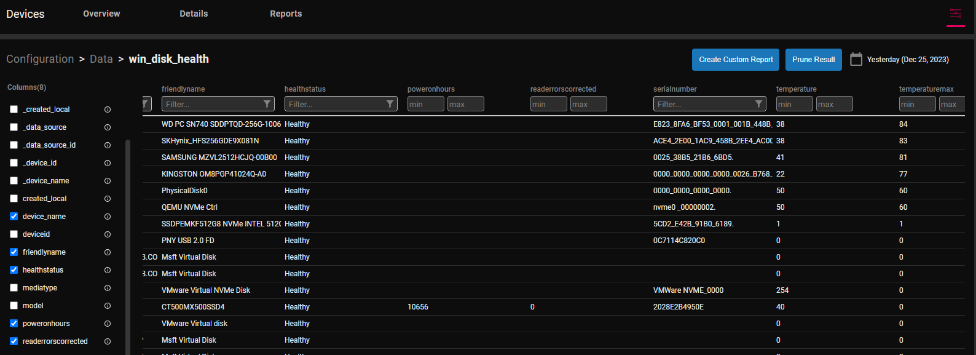
Figure 4 – Max Temperature
Reporting the Data
If you look at the same data repeatedly, you can create a report from the data by clicking Create Custom Report.
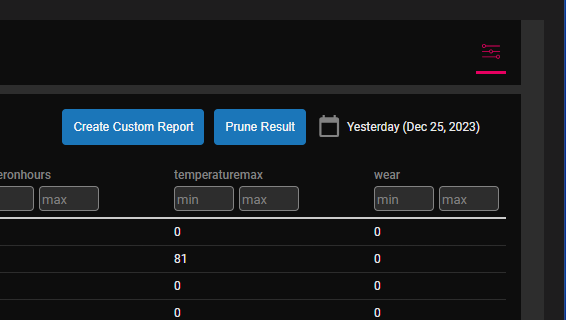
Figure 5 – Create Custom Report
The report can be accessed in the Custom Reports section of the Reports dashboard.
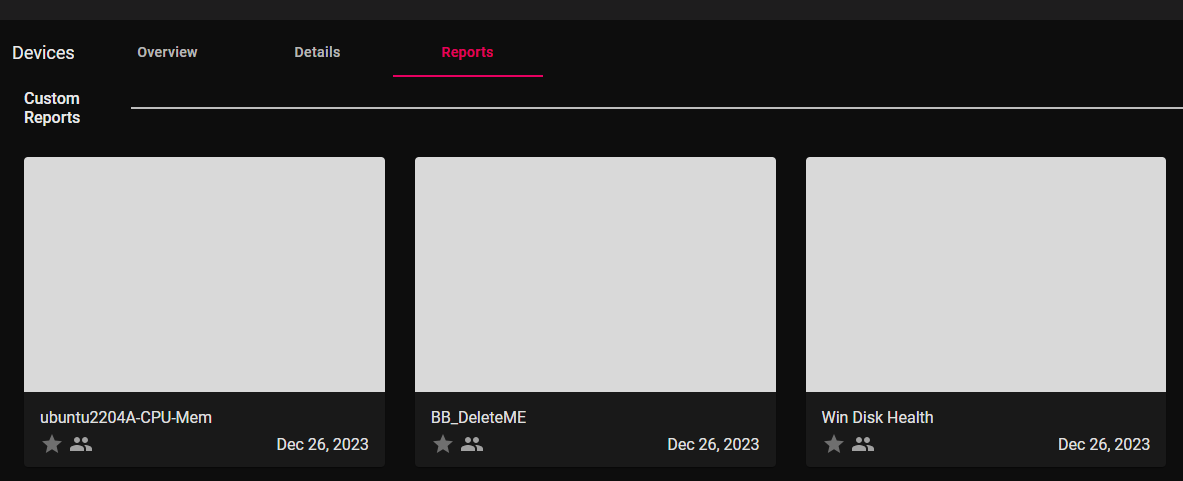
Figure 6 – Viewing a Custom Report
I use the reports for budgeting purposes to see what SSDs are starting to age out and if any devices are no longer healthy. It could also be used for historical trending; if you notice a particular device getting hotter over time, it may indicate that it is being used more frequently or having airflow issues.
Being Alerted to a Condition
Examining reports regularly is an excellent way to notice issues with your disk drives, but a better way to do this is with alerts.
Alerts can be easily created by clicking the Create Alert (bell) icon on a device’s home page widget. As the disk health metric does not have a widget, create an alert with information in a data index from the Alerts page in the Configuration dashboard and click Add Alert.
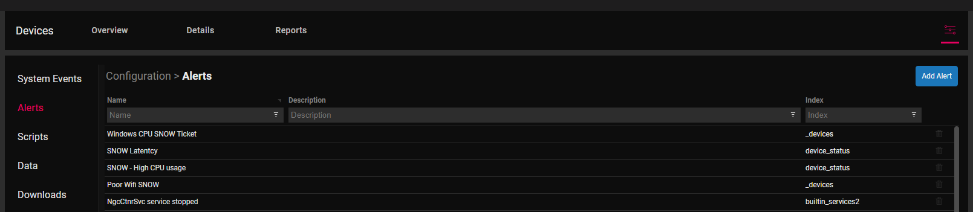
Figure 7 – Crete an Alert
One of the things that I wanted to be alerted on was when a disk was reported as anything other than Healthy. I set the Platform to Microsoft Windows, The Data Index to Win_disk_health, and the Data index filed health not equal (!=) Healthy.
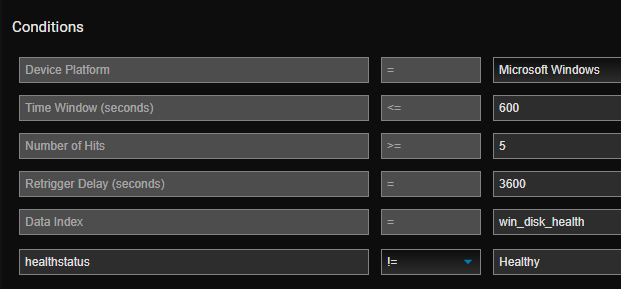
Figure 8 – Not healthy Disk
I wanted an email and ServiceNow ticket opened when the above condition was met. I entered my email address, clicked the ServiceNow field box, and entered the information needed to create the ticket.
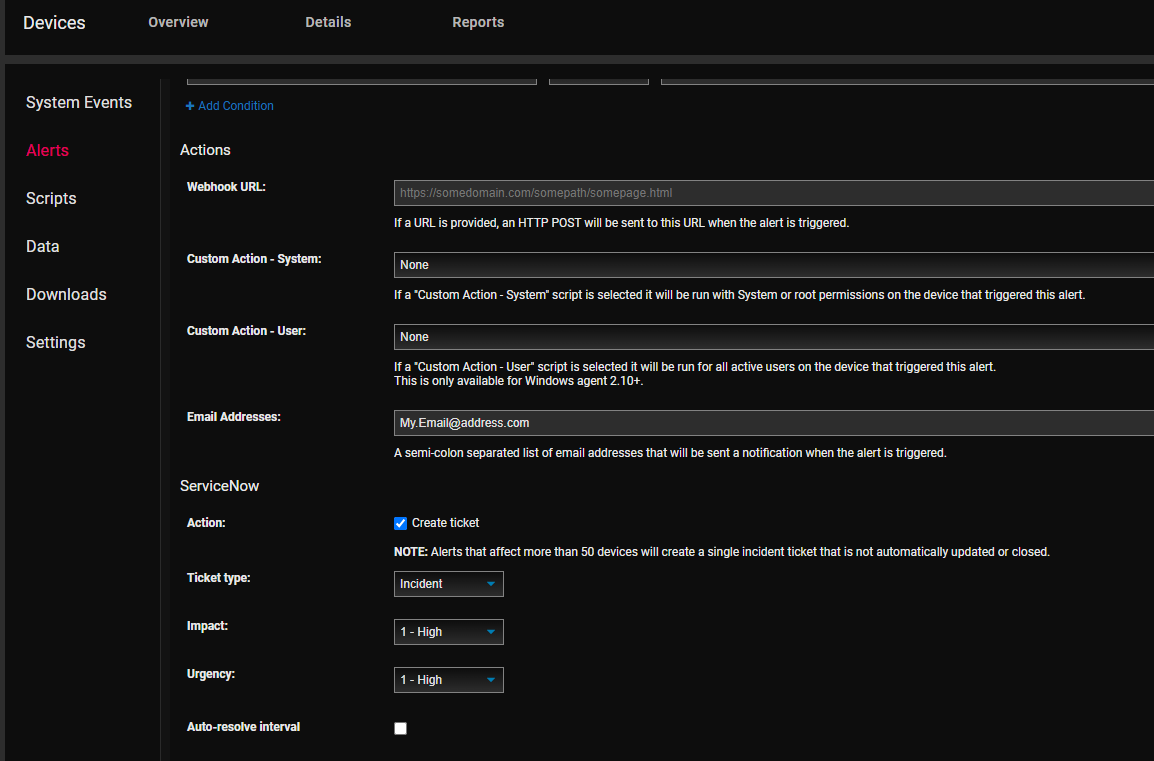
Figure 9 – Opening a ServiceNow Ticket
I created another alert to indicate when the maximum temperature is above 96.
In a previous blog post, I explained various ways to gather basic disk information, such as data and metrics, from disk drives on Windows devices in your environment. In this article, I worked with one of our Sales Engineers, Rodger Colvin, to expand on that PowerShell script to gather additional information from the disk. We then went over how to view and create reports from this information, which is an excellent way to be able to investigate problems, but creating alerts to be automatically notified of the issues is better, so we then showed how you could be emailed and have a ServiceNow ticket opened automatically when a problem is detected.
By following the techniques provided in this blog, companies can resolve issues faster, minimize the number of support tickets, and enhance the overall desktop experience for their users.
If you currently use ControlUp for Desktops, you can cut and paste the script in this blog into your environment. If you are not yet on Edge DX, you can visit this web page for more information, to start a free trial, or to book a demo of it or any other of ControlUp’s award-winning products—many Thanks to Rodger for helping me with this blog.