With 2016 being touted as the “year of application layering” by many vendors and analysts alike, it’s only natural to be having conversations around the many competing products on a weekly basis.
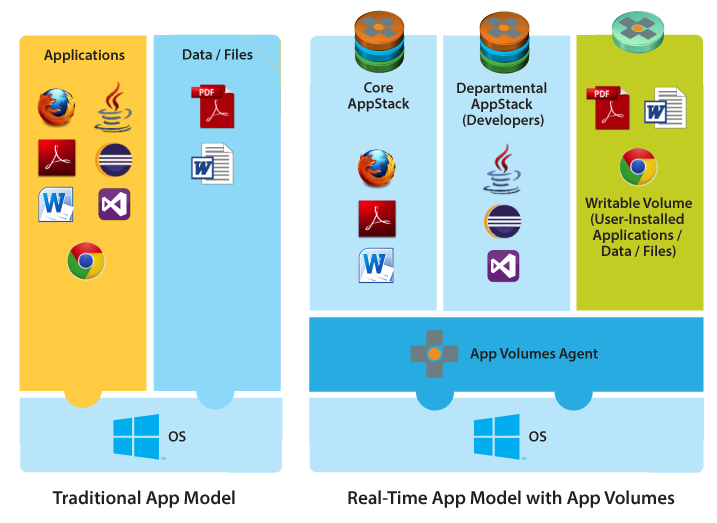
If you’re unfamiliar with these technologies, Application layering from vendors such as Citrix, VMware and Unidesk give you the ability to easily install applications or a (group of applications) into a disk based container and deploy them ‘en masse’ to VDI and Server Based Computing desktops.

(image courtesy of VMware Appvolumes documentation).
In essence, Application layering is a new approach on the age old problem of Enterprise Application Deployment and delivers another powerful tool to the administrator to reduce the burden of Golden Image Management.This year, I decided to really sit down and drill into this market and I’ve been delivering a presentation off the back of this investigation at numerous conferences.
One question that regularly comes up while speaking with people is:
“what’s the performance impact of these solutions?”
To be frank, I didn’t have a good answer to this question. Citrix once said there is “zero” performance impact, VMware also claim “modest” performance differences, but I was dubious. This was certainly worth testing, but there was a caveat.
Ask any developer in our community how to track an applications start-up time (without a stopwatch and lightening reactions) and you’ll get a different answer! Did I want to write yet another utility to track what is a very tricky business? Not really.
One of the many perks of working closely with ControlUp, was the ability to use their latest utility, the “SmartX Application Profiler” to measure application start-up times to compare a number of different vendors.

The SmartX Application profiler (above) from ControlUp gave me the ability to track applications start-up times based on a reliable formula, combining Disk IO, Visible Windows and Loaded DLL’s in the software to determine the mean time the application loaded in and was available to the user. There’s far more to it than that, I could speak of DLL injection, Kalman Filters and such, but let’s just keep it simple for now. ☺
To the lab! (lab Setup):
So with a suitable tool in hand for application load time measurements, I set about the task of measure the first launch time of a suite of applications on a Windows 7 X64 VM on the following solutions:
- Citrix AppDisk (XenDesktop 7.8).
- VMware AppVolumes (2.10).
- Unidesk (2.9.4 for vSphere).
- Locally installed applications.
Each of these delivery groups were deployed using XenDesktop Machine Creation Services (with the Exception of UniDesk). The Golden image is identical with the exception of the specific product technology and the specification of the VM’s was identical.
In addition, the Virtual Machines were isolated to the same Host and NFS share to ensure an identical experience. The Application layers themselves, were also hosted on this same storage volume.
Test Applications:
The applications tested were as follows:
- Google Chrome. (latest at time of publish).
- Control-Up Console. (Latest at time of publish).
- Microsoft Word 2013.
- Microsoft Excel 2013.
These applications were chosen for the following reasons. Google Chrome is a multi-process application with a short application launch time, the ControlUp Console is a .Net Framework application with a longer start-up routine loading many DLL’s and the Microsoft office is a widely used product suite across most.
The testing methodology:
In this window of testing, we measured the first launch time of Excel or Word, Chrome and Control-Up then shut down and restart the Virtual machine to avoid any in RAM caching skewing the testing.
Excel and word were done in isolated tests as they share a similar DLL base which will have been cached from the previous launch.
These tests were performed 3 times per platform, twice, and the resulting averages of the tests were then used to report the following data.
Testing Output:
Firstly, to say any vendor can layer applications without an impact is just not true, even at the millisecond level, disk IO traversing a filter will always have an impact. In our following testing, the application layering vendors performed as follows:

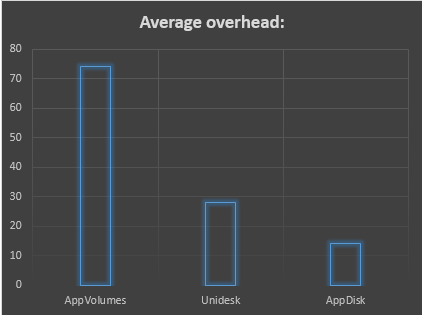
As you can see above, VMware AppVolumes added the largest amount of overhead across all applications while Citrix AppDisk and Unidesk had an overhead in all but one application test.
To put this into perspective, here’s a breakdown of the Overhead (Delay) in percentage over the base first launch time from a VM with the applications run locally:

The key thing to bear in mind with these findings are, this is purely based on Application First launch. Once an application is launched and RAM is available, these launch times will dramatically reduce with the dependent DLL’s and Applications served from RAM. Windows has been doing this for years now with good results.
While in most environments there are a number of caching elements going on to alleviate these delays, when ‘like for like’ is compared at a first launch perspective in identical testing conditions there’s clearly a difference!
What I really found surprising with all this, was Citrix AppDisk being a 1.0 product out performing its competitors significantly speaks volumes to the quality of their first launch, Kudos Citrix.
To the future:
While this utility from ControlUp was a great tool for the job, wouldn’t it be great if a monitoring product allowed you to do all this from a simple view with real data? Even better, what if this data was readily available with cloud based analytics to provide comparisons across enterprise IT environments?
Exciting eh? I think so too, so let’s just see what happens in the next major release of ControlUp! ?
Credits:
A big Thank you to Niron Koren and Matan Nataf in ControlUp for their assistance and support during this testing.