Introduced in 2017, ControlUp for VDI collects various NVIDIA vGPU metrics to provide IT administrators with a more complete picture of the digital employee experience for users using GPU-accelerated virtual desktops.
When looking at the anonymized data of ControlUp’s cloud customers, we observe a 20–25 percent year-over-year growth in the count of virtual desktops accelerated by a graphics processing unit (GPU). These customers are primarily located in North America and Northern Europe, but we also see GPU growth in other geographies. According to our data, the market segments that benefit most from GPUs are finance, healthcare, energy, manufacturing, construction, education, and government.
The basic reason for the growing popularity of GPU-accelerated virtual desktops is its positive impact on Digital Employee Experience (DEX). High screen frame rates, low user input delays and maximum application compatibility in virtual desktop environments are important DEX factors.
This article will give you the background information you need when using ControlUp in combination with NVIDIA virtual GPUs in your data center. Read below to learn about:
- The benefit of GPUs in a business workplace
- Static NVIDIA vGPU metrics collected by ControlUp
- Dynamic NVIDIA vGPU metrics collected by ControlUp
- How the ControlUp agent hooks into the NVIDIA GRID driver
The benefits of GPUs in the workplace
Graphics-intensive Windows workplaces don’t just include CAD / CAM applications, such as AutoCAD, Solidworks or Catia. The design of today’s Windows operating systems and modern Windows applications leverage the use of GPUs. Typical examples are Web browsers, unified communications applications (Teams, Zoom, etc.), the Microsoft Office suite, and Adobe desktop programs. All of these Windows applications—and even the desktop window manager—benefit from GPU resources. If a GPU is not present at boot time, the Windows operating system activates a built-in GPU emulation layer, using CPU resources to simulate the existence of a GPU and “fooling” the applications at the price of impeded performance. Therefore, old PC hardware with a slow CPU always benefits from a GPU card when updating to Windows 10.
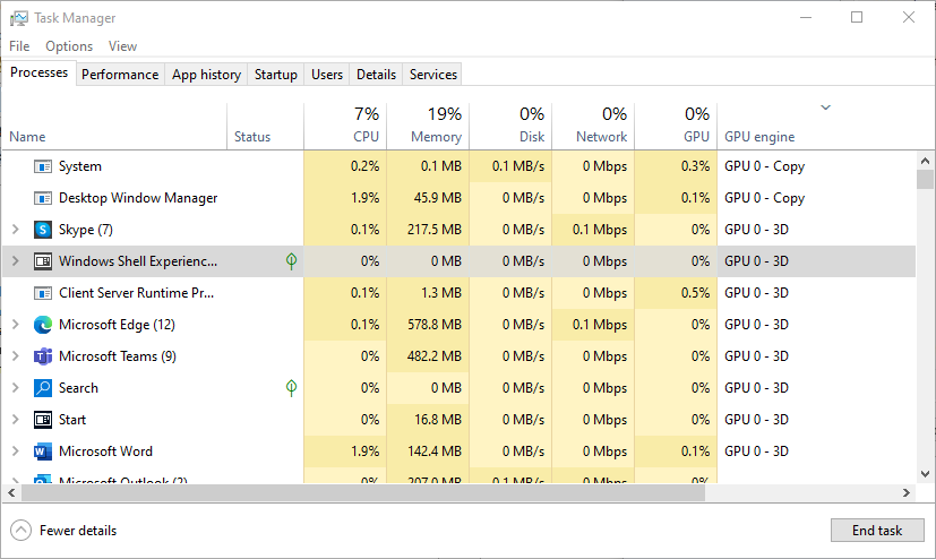
If you want to find out which applications benefit from a GPU, simply open Task Manager on a Windows 10 or Windows 11 machine with a physical GPU. In the Processes view are two columns that show the usage of GPU resources in real time. Open your preferred applications and start using them while you keep an eye on Task Manager; you’ll likely be surprised how many applications consume GPU resources in some way.
NVIDIA introduced their virtual data center GPU technology (often referred to as “GRID”) in 2008. They have constantly improved this technology, changed its name to vGPU and, today, the current release family is NVIDIA vGPU Software 14. The virtualization of an NVIDIA GPU allows it to be shared across multiple virtual machines, bringing the VMs to the same performance level (or above) as GPU-accelerated Windows PCs.
In addition to the GPU virtualization layer installed on the host machine, the NVIDIA vGPU software also includes a GRID-enabled graphics driver for the virtual machines. Allowing the virtual CPUs to offload some of their work to virtual GPUs results in improved user experience and better scalability, specifically in multi-user setups. For details, check out the NVIDIA vGPU introduction and the NVIDIA vGPU software documentation.
The relevance of GRID-accelerated virtual desktops is reflected by the ControlUp agent ability to collect NVIDIA GPU metrics. These can be displayed in the ControlUp for VDI and Solve consoles, or they can be used for triggers in ControlUp Automate.
Static NVIDIA vGPU metrics collected by ControlUp
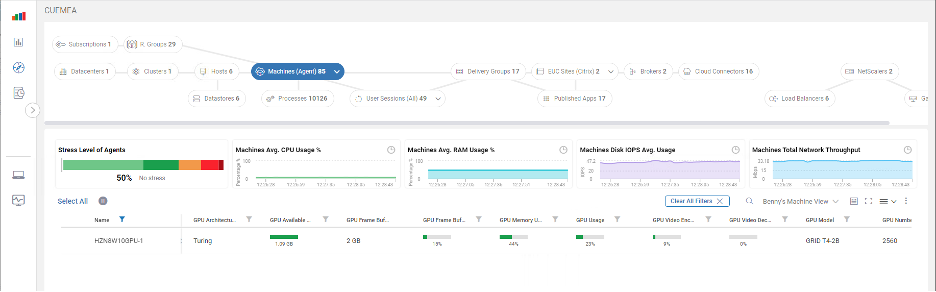
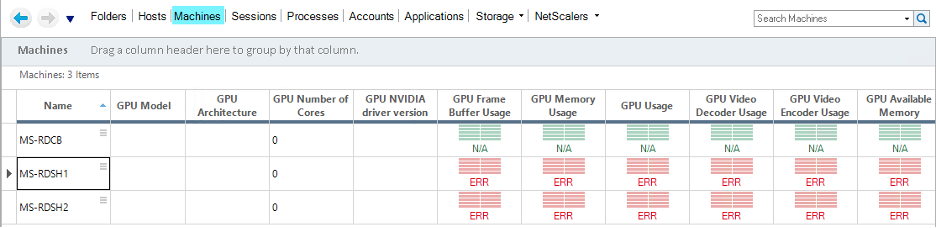
Below are NVIDIA vGPU metrics available in the machine’s detailed view of the Real-Time DX console and in Solve. This list shows the metrics that are static alphanumeric strings or numerical values. “Static” means that these metrics will not change while the GPU-accelerated virtual machine is running.
- GPU Architecture: A static string that holds the code name of the NVIDIA GPU architecture, for example “Maxwell,” “Pascal,” “Volta,” “Turing,” or “Ampere”.
- GPU Number of Cores: The static number of available shading units (“CUDA cores”). This number is pre-defined by the graphics processor on the physical graphics card. For example, the GV100 graphics processor on a Tesla V100 card features 5,120 shader units while an older Tesla M60 card (with its two GM204 graphics processors) features 2 x 2,048 shader units.
- GPU Model: A static string that holds either the official product name of the graphics card or the NVIDIA vGPU profile type, (e.g., “GRID V100-2Q”). The example represents a virtualized V100 card with two gigabytes of dedicated GPU memory.
- GPU Frame Buffer Size: A static numerical value that represents the total size of the dedicated video memory in gigabytes assigned to the virtual GPU. This value is pre-defined by the vGPU profile type. In case of a “GRID V100-2Q” profile, the VM uses 1/8 (= 2 GB) of the 16 GB physical GPU memory on a V100 graphics card.
- GPU NVIDIA Driver Version: This alphanumeric string holds the version of the installed NVIDIA vGPU display driver.
- GPU NVIDIA License Server: A static alphanumeric string that holds the name of the NVIDIA vGPU software license server that is used to serve a pool of floating licenses to NVIDIA vGPU software licensed products.
- GPU NVIDIA License Port: A static numerical value that holds the network port through which licensed vGPU functionalities are activated during guest OS boot by contacting the NVIDIA vGPU software license server. In most cases this is TCP port 7070.
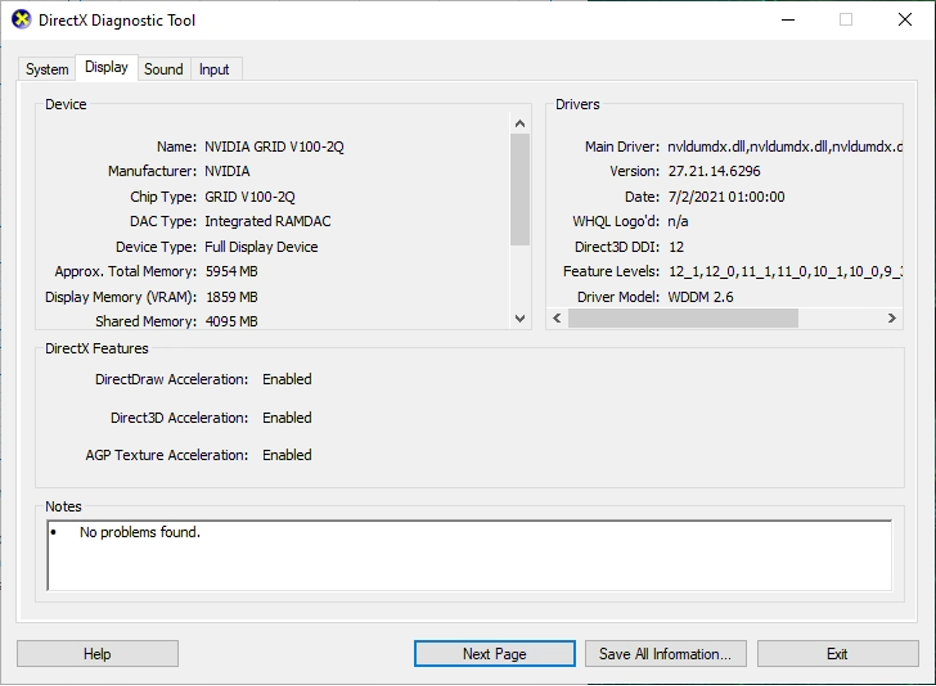
In case you want to see additional static hardware details of your NVIDIA GRID card, run the DirectX Diagnostic Tool DxDiag.exe.
Dynamic NVIDIA vGPU metrics collected by ControlUp
These are the dynamic NVIDIA vGPU metrics available in the machine’s detailed view, refreshed every three seconds.
- GPU Frame Buffer Usage: Used size of the physical graphics card frame buffer memory in percent.
- GPU Usage: The NVIDIA GPU usage of the 3D engine (= shader units) assigned to the virtual machine in percent.
- GPU Memory Usage: Percent of time over the past sample period during which the NVIDIA GPU memory assigned to the virtual machine was read or written.
- GPU Available Memory
- GPU Video Decoder Usage: Percent of time over the past sample period during which the GPU’s video decoder was used. Video playback software and display stream decoding of some remoting protocols contributes to this metric.
- GPU Video Encoder Usage: Percent of time over the past sample period during which the GPU’s video encoder was used. Video editing software and display stream encoding of some remoting protocols contributes to this metric.
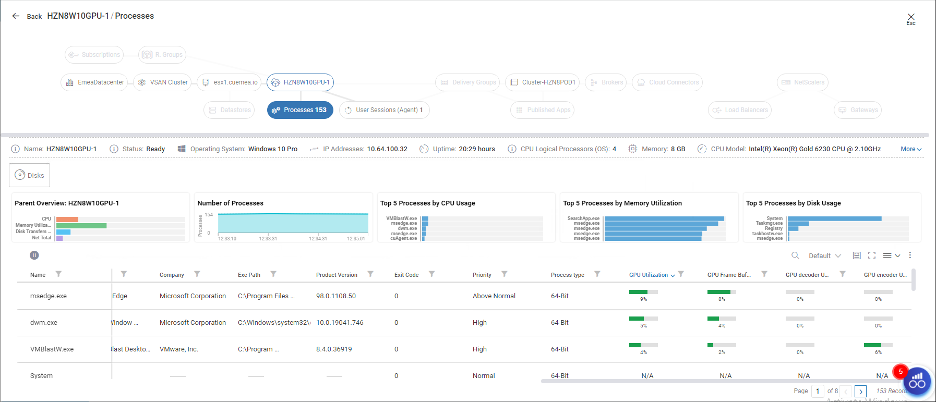
The sessions and processes detailed views show dynamic NVIDIA vGPU metrics in a granular way, also refreshed every three seconds.
- GPU Usage: The NVIDIA GPU usage of the 3D engine.
- GPU Decoder Usage: Percent of time over the past sample period during which the GPU’s video decoder was used.
- GPU Encoder Usage: Percent of time over the past sample period during which the GPU’s video encoder was used.
- GPU Frame Buffer Memory Usage: Used size of the frame buffer memory in percent.
IMPORTANT: Due to the nature of virtualized GPUs, some of the NVIDIA GPU metrics shown in the ControlUp consoles are specific to the NVIDIA GRID technology and are not visible in Windows system tools, such as Task Manager.
How the ControlUp agent hooks into the NVIDIA GRID driver
The ControlUp agent uses the NVIDIA System Management Interface (NVSMI) and its NVIDIA Management Library (NVML) API to retrieve the NVIDIA GRID metrics on session and process level. The NVIDIA WMI provider is available as part of the display driver package, and it is used to read out NVIDIA GRID metrics on machine level.
NVSMI and NVWMI provide monitoring information for Tesla and select Quadro devices. The functionality of NVSMI is exposed through the NVML C-based library. Supported products in a ControlUp context are all NVIDIA GRID / vGPU products, starting with the Maxwell architecture. Physical NVIDIA graphics cards or GPUs exposed through pass-through setups in the hypervisor may or may not show metrics in the ControlUp consoles as expected. This is also the case when the NVIDIA GRID card is at the end of support or when outdated graphics drivers are used.
Summary
NVIDIA vGPUs and ControlUp are the perfect companions. While NVIDIA GPUs improve the digital employee experience significantly, ControlUp gives you deep insights into the NVIDIA vGPU metrics in real time.