
ControlUp prides itself with quick, snappy and unparalleled troubleshooting of performance issues with an intuitive interface, lightning-fast drill down and easy root cause analysis and remediation. If you’ve ever tried it, you know what we’re talking about. But now, with the introduction of ControlUp 7.1, we’ve got a new trick up our sleeve.
The Best Is Getting Better
How can it be? We’re introducing a new friend into the mix, one who’ll help you with your troubleshooting and make it faster, better and smarter: ControlUp’s IT Virtual Expert™. With a set of best practices and using analysis of existing data, the IT Virtual Expert™ will amplify and accelerate your troubleshooting process, taking you to the right place faster, skipping redundant steps in the way, and delivering you to the most relevant view in the ControlUp console, with a preset view matching your drill down path and the relevant column sorted ascending or descending. Everything will be set up just right – and only the relevant metrics will be displayed.

How exactly does this work?
In essence, Contextual Navigation lays down a Yellow Brick Road to the root cause. Let’s say you spot an over-stressed “Datastore R/W IOPS” in a hypervisor seen in ControlUp’s Host view, instead of drilling into that host view and needing to poke around for probable causes (which is what every other monitoring tool provides), Contextual Navigation selects the problematic computer, brings you to the appropriate view, and with the appropriate sorting.. In this case, if you doubleclick on the red R/W IOPS cell, Contextual Navigation takes you to the Computers/VMs grid view, pre-selects the “Detailed View – I/O”, and shows you all the relevant metrics needed to solve the problem at hand. This is illustrated in the screenshot below.

Scenario 1: Disk and I/O Issue – Goes right to the relevant view
Let’s take another look at the power of Contextual Navigation, this time in troubleshooting excessive RAM usage. In this scenario you simply doubleclick on the cell with the stressed RAM (in red) and Contextual Navigation takes you directly to the appropriate VM, puts you in Process view, focuses on RAM-related metrics, and presents the grid in RAM-sorted order. See screenshot below.
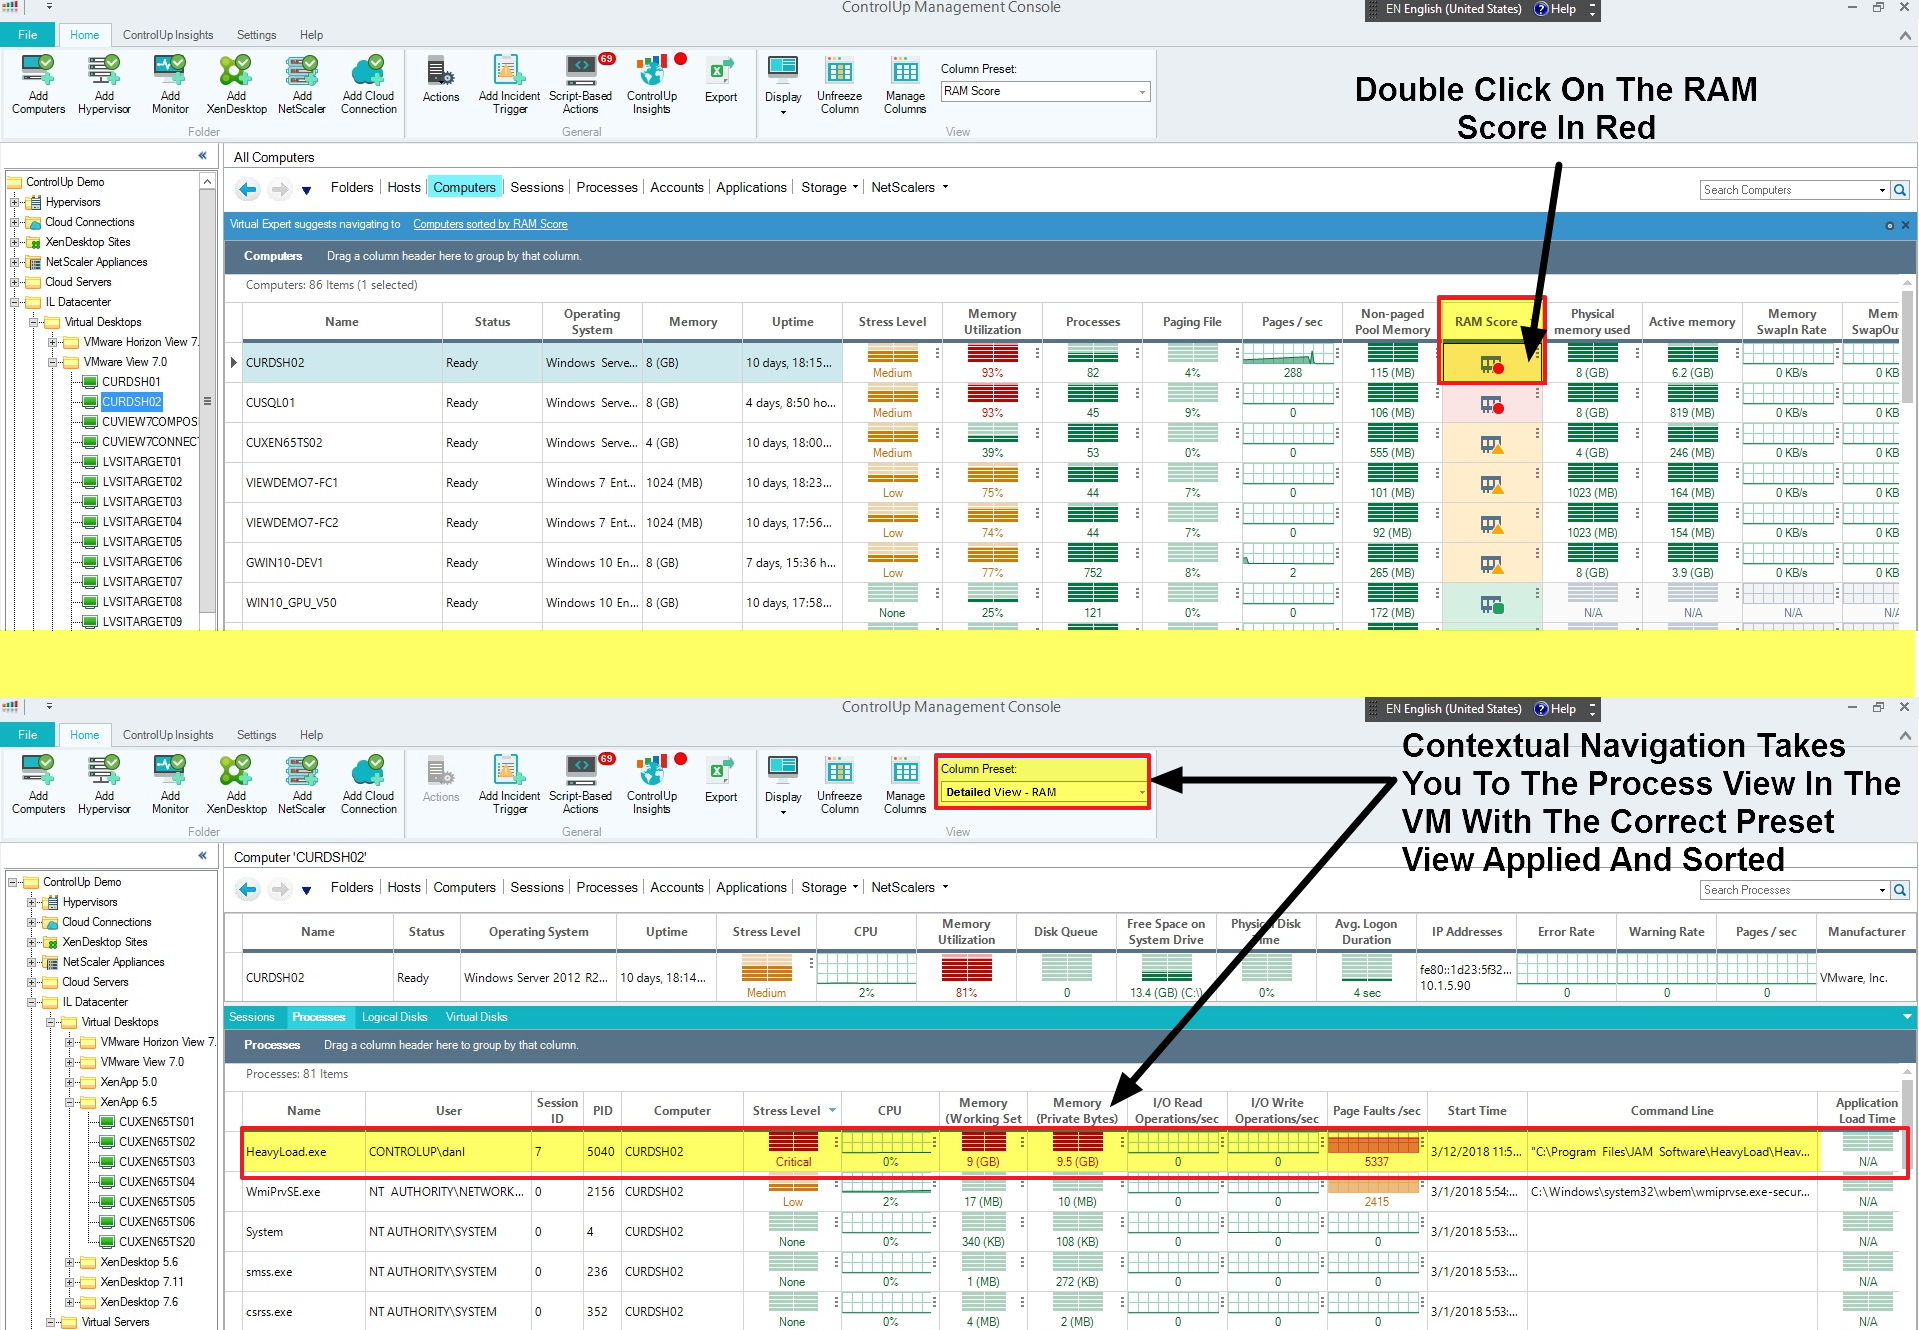
Scenario 2: RAM issue – Goes right to the relevant view
Why should you care?
When troubleshooting or investigating any issue, you’ll find that our trusty IT Virtual Expert™ will make things happen faster, better (displaying the relevant metrics and sorting them in a way that makes most sense for your particular case) and smarter – without needing to lift a finger. Getting to the root cause has become easier than ever, utilizing the knowledge that ControlUp packs with every click.
Can I tweak it?
Sure you can. ControlUp comes with set of prepackaged Contextual navigation best-practices that are created by our experts. Like anything else in ControlUp, you’ll have access in the settings area – within the settings toolbar, click on Contextual Navigation and select the rules and best practices that will be applied when troubleshooting or drilling down into an object. It’s your choice how to use the tools and knowledge that we put at your disposal.
How do I try this out myself? Download your free trial here.