
ControlUp now exposes PCoIP information for our growing Horizon View customer base. These new metrics are part of ControlUp’s session grid.
Admins who monitor multiple flavors of VDI sessions such as Citrix, VMware and RDS, can now see them all in one grid.
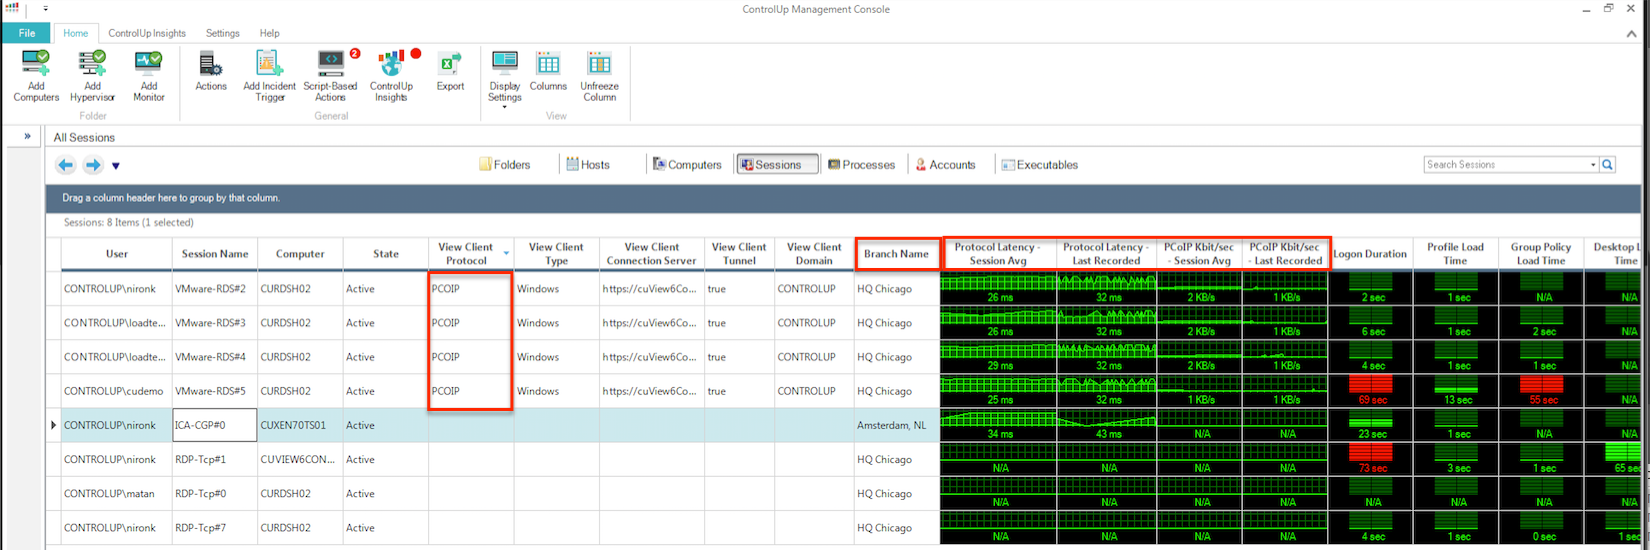
ControlUp collects and presents latency and bandwidth metrics for PcoIP sessions:
- Average protocol latency metrics displays an average of the last 20 session latency samples. note that this column presents ICA metrics as if they were ICA/HDX sessions and PCoIP as if it is a View session.
- Latest recorded protocol latency metrics displays the last session latency samples.
- PCoIP average bandwidth (average of last 20 sessions, Kbit/sec).
- ControlUp also displays the last recorded PCoIP session’s bandwidth, measured in Kbit/sec.
We added another interesting column in ControlUp 5.0 called Branch Name. This enables you to quickly find if session latency and/or bandwidth issues are related to a specific location, or company branch.
When a deeper level of information and analysis is required, use a great Script-Based Action (SBA) .
This PowerShell script uses WMI to get bandwidth usage statistics on Horizon View PCoIP sessions. It retrieves current information from WMI about overall network usage and packet loss, as well as latency with a breakdown into imaging, audio and USB-based traffic types, in order to provide more insight into the causes of high network usage in those sessions.
Here’s what this SBA’s output looks like:
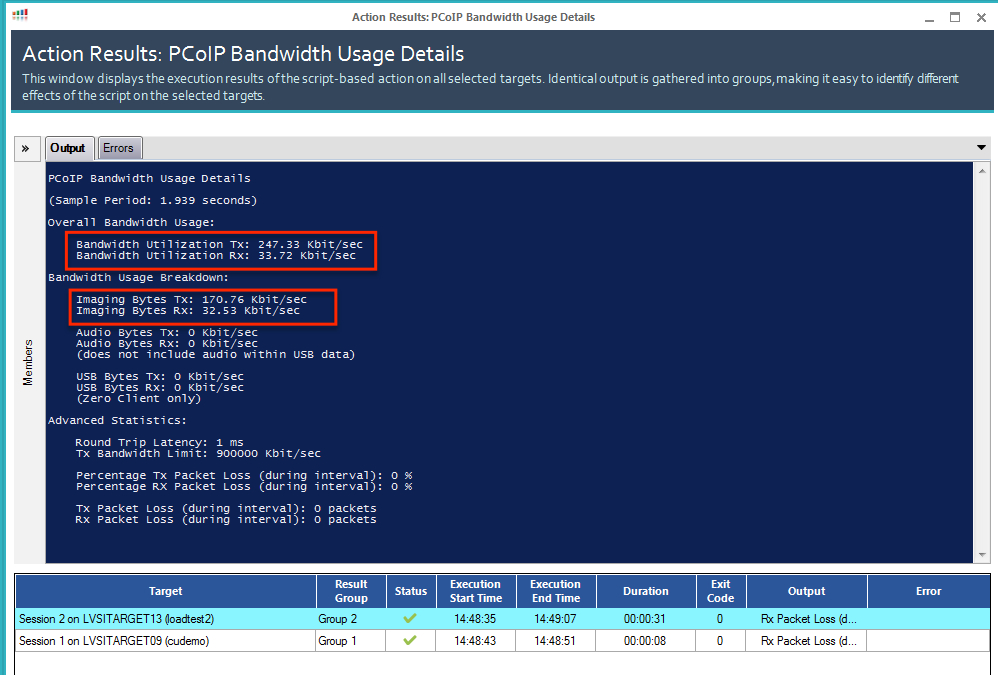
In this example, the session’s bandwidth usage is mostly for imaging. This indicates that someone is probably streaming some type media. It’s good to see those insights coming to you, isn’t it?
For more information about ControlUp’s solution for VMware Horizon.