ControlUp’s intuitive Teams and Zoom dashboards give IT teams quick insights into the number of unified comms calls, their duration, user experience scores, quality and feedback, call types, plus attendee participation with customizable timeframes and filtering capabilities. ControlUp provides digital experience scores for Microsoft Teams, which include factors like audio, video, and screen sharing quality. Additional data, such as end-user meeting sentiment provides a complete picture of the call quality.
With the rise in remote work and digital collaboration over the past three years, perhaps the technology that has become most useful and relevant in peer-to-peer communication for the distributed workforce is unified communications and collaboration (UC&C). Unified communications encompasses collaboration tools, such as voice and video conferencing, as well as messaging and document sharing apps. There are dozens of these solutions currently available, including Microsoft Teams and Zoom, the two most-used solutions on the market. We have become so heavily reliant upon these tools to accomplish our daily tasks that when there is an issue with them, it can, at best, affect an individual worker’s productivity; at worst, it can cause a massive disruption to an entire organization.
Given companies’ dependence on unified communications, many UC&C applications have built-in functionality to help IT teams detect issues, but this tends to be overly complicated and generally doesn’t provide an easy way to look at real-time or historical data. Because these solutions only look at unified comms applications and not the devices that people are using, they don’t give a complete picture of the quality of UC&C calls or the cause of any failures and don’t offer much help to support desk staff trying to find and fix problems.
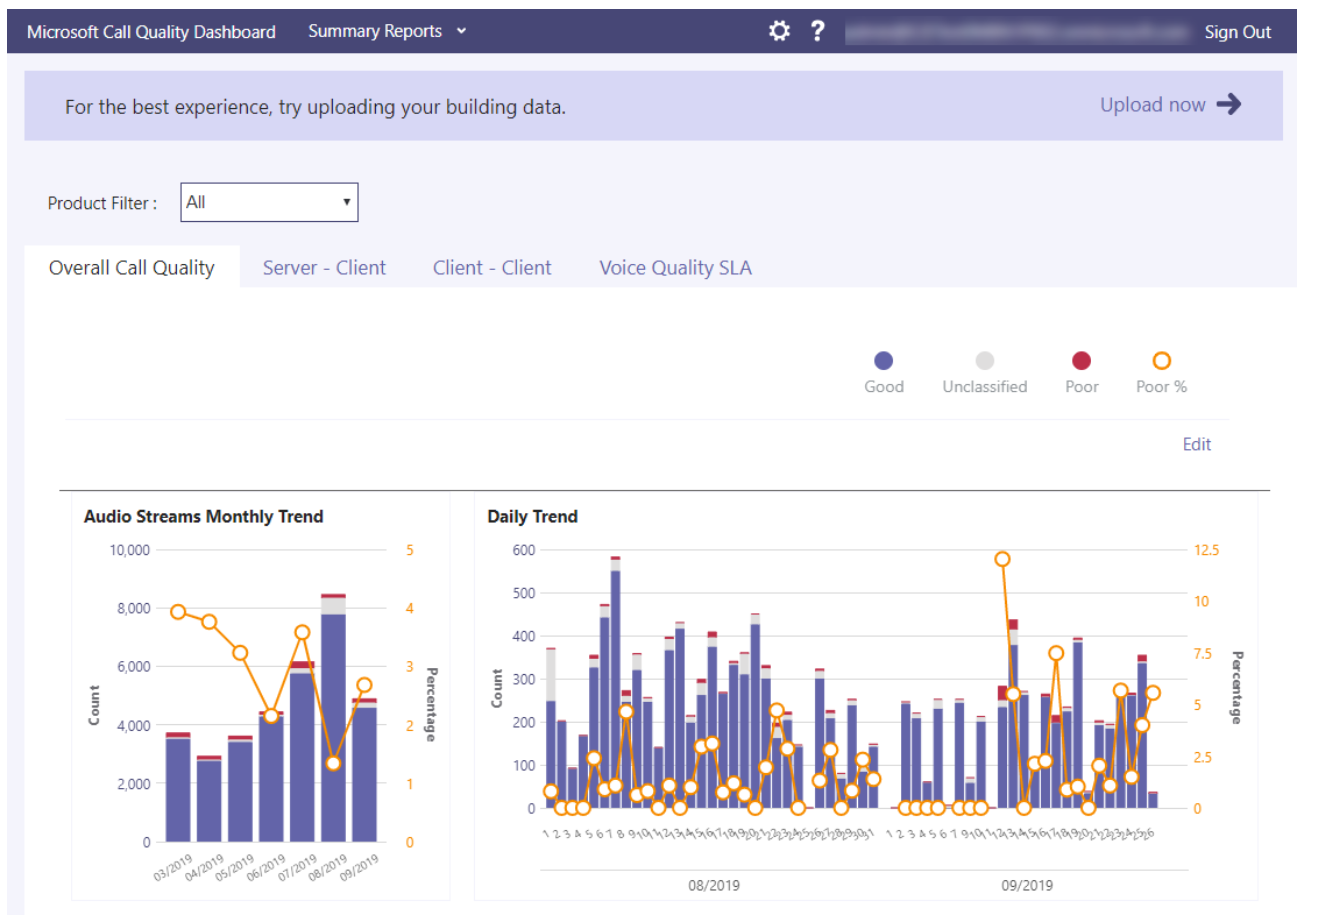
As an example of UC&C monitoring, Microsoft offers three tools that can be used to monitor Teams: Call Quality Dashboard (CQD), which analyzes org-wide trends or problems; Call Analytics, which analyzes individual calls and meetings; and Quality of Service (QoS), which allows IT to prioritize important network traffic. As you can probably tell by looking at a snippet of the CQD, it isn’t an intuitive way to troubleshoot the underlying cause of an issue, since it can only display Teams metrics, not information about the device on which Teams was running.
ControlUp recognized that our customers needed an easy-to-use, more intuitive solution that could be used to not only diagnose UC&C issues, but to drill down to find their underlying cause. Edge DX, our endpoint and application-monitoring solution, can now do exactly that.
In a recent blog, we talked about the importance of UC&C applications and how ControlUp for Desktops can monitor them to detect problems, and find and fix them fast. In this article, I will show you how it goes further by relating information from the device itself during the timeframe of the call. If you haven’t had a chance to read the previous article, I highly recommend reading it before starting this one.
Using ControlUp for Desktops to Monitor Unified Communications Solutions
Let’s take an in-depth look at a user’s Teams call.

The above screen shows that the user had some issues on a Teams call, but we need to know why and where the problems originated. This is where the holistic monitoring capabilities of Edge DX come into play. By clicking on a device that was participating in the call, we can select View Device Details.

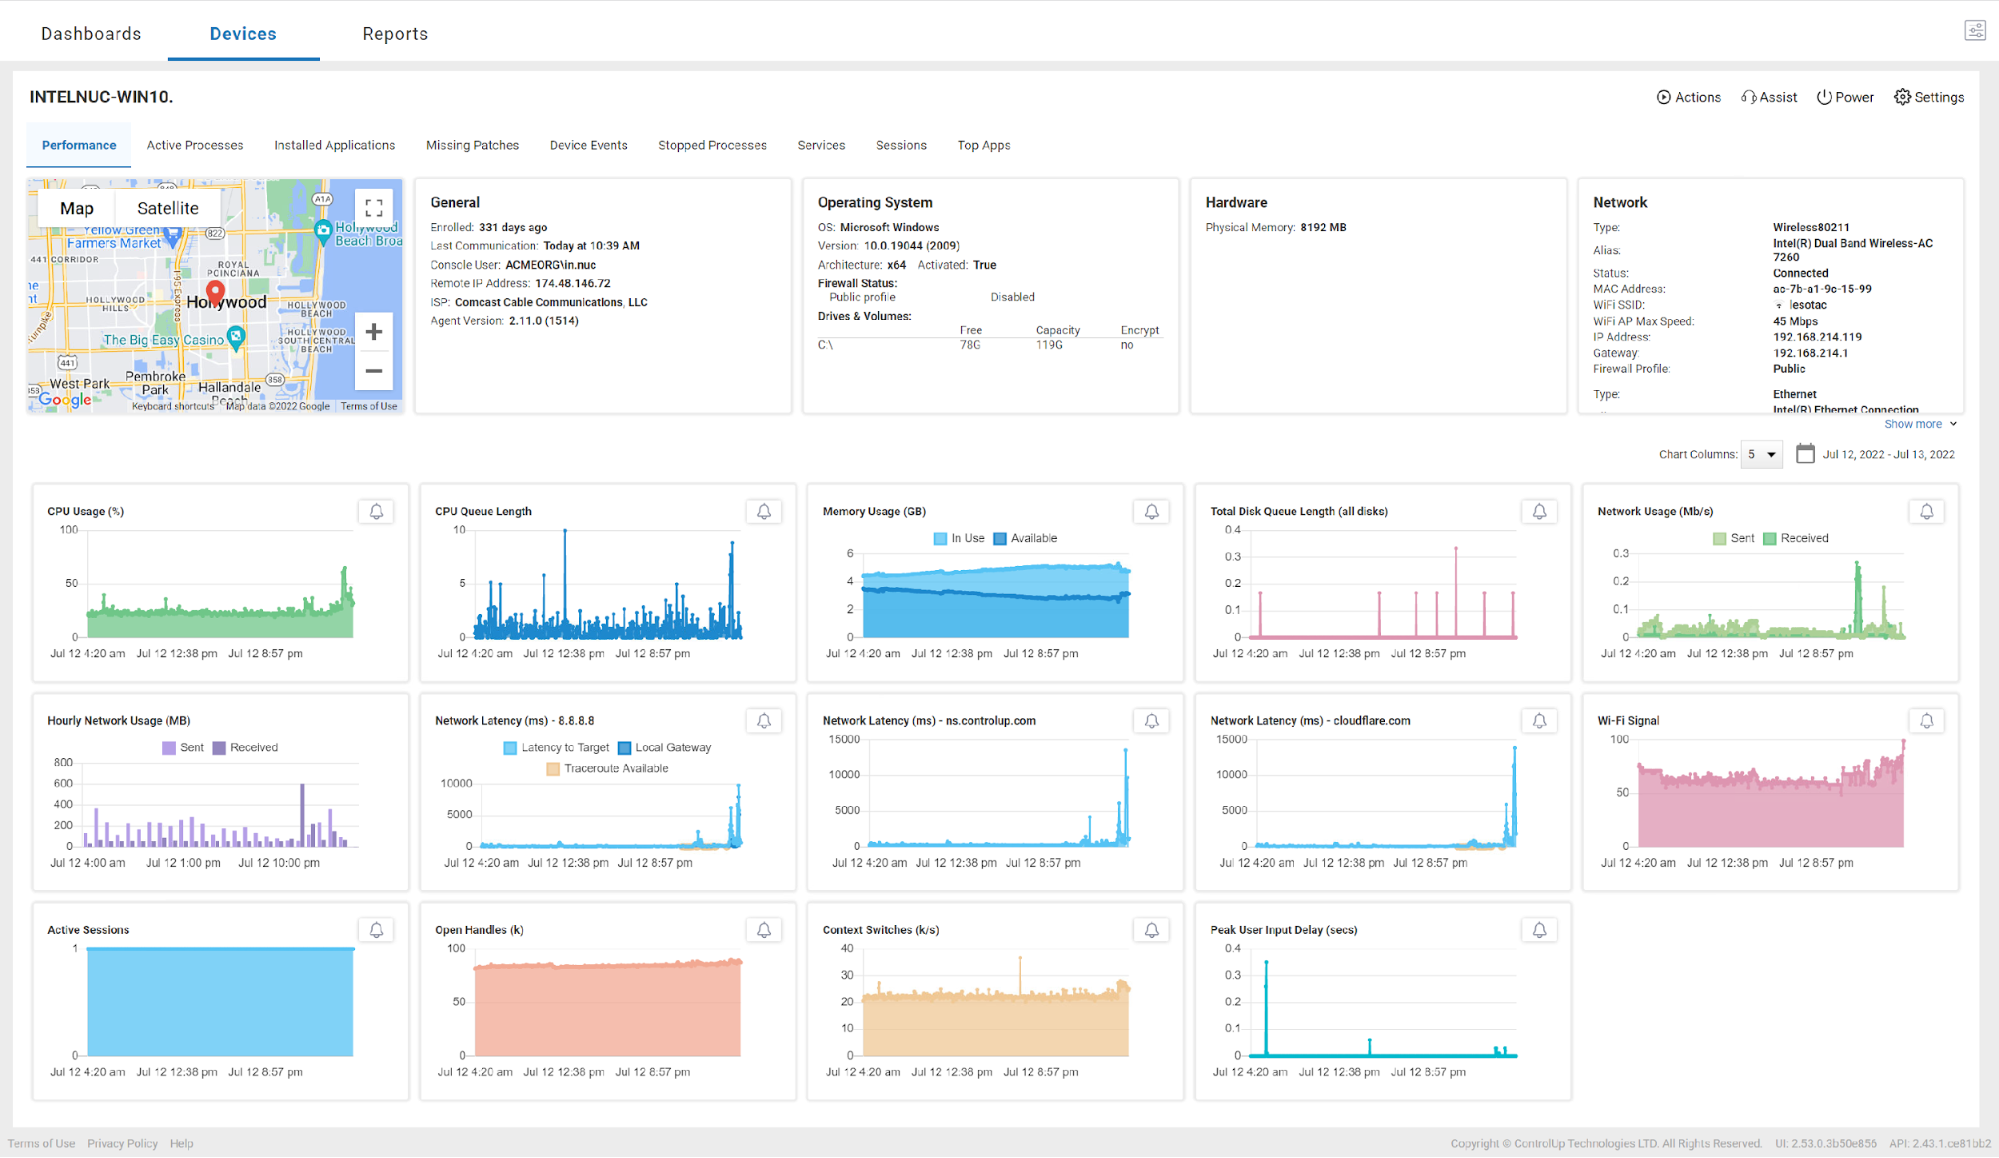
This allows us to see the metrics on that device at the time of the call, so we can see what factors may have caused the issue.
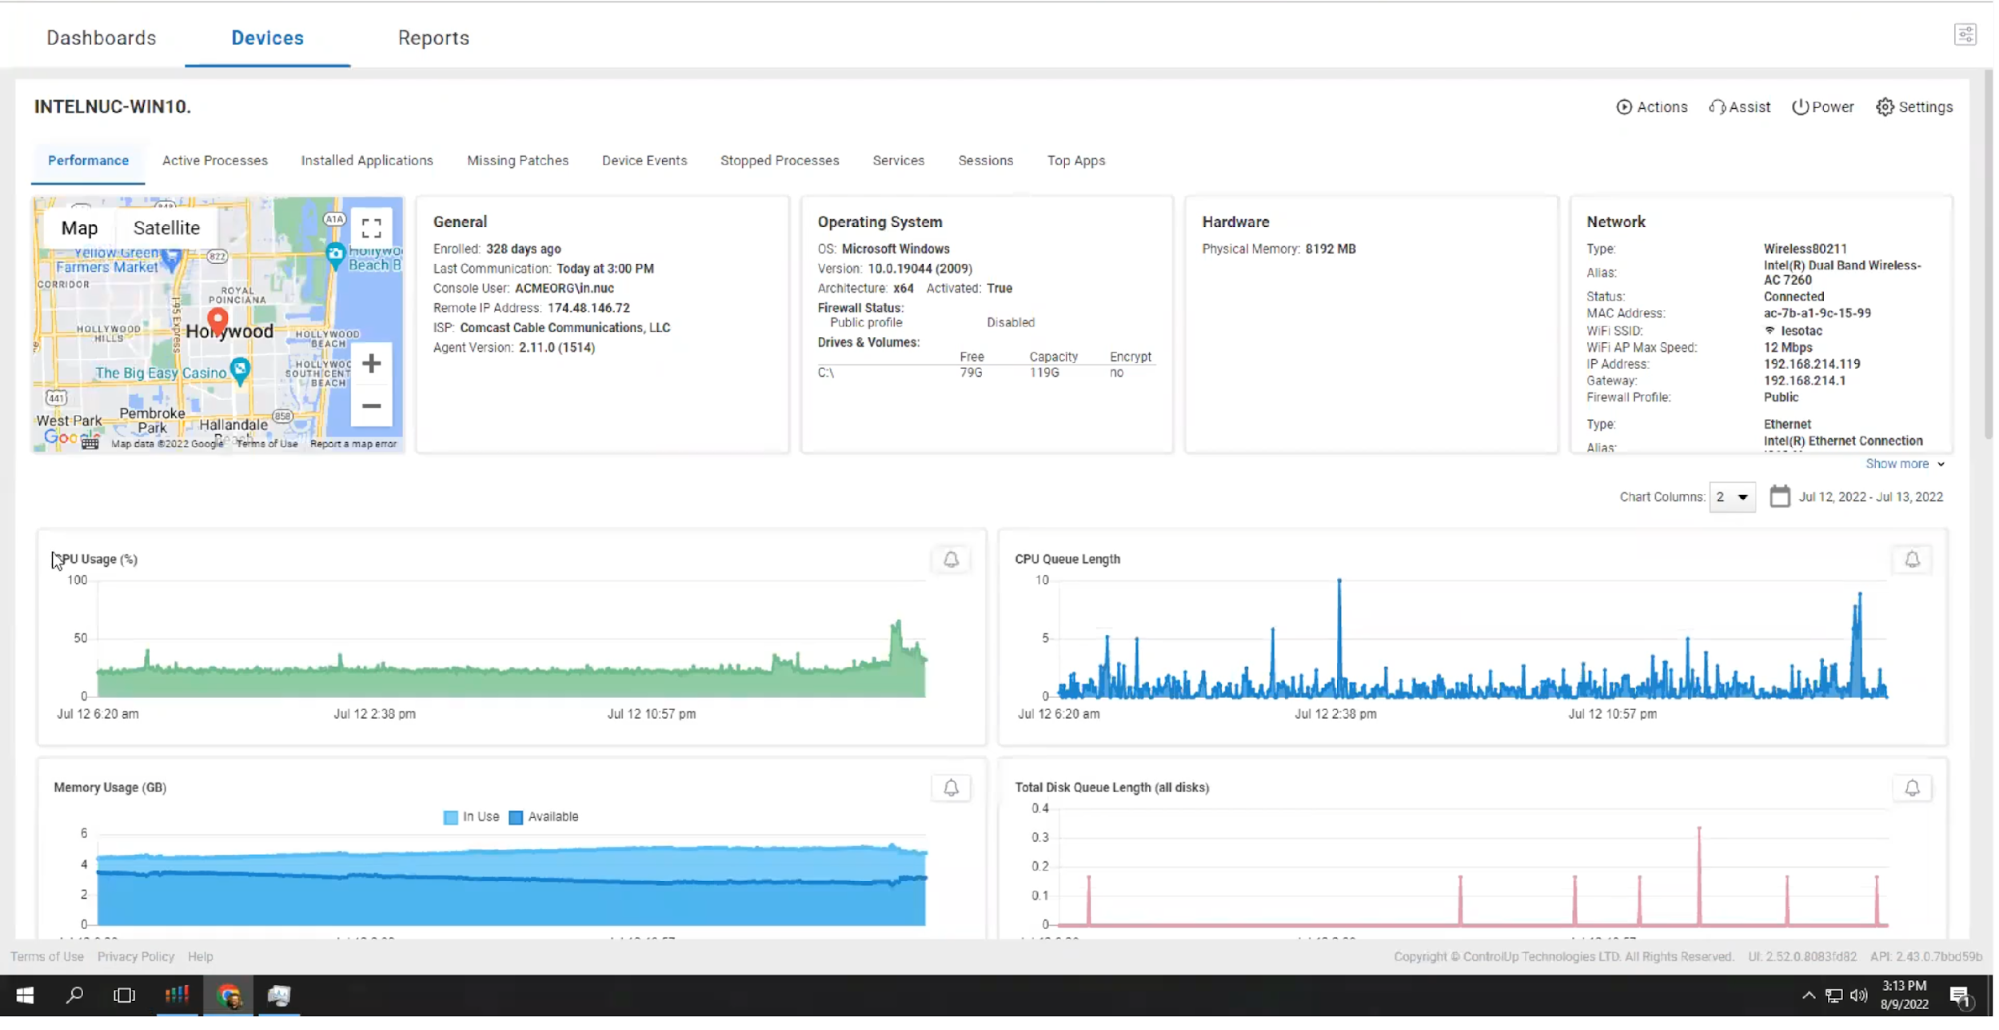
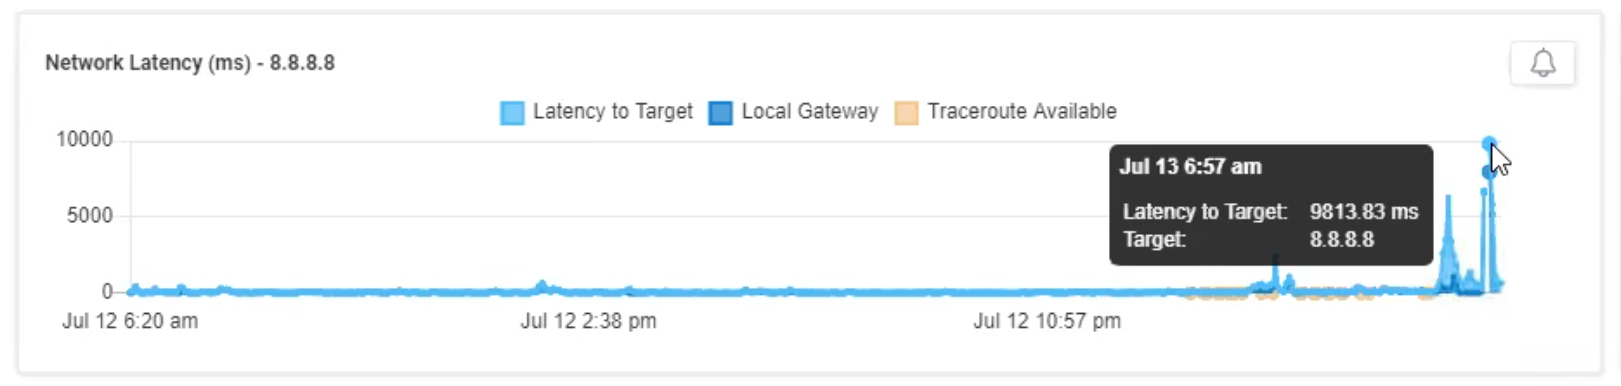
In this case, the max Wi-Fi speed was 12 Mbps, which isn’t great, but Microsoft says that Teams only needs 4Mbps for “best performance.” So why did the call fail?

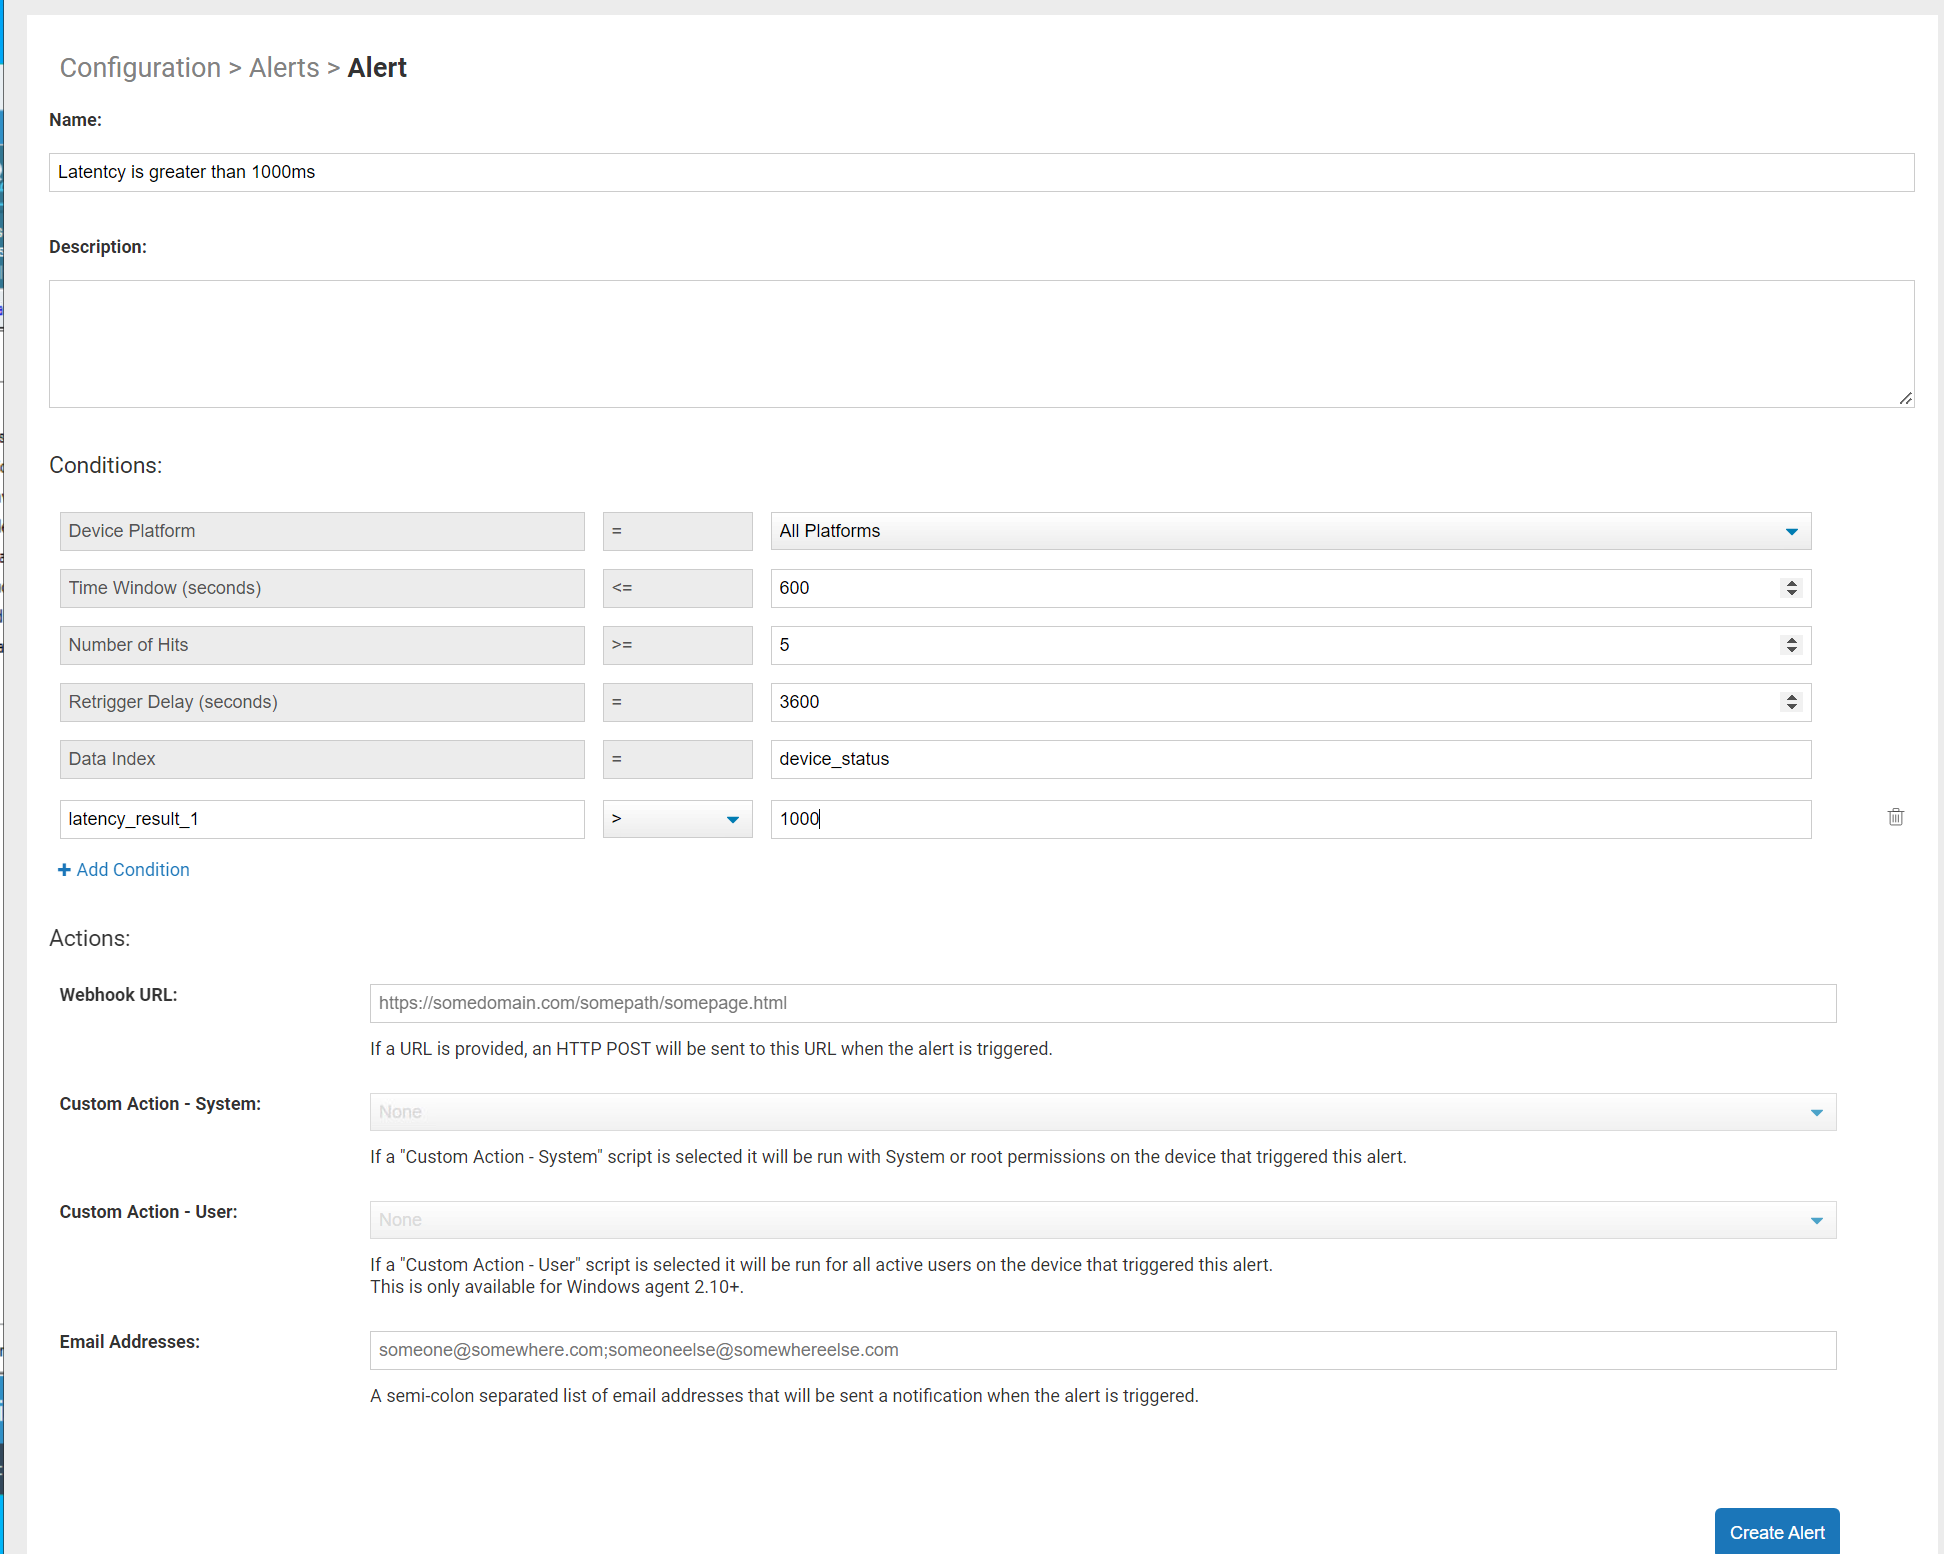
If we look at the latency, we can see that it jumped to 9 seconds when the call failed. Given that Microsoft has a latency target of less than 100ms, this was the cause of the issue and a metric not available by examining the Teams data alone.
If you suspect that a problem was with the internet service provider (information that ControlUp captures), you could compare it to other devices in the same geographical location using the same provider.

Of course, the problem could be with other resources on the device, such as CPU and memory, and these metrics can also be seen from the Edge DX dashboard.
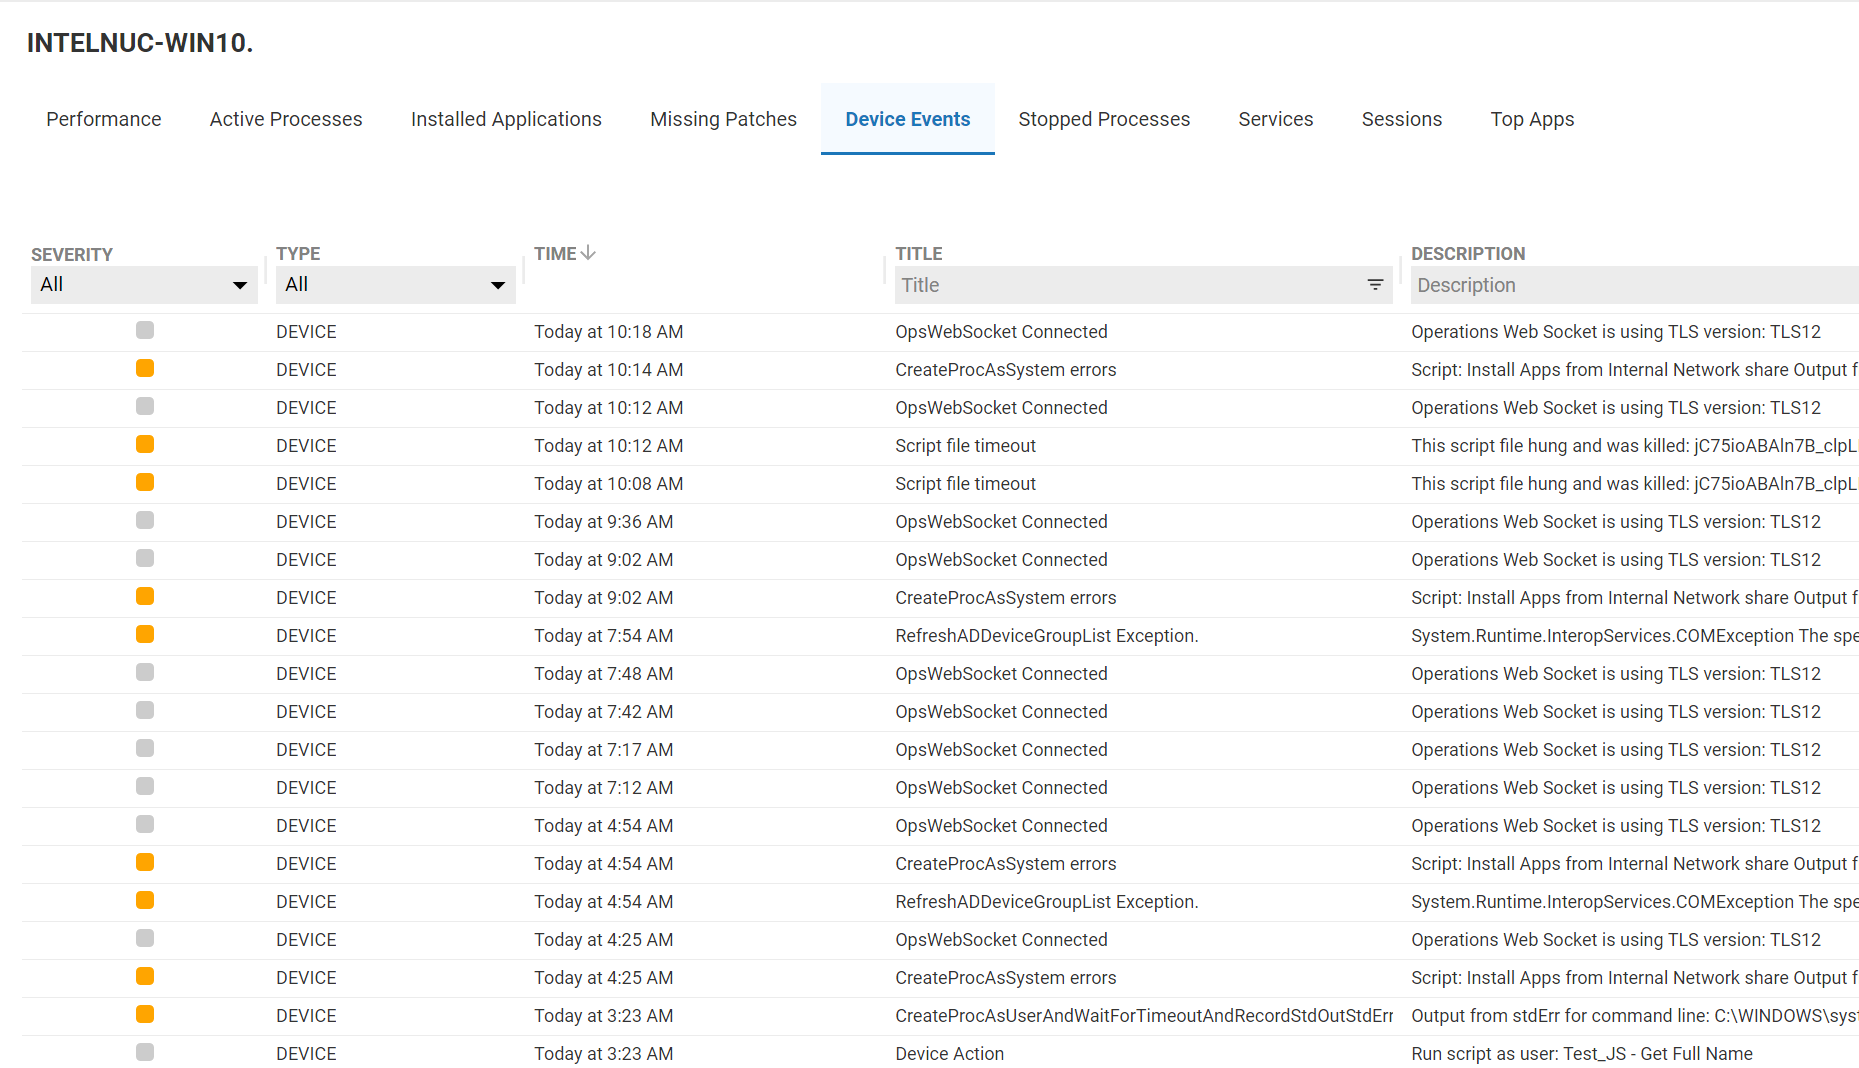
The problem may have also stemmed from another application. Again, using the Edge DX dashboard, you can see what other applications were running at the same time and view the device’s logs.
You can even view the missing patches on the device from the same dashboard to see if that might have caused the issue.

Furthermore, Edge DX’s alerting feature will notify you when a metric exceeds a specific threshold so your help desk can address the issue in real time if it reoccurs.