
Whether it’s monitoring Unified Communications applications—like Teams and Zoom—or implementing new features like our new Enhanced Devices Dashboard, ControlUp is laser-focused on continuously making ControlUp for Physical Endpoints & Apps more useful for our customers. By taking advantage of these new features as they’re rolled out, you’ll be able to deliver a better digital employee experience to your users.
At ControlUp, we pride ourselves on listening to our customers. As our solutions mature and our customers provide feedback on features they’d like to see, we incorporate them into our offerings to make them more intuitive and simpler, so our end-users can complete tasks quicker and more efficiently.
So, when our customers came to us and said, “You know, we love how ControlUp gives our IT teams visibility into physical endpoints and helps them troubleshoot home networking problems. We just wish it was all easier to see.” We said, “Message received!” We took this feedback to heart and built a brand-new dashboard for ControlUp for Physical Endpoints & Apps.
Our next-gen, enhanced device dashboard has a brand-new look and feel, composite metrics, customizable dashboards, and multi-action capabilities. This makes it easier to spot issues with endpoint devices and, more importantly, remediate these issues more quickly.
This new dashboard is accessed by selecting Devices 2.0 from the Dashboard drop-down menu.

This dashboard has a modern look and displays data in a more instinctive way and a more consumable manner.
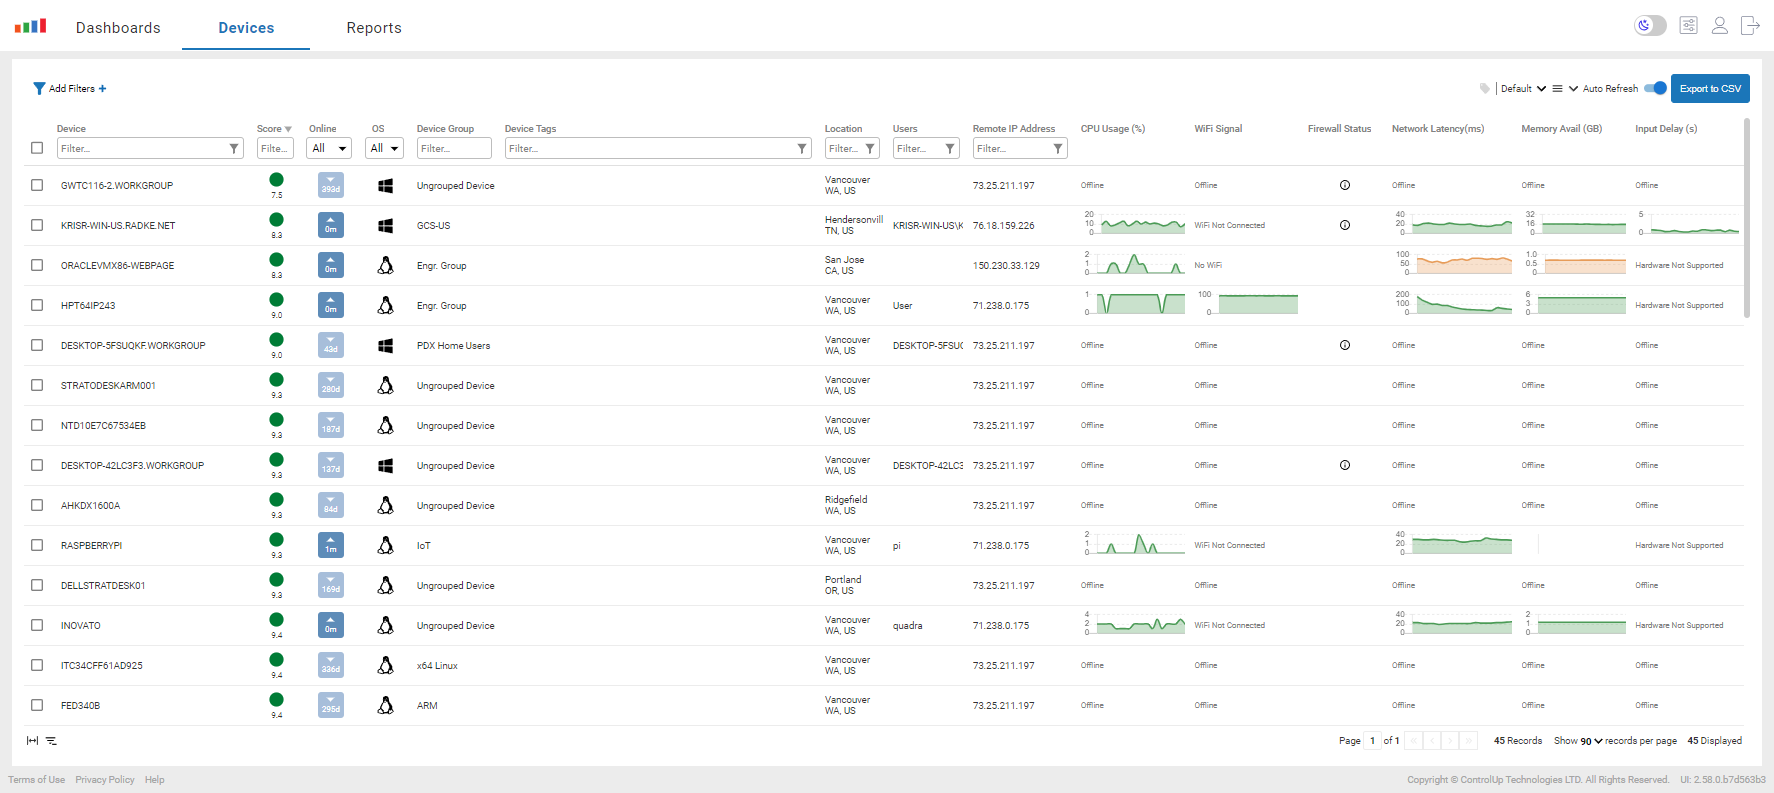
The first thing that will catch your eye is the Device Score. It is a composite value made up of the metrics that most affect an end user’s experience and is used to quickly identify users that are having sub-optimal experiences. This is color coded and when it is hovered over it will show the values that it is composed of so you can quickly identify what is causing the issue so that you can take the appropriate steps, either manually or via a pre scripted action, to remediate the issue.

Seldom does a single device need to have an action performed on it. So, it’s no surprise that mass-healing of devices has been among the most-asked-for features in Edge DX. Mass-healing is done by selecting the checkboxes in the far-left column of device row and then selecting the activity that you want to perform from the Actions drop-down menu.

The ability to run an action on multiple devices at the same time can greatly increase the productivity of help desk professionals. Seconds matter when addressing security and other time-sensitive issues that may cause irreparable damage if they’re not addressed immediately. Being able to correct issues on multiple devices en masse greatly enhances IT’s ability to deal with them as soon as they are identified.
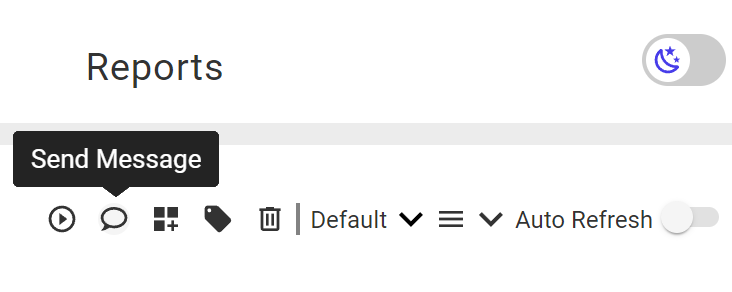
Sometimes you need to send an urgent message to multiple users. When this comes up, you can select which devices you want to send a message to, just as you did with mass-healing, and then select the Send Message icon to alert them to what is going on.
If an action only needs to be performed on a single device, you can start an action, send a message, and more, simply by selecting the arrow to the left of the device’s name. This is much quicker as it bypasses the older method of having to bring up the device’s detailed information page to accomplish these tasks.

Each of our customers’ environmental needs is unique. We empower them by allowing them to create their own personal dashboards and populate them with whatever columns they like.

The new dashboard can be created and pre-set with the metrics and information most important to them.
The use cases for this new feature are limited only by an individual’s creativity and needs. For example, if you wanted to see if there is a correlation between CPU usage and whether the system has a GPU in it, you can create a dashboard that displays CPU metrics and the type of GPU in the device. By doing this, you can spot relationships between the data that is displayed.

Devices have a logical relationship between them. This could be the groups that use them, their geographical location, or any number of other shared associations. To make it easier to work with groups of devices that have such a relationship, you can now give them tags.

Using device tags, you can display, monitor, and perform actions on a subset of the machines that share logical commonality via the column filter option.

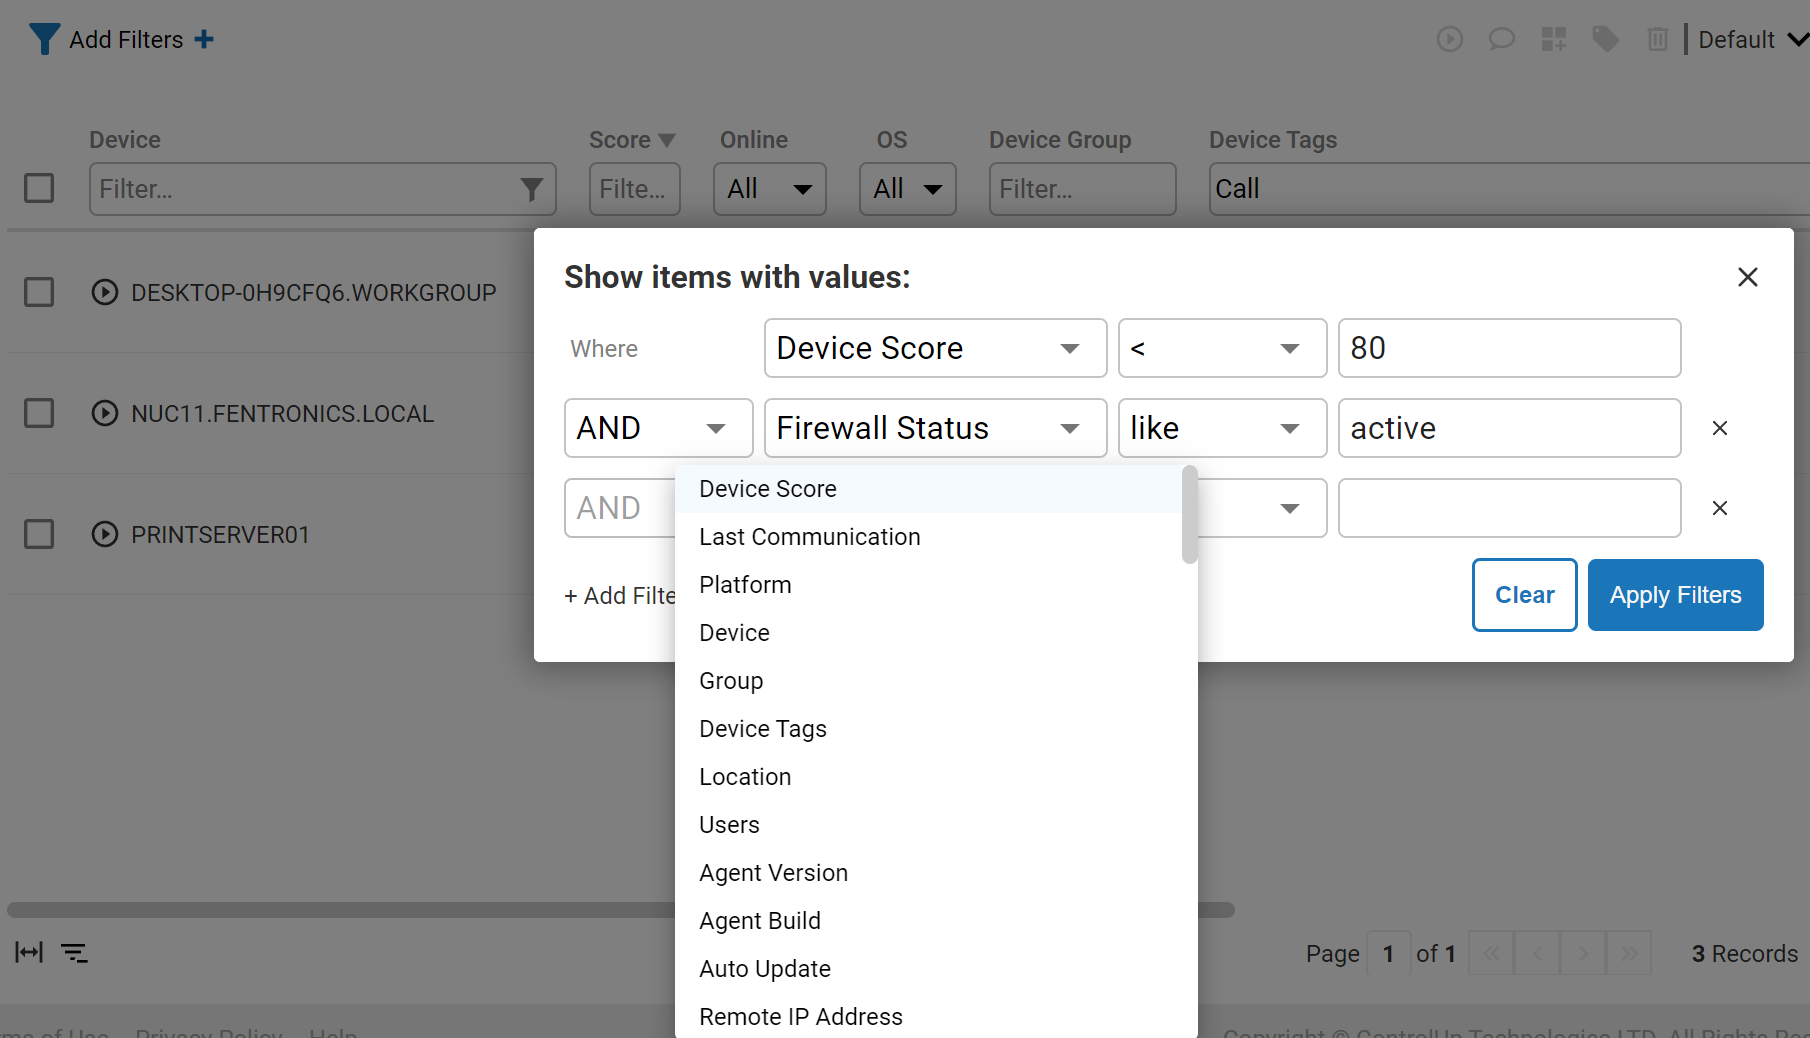
Single column filtering can be powerful, but often you need to do multidimensional filtering. Our new Add Filters feature lets you build complex queries, to further limit your display to the devices that you are concerned about. These are built up using And / Or logic and the information and metrics that are collected from the device.
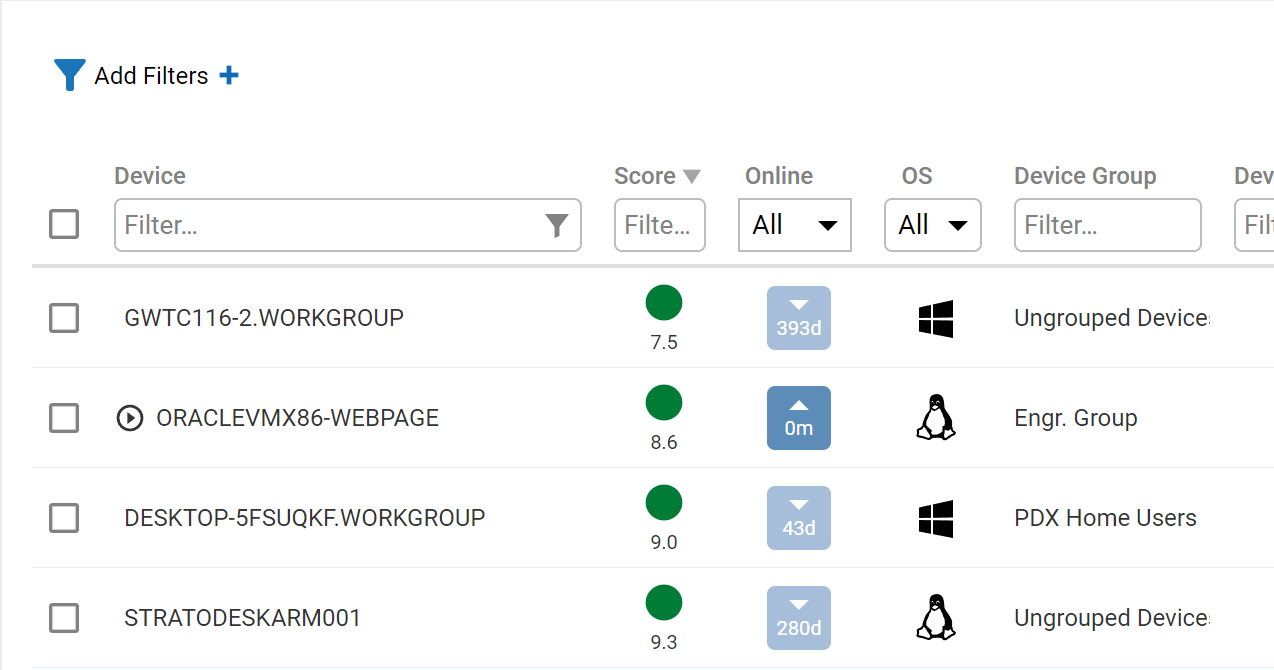
Working with stale data can lead to misleading conclusions. So you know your data is fresh, we’ve introduced a bright blue button that makes it easy to tell you the age of the data you’re viewing. This is helpful when you have auto refresh turned off, and, if you deselected the Online check box, you can identify which devices have been offline and for how long.
The pace at which we’ve been able to add new functionality to Edge DX is remarkable and is only possible with the hard work and passion of our engineering and development teams. Since Edge DX is a SaaS-based solution, new features like those covered here can quickly be rolled out and consumed by our customers.
Whether it’s monitoring Unified Communications applications—like Teams and Zoom—or implementing the features mentioned above, ControlUp is laser-focused on making our solutions more useful for our customers. By taking advantage of these new features, you’ll be able to deliver a better digital employee experience to your users.
To take a close look at ControlUp for Physical Endpoints—including Edge DX—and see all it can do, schedule a demo today!