As we have become increasingly dependent on unified communications (UC) applications like MS Teams and Zoom, we need to become aware when they, or the devices they run, have issues – whether it’s high latency on a device or mid-call failure. ControlUp’s Edge DX makes it easy to be notified when such events occur and helps IT teams understand and improve the digital employee experience for people running UC applications.
Creating an Alert when Latency is Greater than 100ms
Microsoft recommends 4Mbps of bandwidth and less than 100ms latency for Teams meetings or calls. It is trivial in Edge DX to set up an alert to notify the help desk when this occurs.
From a device’s dashboard, select the Create Alert icon within the displayed metric that you are concerned with.
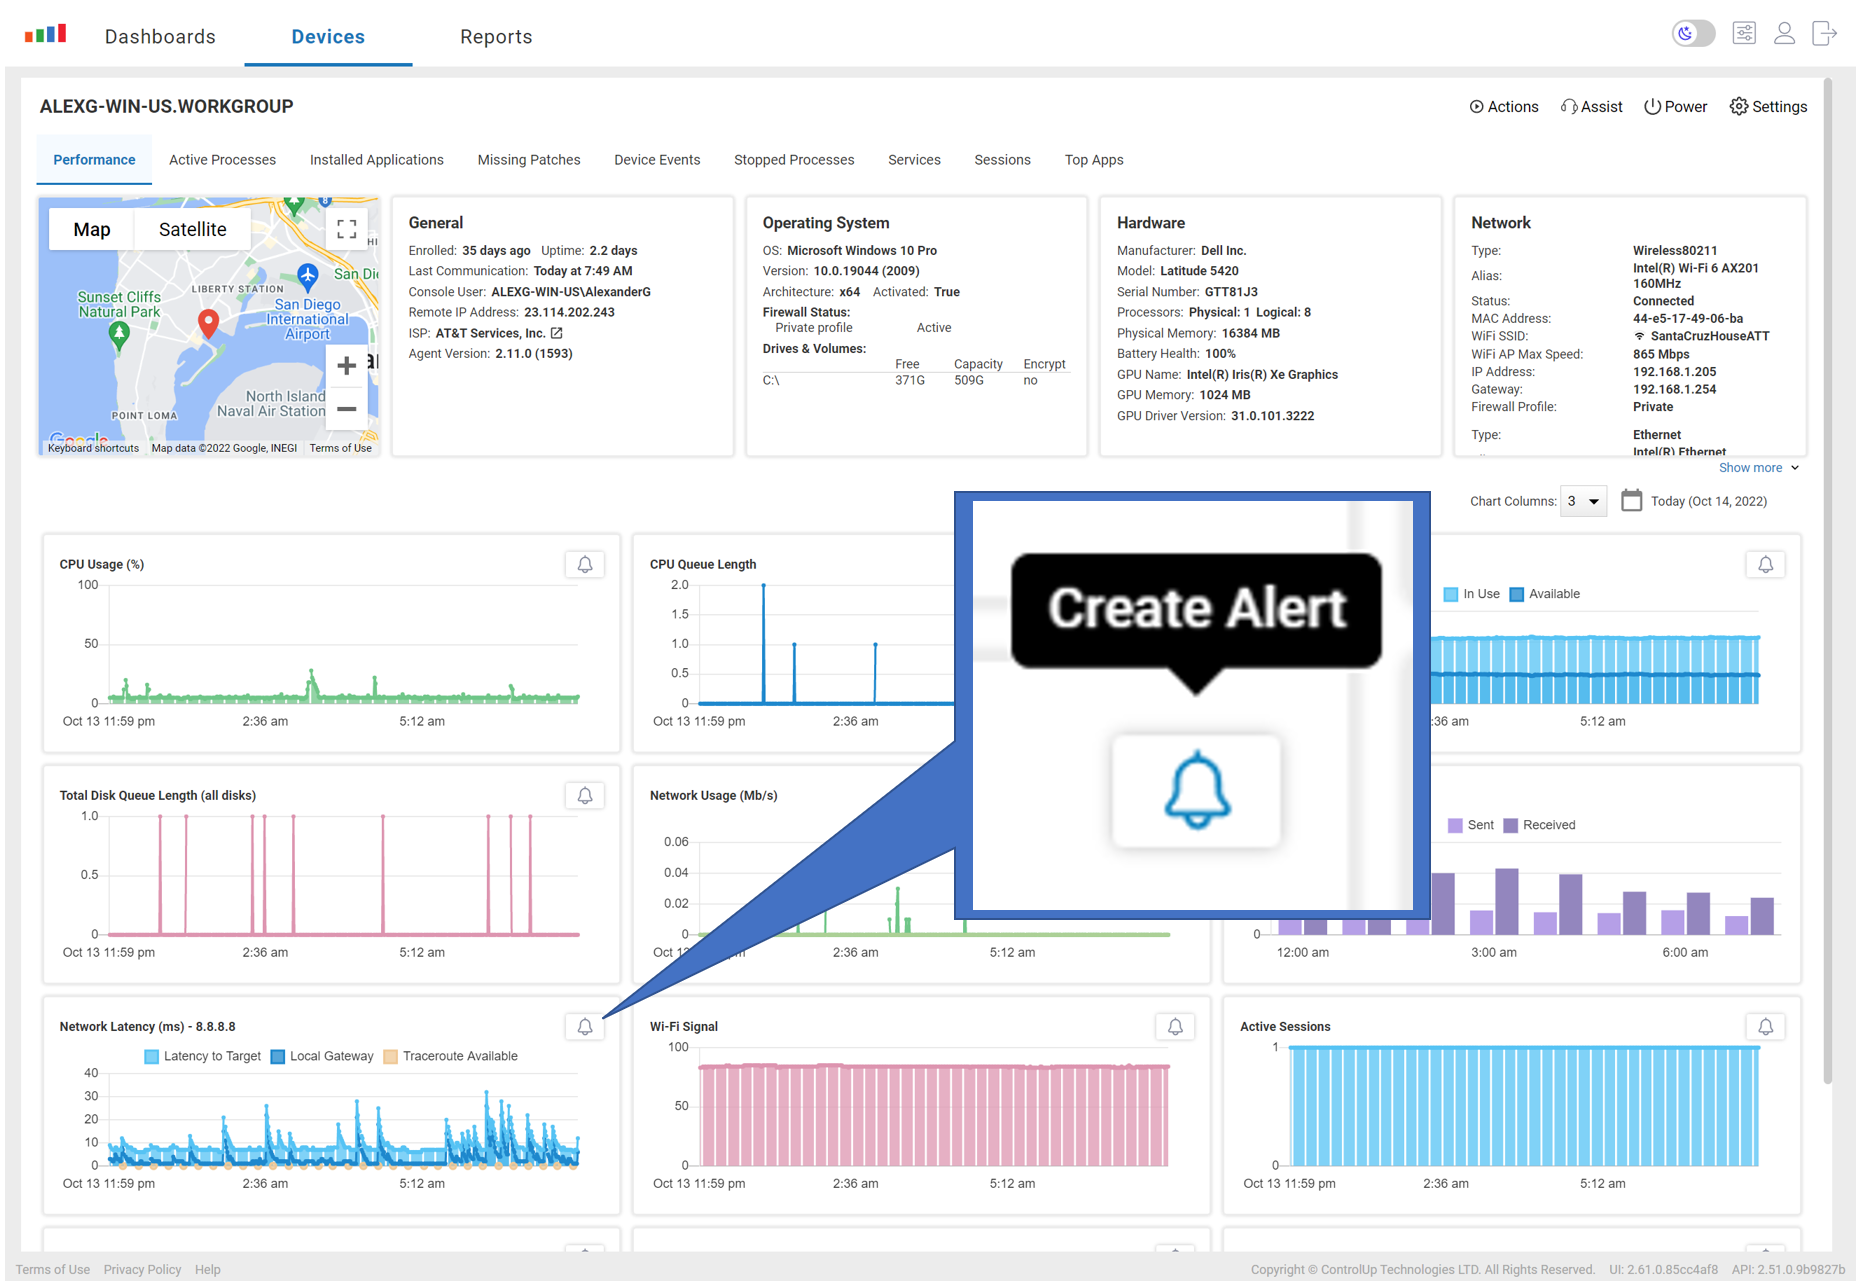
Figure 1: Create Alert
This will bring up the Alert wizard.
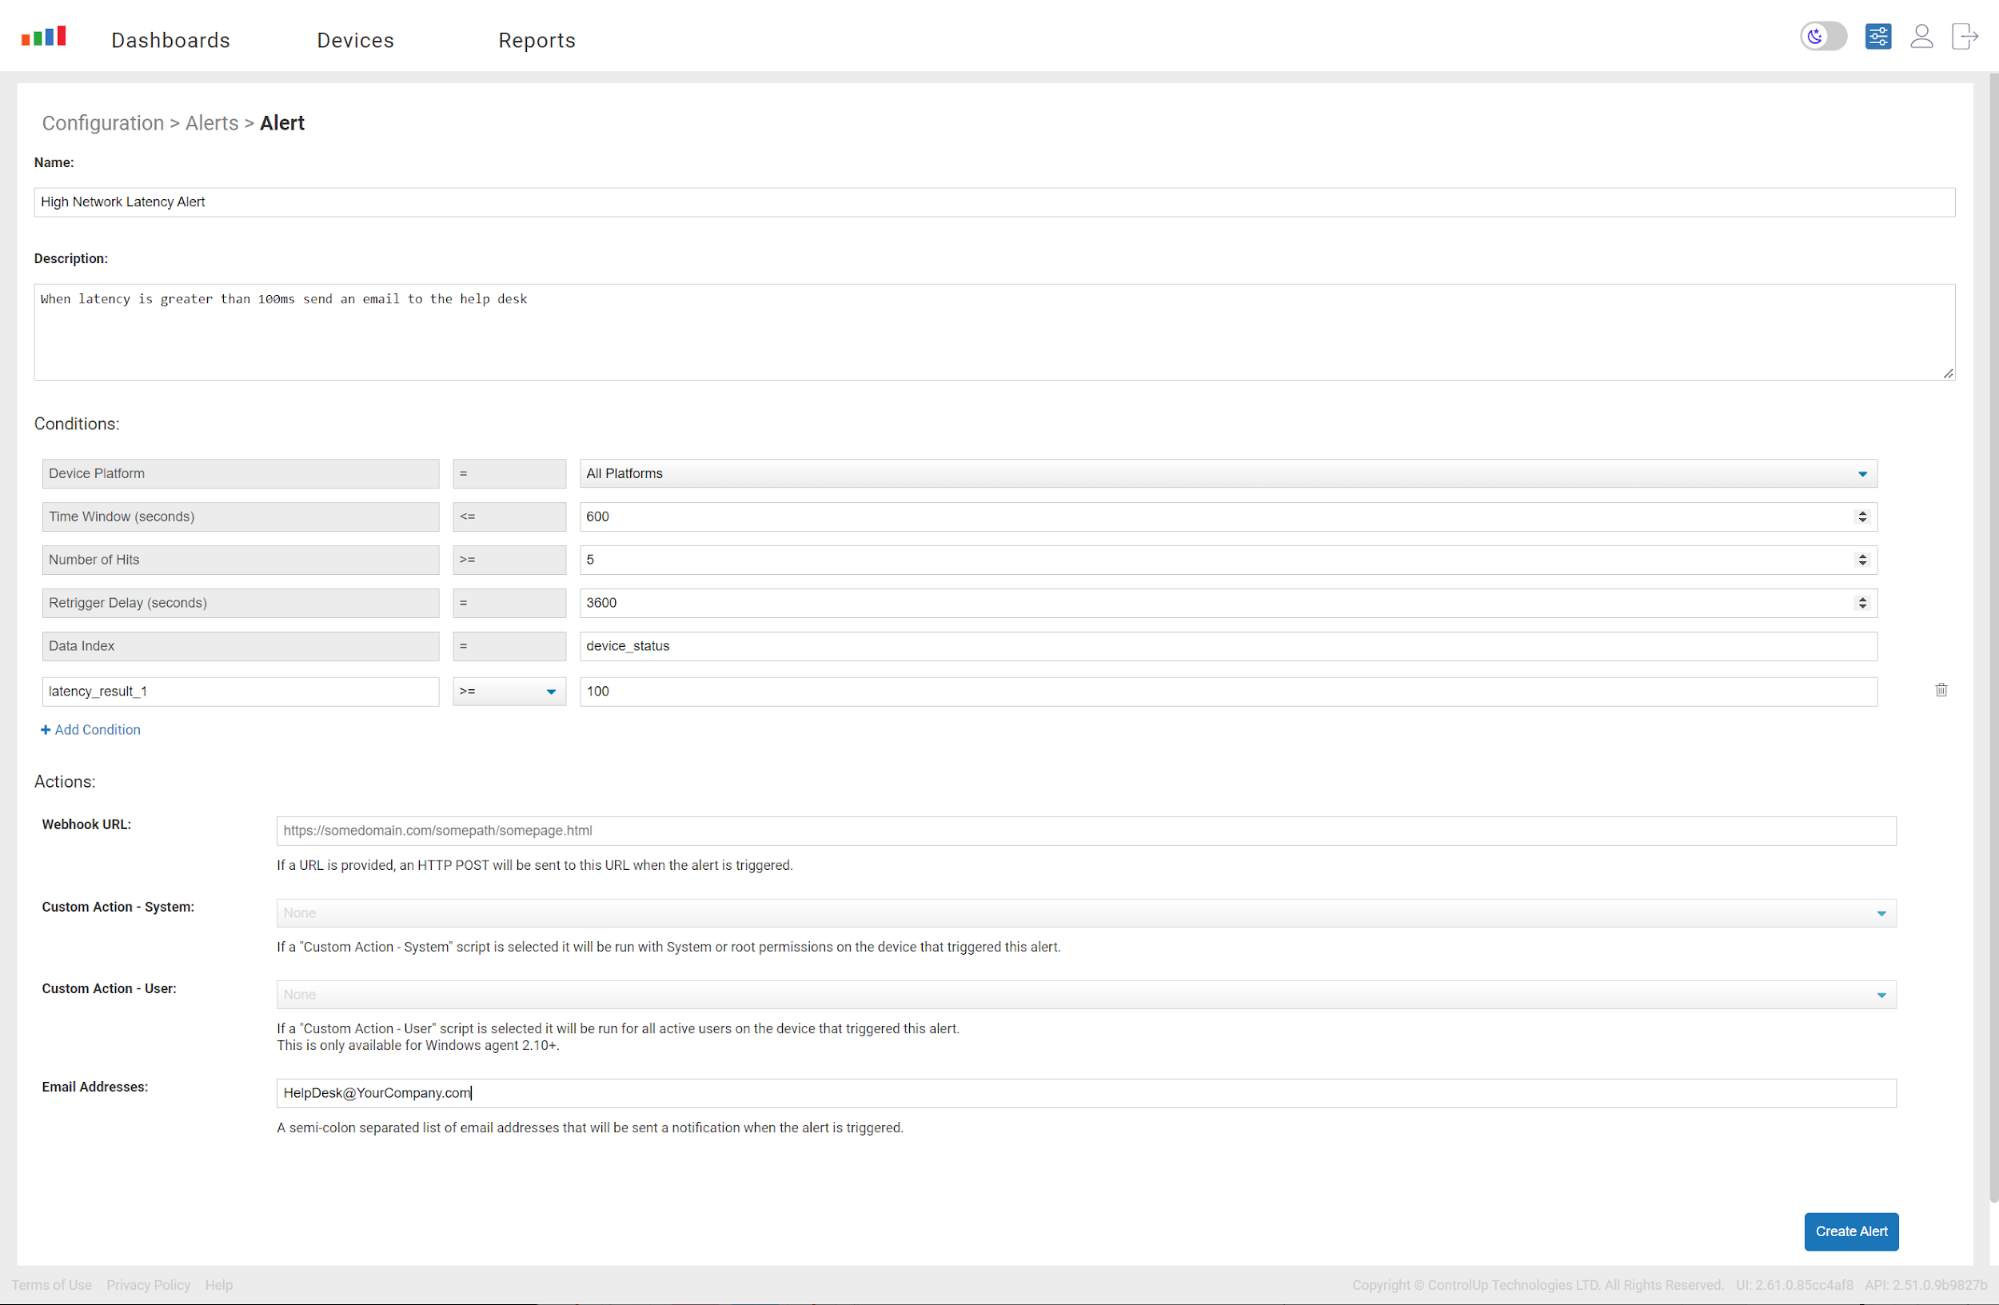
Figure 2: Alert Wizard
From here, you can give the alert a name and specify the conditions under which it will be enacted. In this example below, the pertinent aspect is that the alert will be sent when the latency is greater than or equal to 100ms.
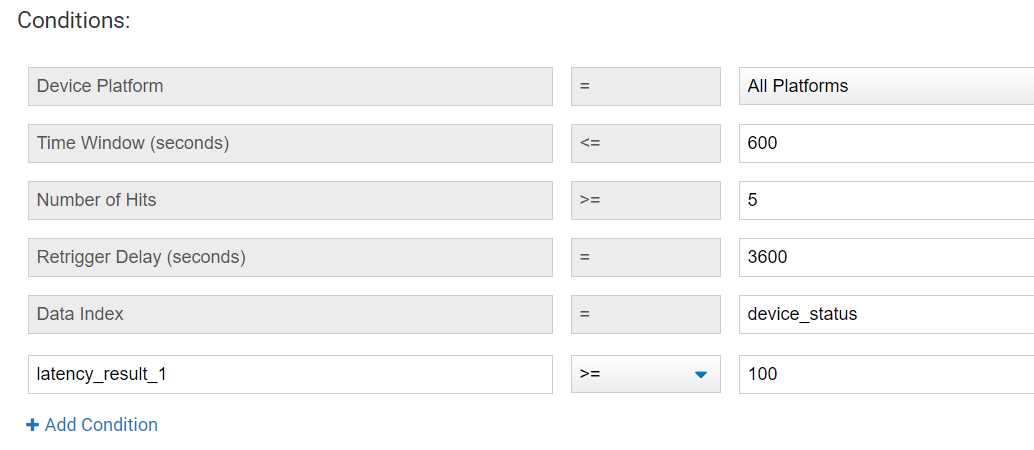
Figure 3: Alert Data
Then, you can specify how you would like to be alerted. This could be via email, running an action to correct the issue, gathering more information about the device or anything else within the purview of the scripting language that is being used, or by instantiating a webhook.
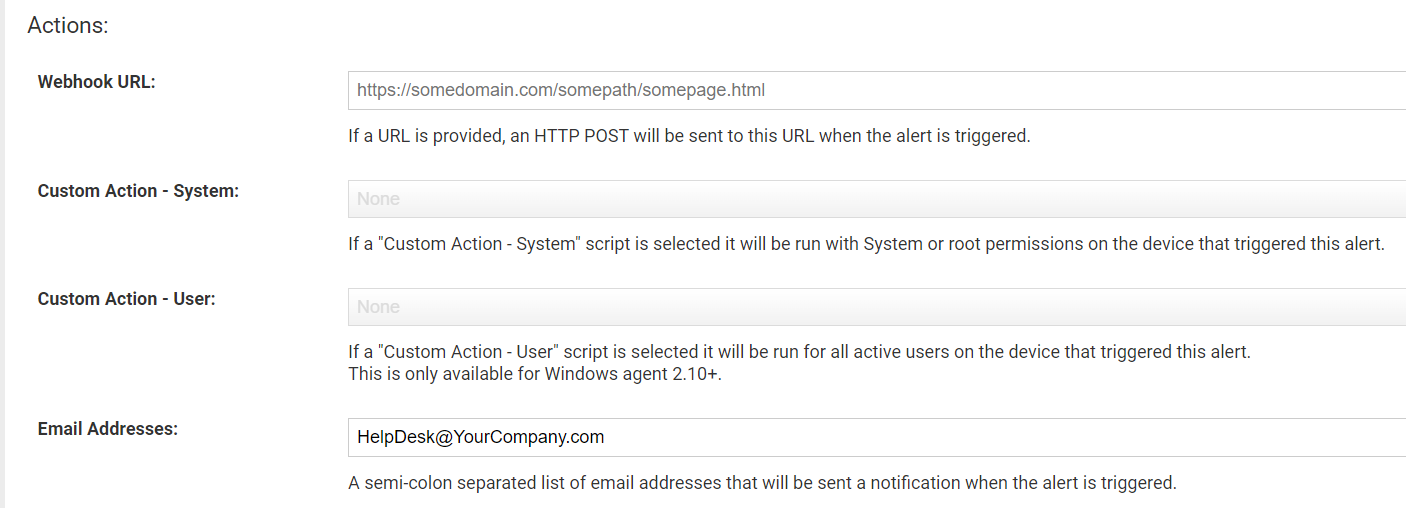
Figure 4: Alert Triger
You can view and manage (i.e., edit, delete, etc.) the alerts that have been created by selecting Alerts from the Configuration drop-down menu.
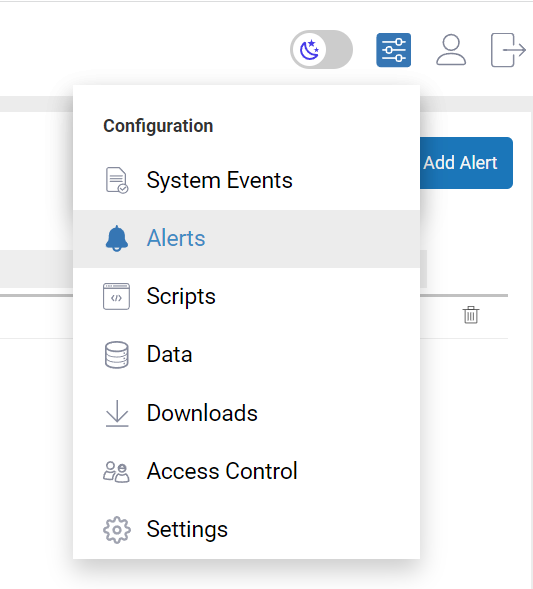
Figure 5: Alert Configuration
Creating an Alert When a Call Fails
One of Edge DX’s most unique and powerful features is its open database and the fact that any of its metrics can be used to create an alert, including information about UC calls.
To create a mid-call failure alert, I selected Alerts from the Configuration drop-down menu and selected Add Alert
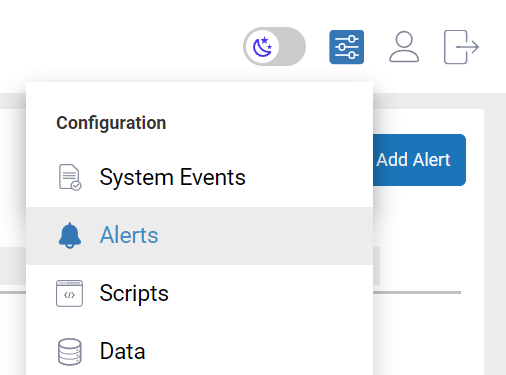
Figure 6: Alert Call Fail
I created an alert from the Alert Wizard that would email me if the midcall_failures field was not equal to zero. This information is in the edgedx_ucc_calls data index. As an added measure, I could also have it send a webhook, open a ServiceNow call, or run a script when the condition is met.
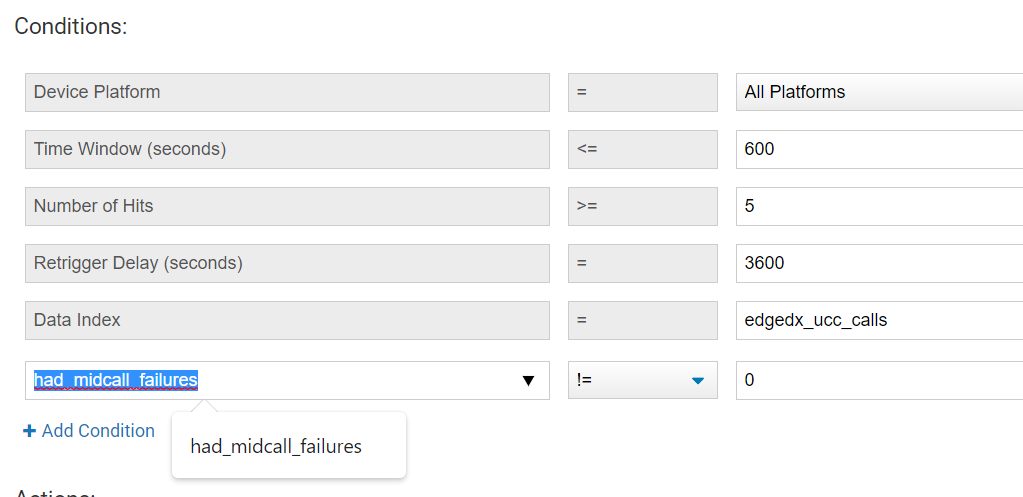
Figure 7: Notification
If you want to be notified of issues when a call occurs rather than after the fact, you could set up an alert using the data index process_connection_stats when the data index field MOS is less than 3500.
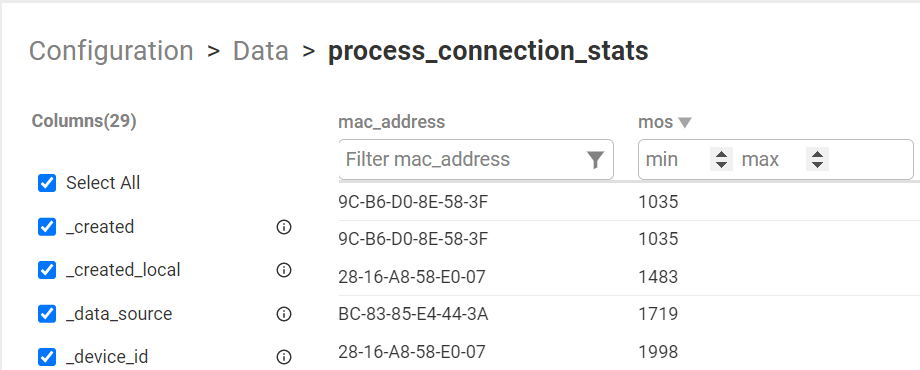
Figure 8: Status
After spending a few minutes acquainting yourself with Edge DX, you will find it extremely useful for monitoring desktops, laptops, and VDI clients and the UC applications that run on them. While knowing the health of a device and UC application is essential, it’s even more important to be alerted when something goes wrong to correct it or, even better – to prevent the issue from happening in the first place. Edge DX allows you to do all of this.
For those who have not yet implemented Edge DX, you will find that as it is a SaaS application, you will not need to set up any additional infrastructure to use it. You simply need to install Edge DX’s lightweight agent on the devices you want to monitor and then log into the Edge DX dashboard from a web browser to see them.
More information on Edge DX can be found on ControlUp’s Edge DX web page.