
Sometimes, when I work with customers, I think of a famous quote: “What are you gonna do today Napoleon?” Napoleon answers, “Whatever I feel like I want to do, GOSH.” I know Edge DX can detect and fix any desktop issue, but where do you start? This blog series will discuss how to find, prevent, and fix desktop computer problems to improve the Digital Employee Experience (DEX).
In a previous blog, Understanding the Employee Digital Experience, l discussed gathering performance data to understand the digital employee experience. This series will build on that understanding to improve the Digital Employee Experience.
Improving the Digital Employee Experience blog series:
- Step One: Alerting
- Step Two: Troubleshooting
- Step Three: Remediating
- Step Four: Maintaining
Try Edge DX free with the 50-User VIP Pack.
When people call the IT help desk for a problem with their computer, they want IT to meet expectations and handle the escalation so they can get back to work. However, one study shows that employees spend an average of three hours per week troubleshooting work-related computer problems themselves because they don’t want to deal with a helpdesk queue or do not believe the helpdesk can fix their problem. With Edge DX, alerts are used to know if employees have problems affecting the digital employee experience before a helpdesk is generated. Being alerted to problems is the first step to improving the digital employee experience.
Creating your first alert
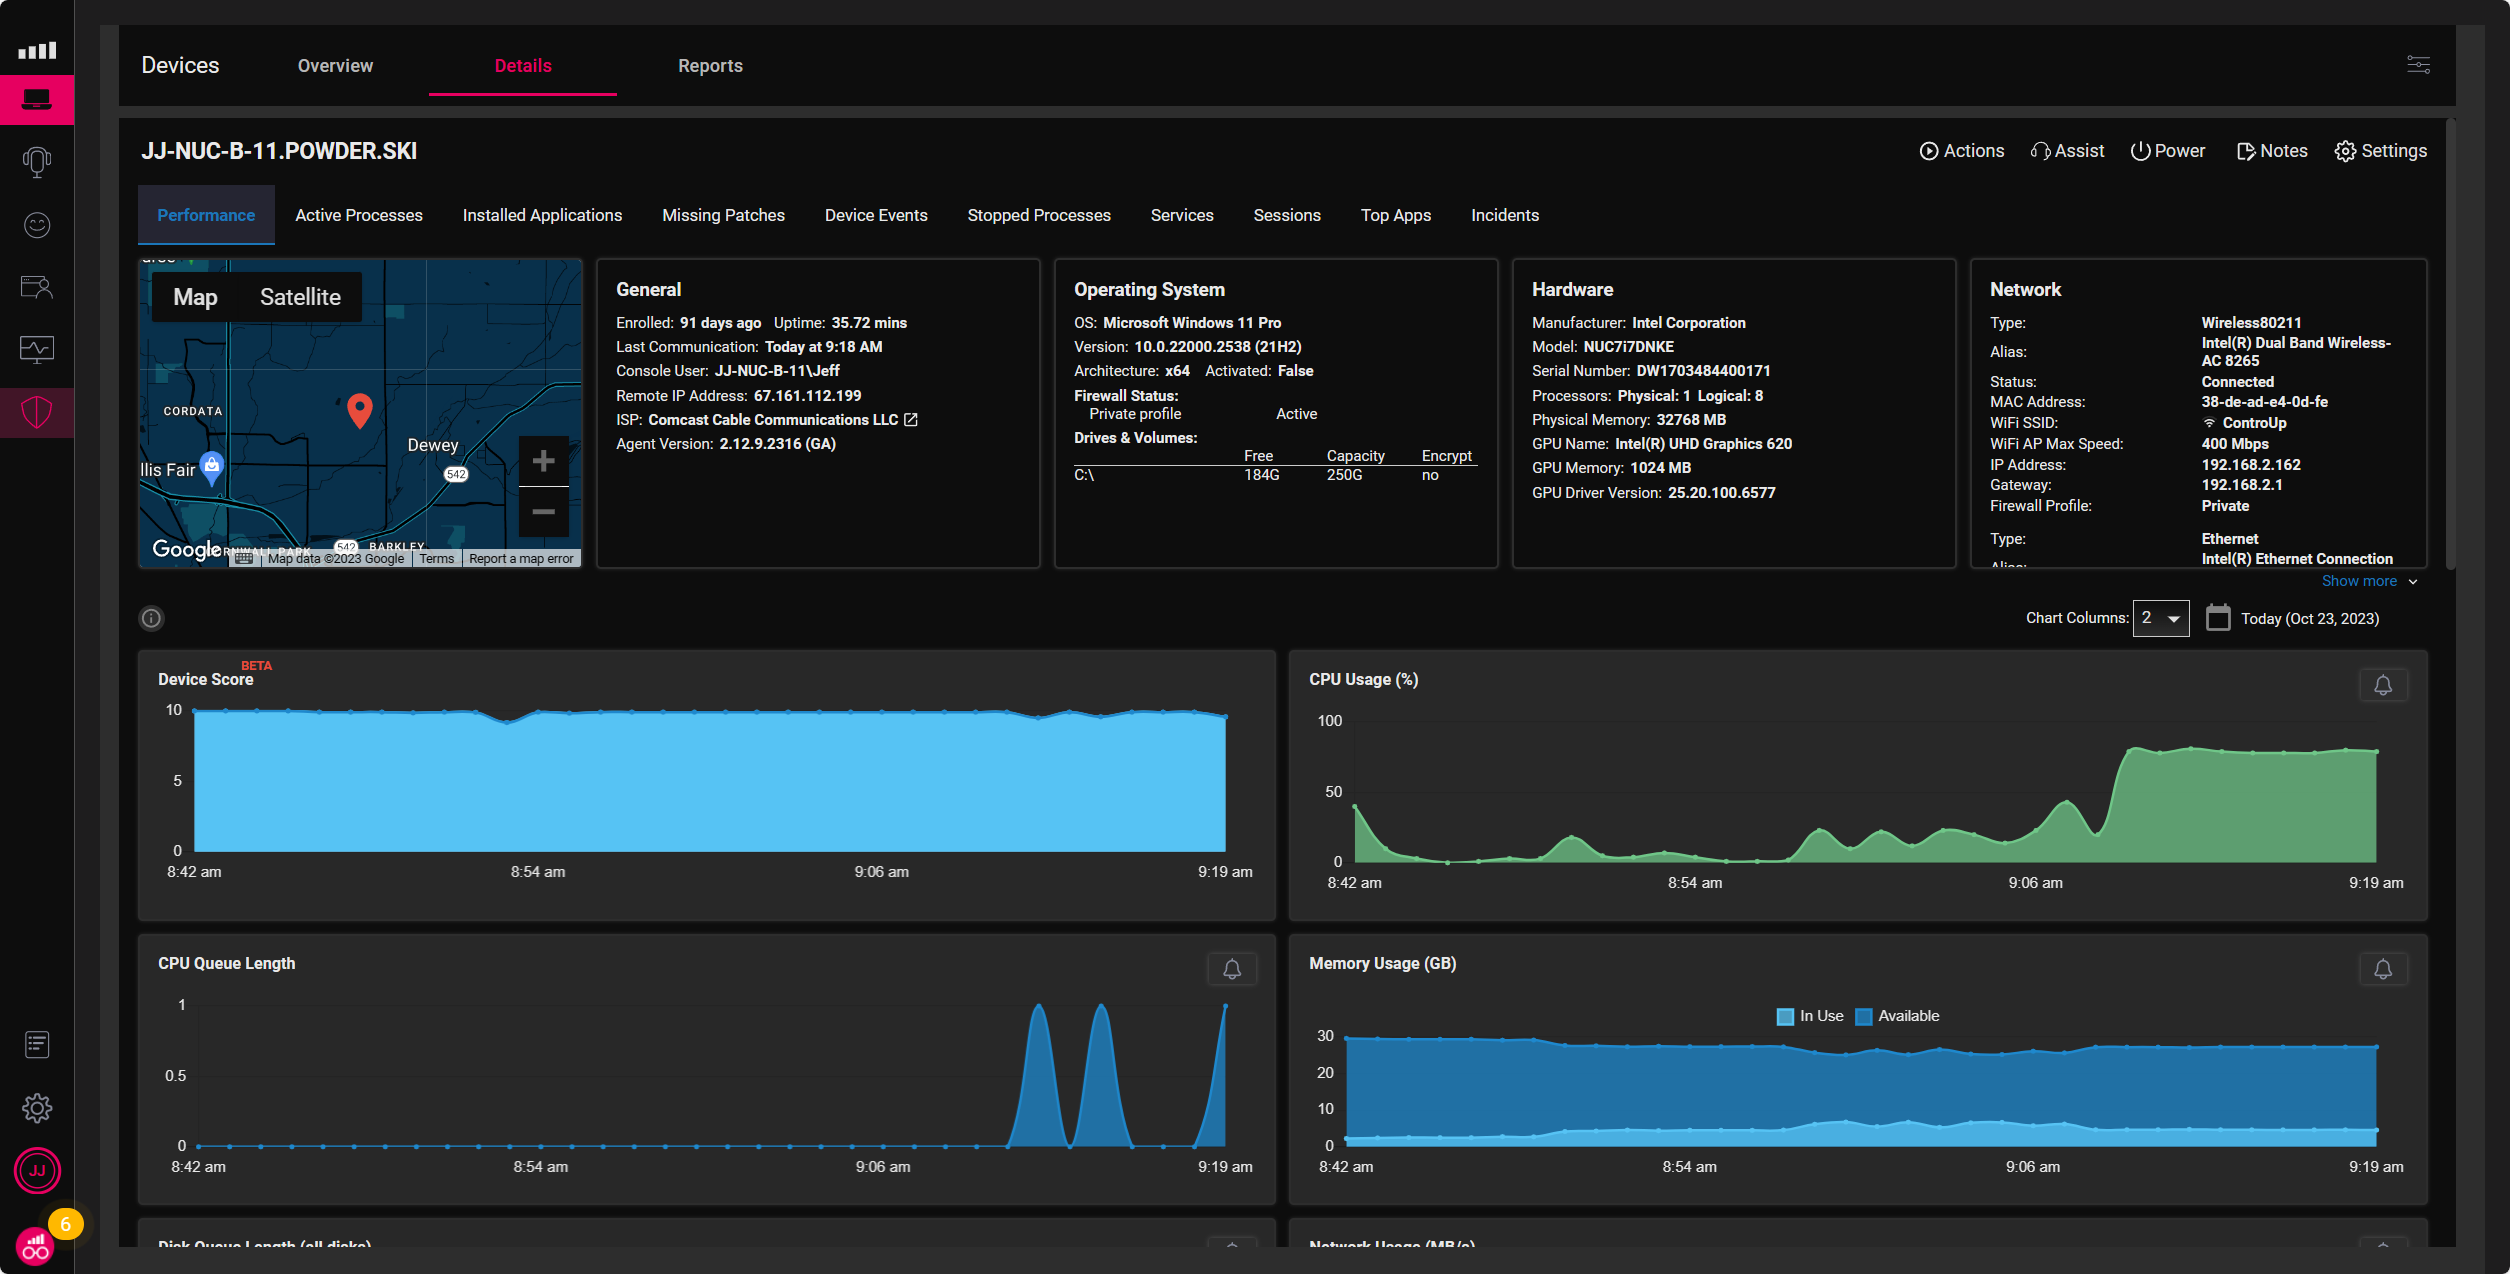
Being alerted to network, device, OS, or application degradation is the first step to improving the digital employee experience. ControlUp’s Edge DX collects real-time network, device, OS, and application performance data to notify IT or users of issues immediately. The easiest way to configure alerts is from the device’s detailed dashboard. A bell icon is in the upper right of the performance graph, such as CPU Usage (%). In Figure 1, you can see performance data from a device details dashboard.
Easily create an alert by clicking the bell icon in the upper right of a graph. Edge DX will automatically configure the default parameters to setup an alert. Alert parameters can then be customized, such as device type (OS), frequency, and anything you would like the alert to do, such as an email, custom action, or creating a ServiceNow ticket. Figure 2 shows an alert when a computer’s CPU is higher than 80%, five times in ten minutes (600 seconds).
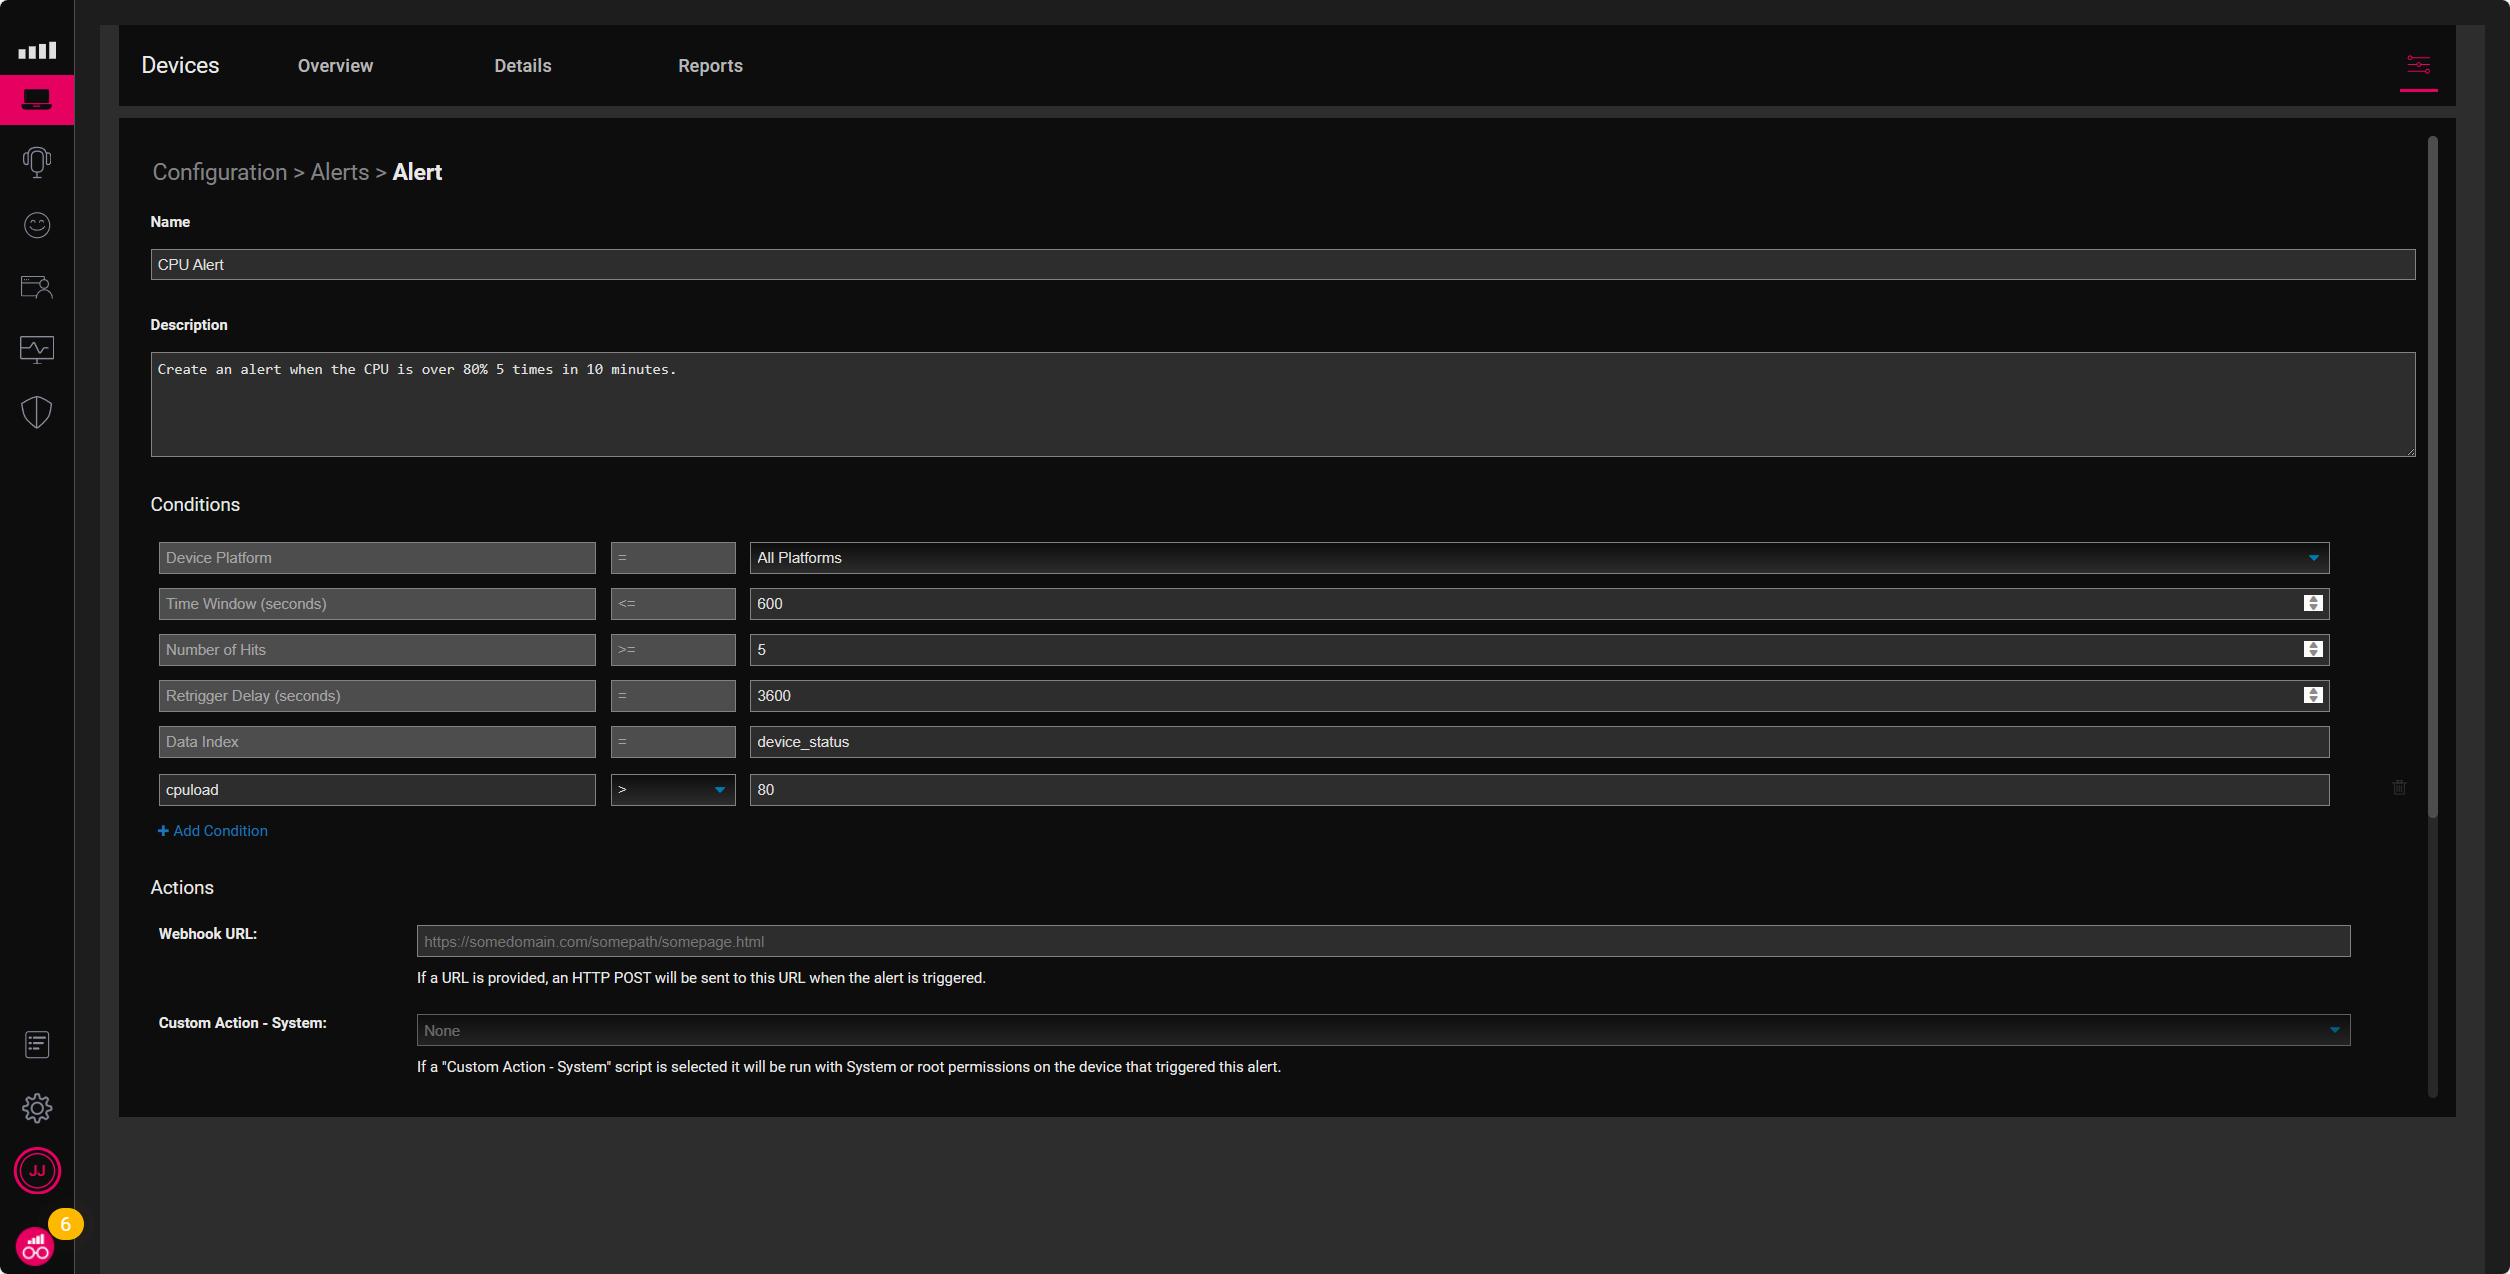
Alerts can be highly customizable to make accurate decisions while preventing false positives. Customize alerts by Device Platforms such as Windows, macOS, and Linux, and conditions such as Time Window, Number of Hits, Retrigger Delay, and Data Index, with multiple conditions use and Boolean operators.
Creating your first custom alerts
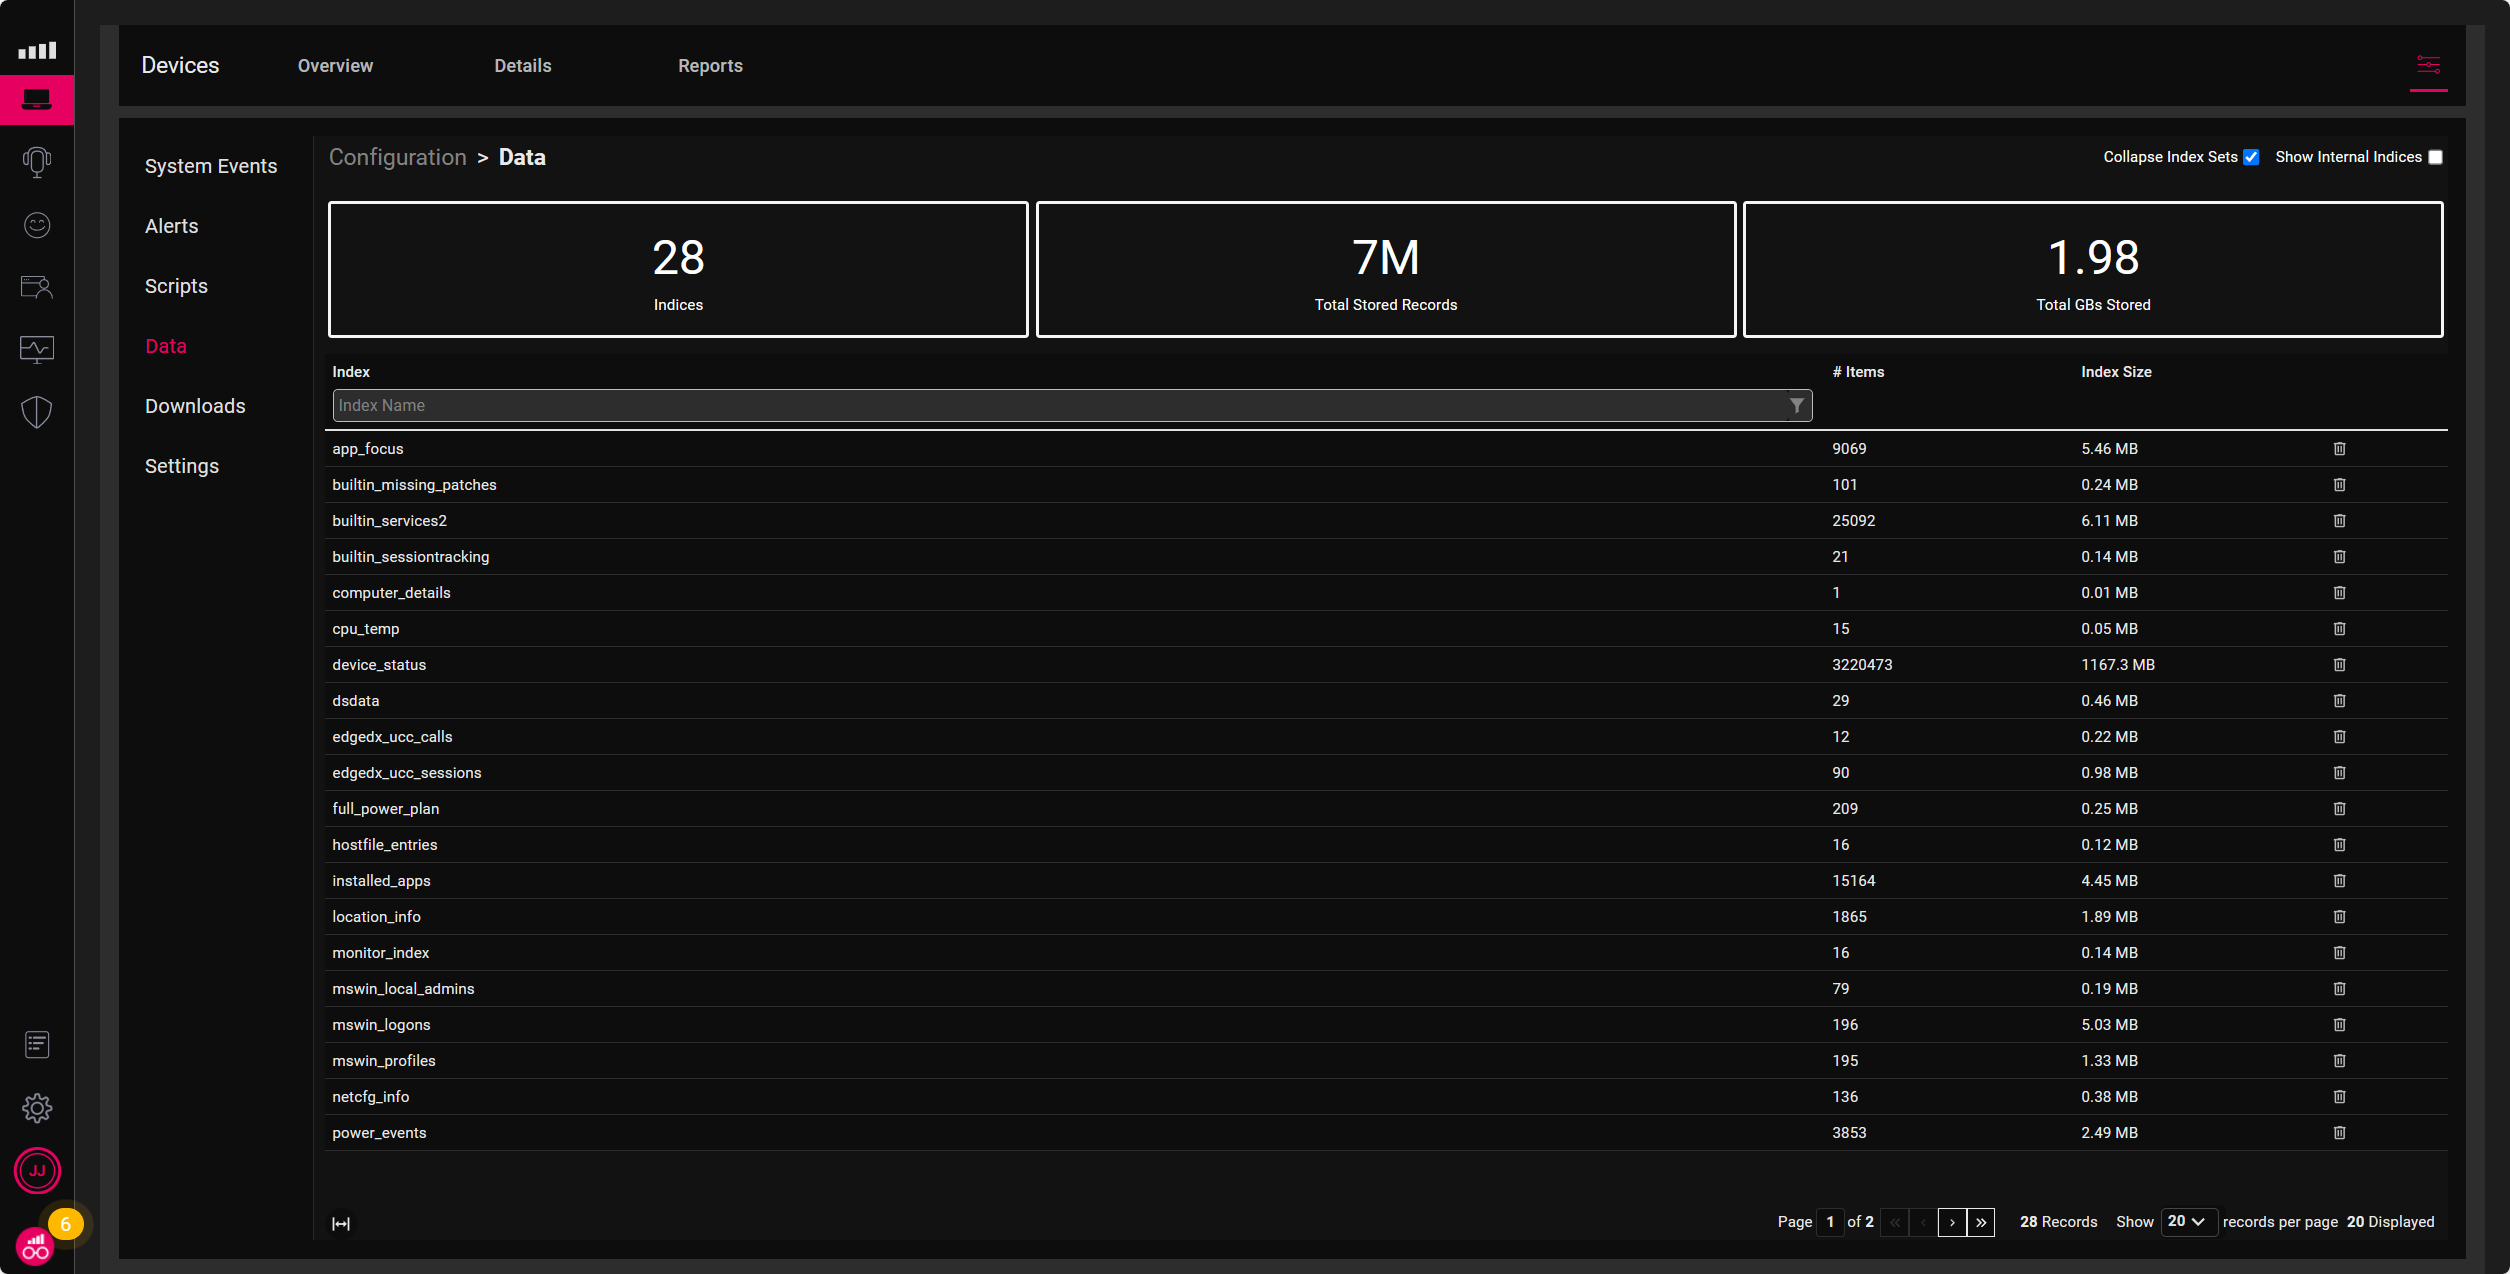
When creating a custom alert, you need to know the name of the database (index) and the condition name to configure a value. The database is available for browsing in Edge DX, and the naming convention is straightforward. For example, device_status has data such as cpuload, wifi_signal, and ping_avg. I first look in the database to understand where the data is and the metric used to measure it, such as whether it is in milliseconds or seconds. After examining the data, I set my condition, such as cpuload > 80.
Tom Fenton has a great blog that further explains our database structure called, “Building Custom Edge DX Dashboards Using Microsoft Excel & Power Query.”
Below are the default parameters when creating Edge DX alerts.
- Device Platform (Windows, macOS, Linux, All Platforms)
- Time Window (Default 600 seconds)
- Number of Hits (Default 5)
- Retrigger Delay (Default 3600)
- Data Index
- Condition
- Condition (optional)
- Condition (optional)
- Data Index
- Retrigger Delay (Default 3600)
- Number of Hits (Default 5)
- Time Window (Default 600 seconds)
The sample below is an alert for excessive CPU load. This alert is for Windows devices where the CPU is over 90%, five times in fifteen minutes.
- Device Platform = Windows
- Time Window = 900
- Number of Hits = 5
- Retrigger Delay = 3600
- Data Index = device_status
- Condition = cpuload > 80
- Data Index = device_status
- Retrigger Delay = 3600
- Number of Hits = 5
- Time Window = 900
Below are my favorite alerts to configure on new deployments. I have broken them down into Hardware, OS & Application alerts. The table below is a great starting point; however, you may want to tweak the values to fit your needs.
| Hardware | |
|
|
| OS & Application | |
|
|
Creating alerts is just the first step in improving the digital employee experience. Once you get a handle on what is causing the alerts, and how to fix them, we can automate the remediation of the alert. Please keep reading the blog series for a complete picture of improving DEX with ControlUp for Desktops.
More information on Edge DX alerting:
- Notifications and Alerting
- Raspberry Pi Integration for ControlUp Data Collection Demo
- Scripting Guide – Scripts & API
- Make Managing Physical Endpoints Easier with the ControlUp for Desktops Database
- Prevent Tickets: Low Wi-Fi Signal User Alerting
- Prevent Tickets: Automatically Reporting BSoD
- Desktop Support Problems – Part Two
Edge DX is a powerful troubleshooting and remediation tool that detects and fixes a desktop’s most complex issues. Being alerted to a problem is the first step toward remediation.
Improving the Digital Employee Experience blog series:
- Step One: Alerting
- Step Two: Troubleshooting
- Step Three: Remediating
- Step Four: Maintaining

Get help with alerts in the ControlUp Community.