
A company’s network is arguably one of its most crucial resources, and it’s important for mid and upper management to be familiar with the health of the network that its users rely on and to be able to spot trends that may affect them. Spotting trends early allows issues to be addressed before they affect users and will prevent unneeded tickets from being opened. Edge DX’s Network Performance dashboard (Figure 1) gives them a powerful tool to do just that.
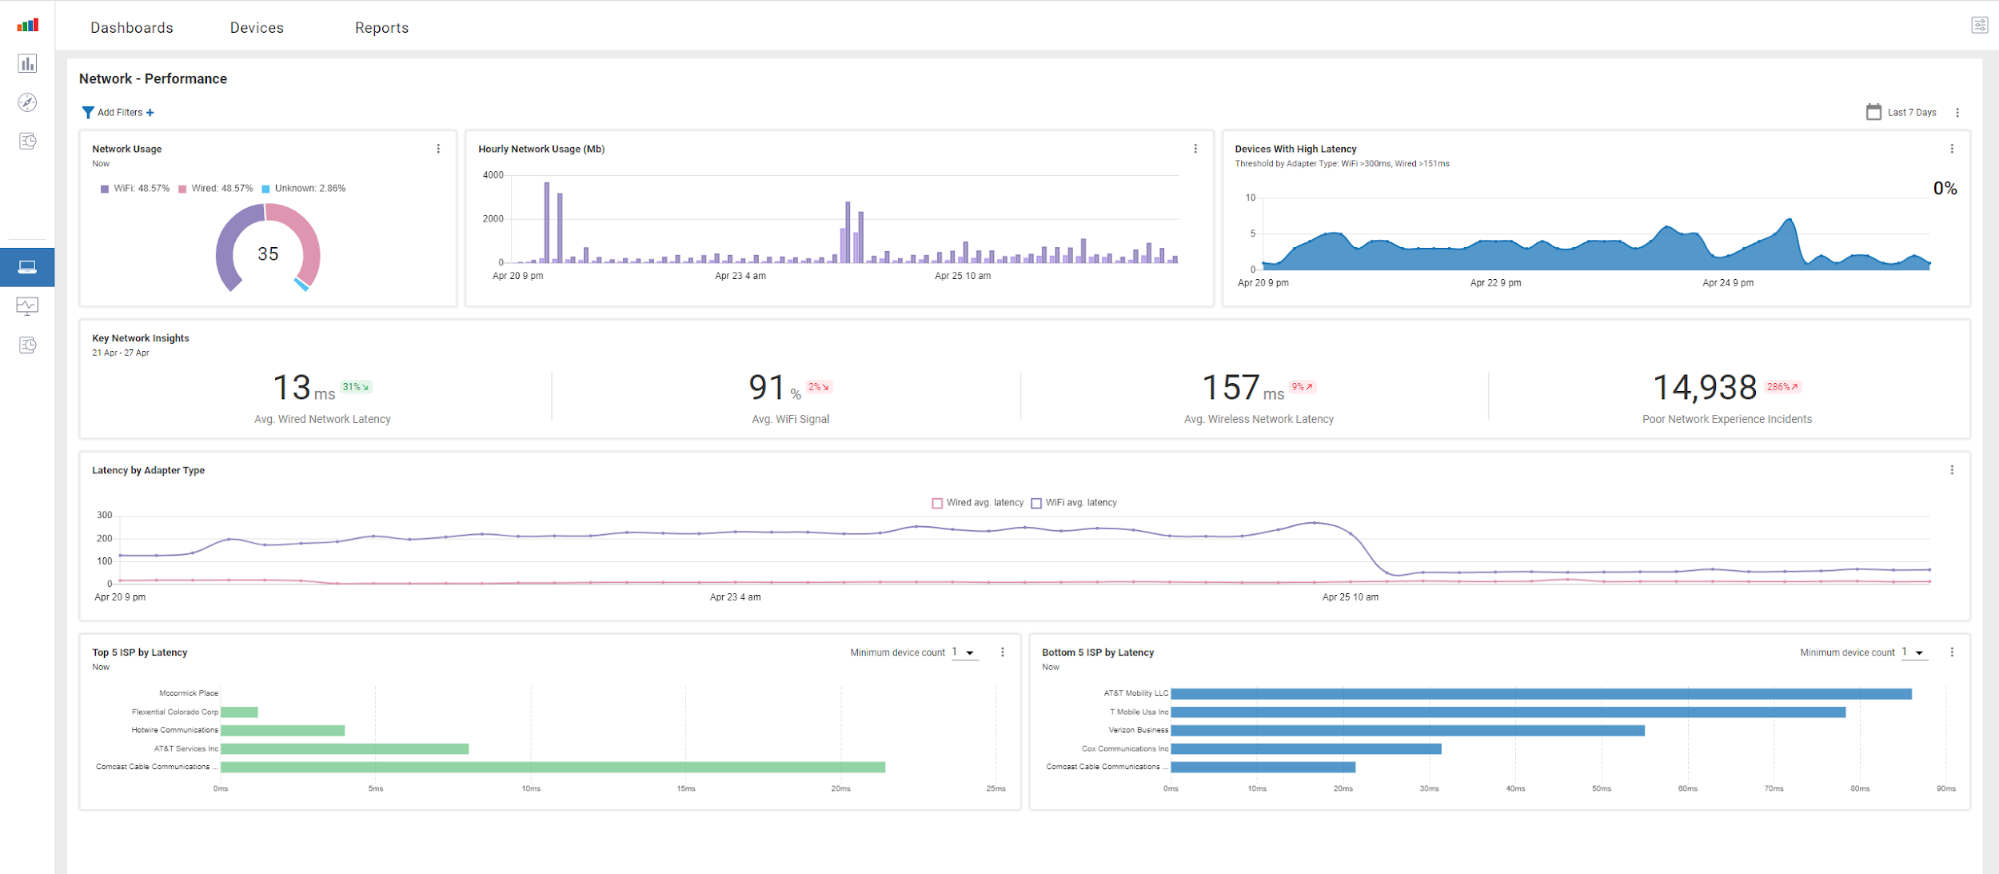
Figure 1: Network Performance Dashboard
This dashboard, like all other Edge DX dashboards, can be accessed from within the Dashboard tab.
This dashboard along with the Network Latency dashboard has widgets that track the latency from each device to a known network location. It then aggregates these results and displays this information by device ISP. It also displays the devices with the longest trace route and the overall Wi-Fi signals for the devices.
The network locations that the devices test against can be set by selecting Setting in the Configuration drop-down menu (Figure 2) and then opening the Network Latency tab. This allows each tenant to specify the locations that are most important to them.
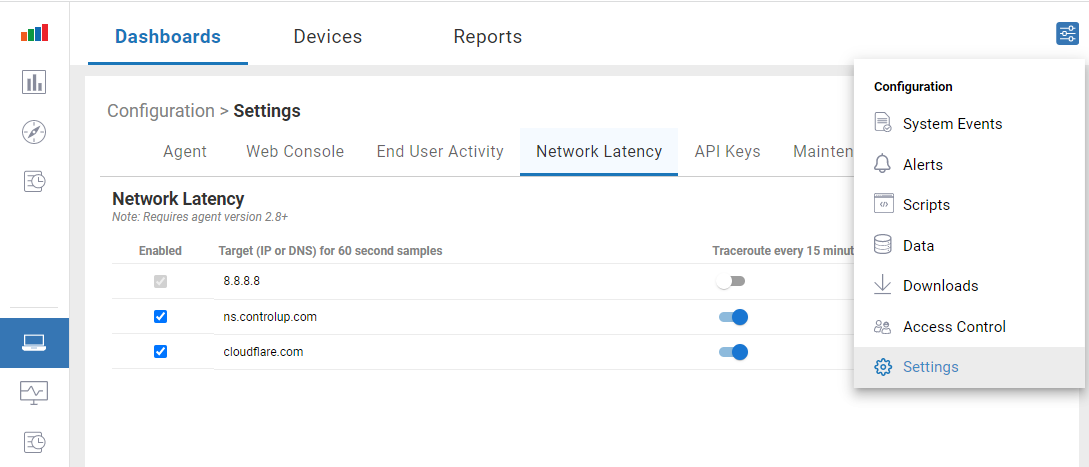
Figure 2: Settings
The dashboard is divided into four sections the top section has widgets that display what percentage of devices use wired or Wi-Fi, the hourly network usage and what percentage of devices are experiencing high latency. This is a good indicator of the overall health of the network and makes it easy to sport any catastrophic trends in the overall health of the networking.
The screen capture below (Figure 3) illustrates that in the Devices With High Latency widget the number, not the percent of devices with high latency is expressed on the bar graph, while the percentage is displayed as a numerical value in the upper right of the widget.
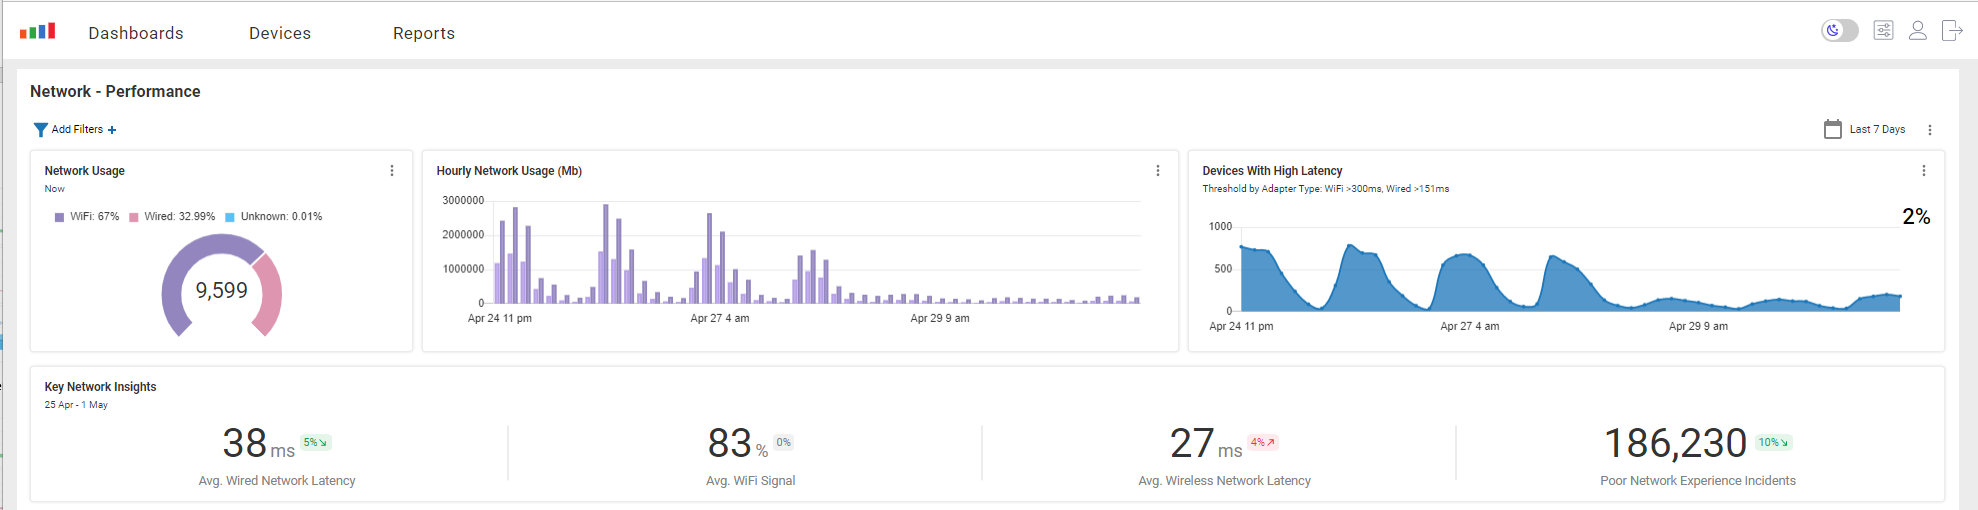
Figure 3: Devices with High Latency
The next row of widgets (see screen capture above) breaks the information of the row above it down into a more granular fashion to give deeper insights into the devise networking by showing the average Wi-Fi signal strength, wired and wireless latency and the number of poor network experience incidents.
The third row complements the second row of widgets by showing a graph of time of the wired and Wi-Fi latency (Figure 4) over time. This graph makes it easy to sport trends or anomalies in network connectivity.
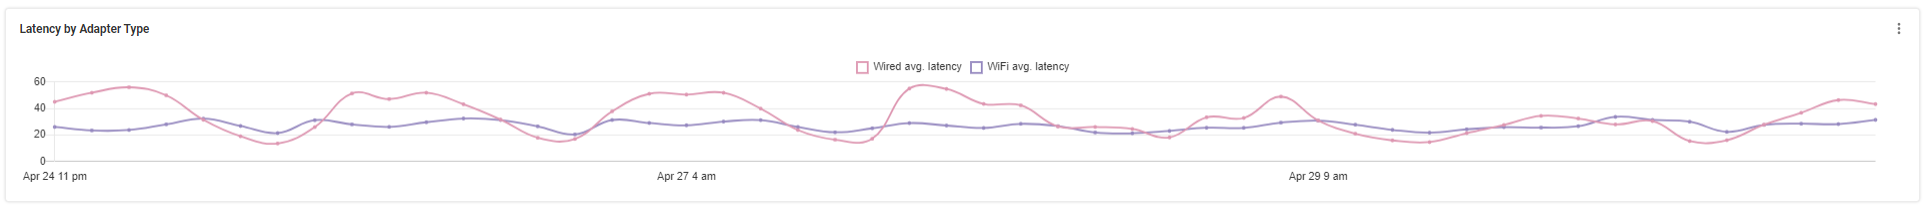
Figure 4: Wired vs. Wireless
The bottom row of data tracks aggregates and displays the latency by ISP. It shows the top and bottom five performing ISP’s (Figure 5). You can exclude ISP vendors with just a few devices by using the Minimum device count drop-down menu.

Figure 5: ISP Performance
Caution must be used with the ISP latency as some may be wireless and or satellite carries and will have greater latency than land based wired ISPs.
Because networking issues can greatly disrupt work, Edge DX’s Network Performance dashboard is an extremely useful tool to monitor aggregated networking information. To see a video of this in action, click here. For more information, be sure to visit our Edge DX page or schedule a demo with a ControlUp sales engineer.