
Recently, a system administrator (SA) new to Edge DX hit me with an interesting question: how can he tell if a Windows device used an SSD or HDD device? Edge DX collects many metrics, but the drive type is not one of them. But as Edge DX was designed to be an extensible platform, collecting this information is trivial and can be accomplished in many ways.
I will use this question as a jumping-off point to show you how the drive type can be collected depending on whether it is needed once for a single device, collected occasionally for a few different devices, or collected on all the devices in your organization regularly. I use the drive type only as an example, and the same methodology and techniques can be used to gather any other metric or information from your Windows, Linux, or macOS devices.
Manually, For a Few Devices
If this SA only needs to gather the information from a single device. In that case, the quickest way is to go to the device’s homepage in Edge DX, select Remote Shell from the Assist drop-down menu, enter PowerShell in the console, and enter Get-PhysicalDisk | Format-Table -AutoSize.
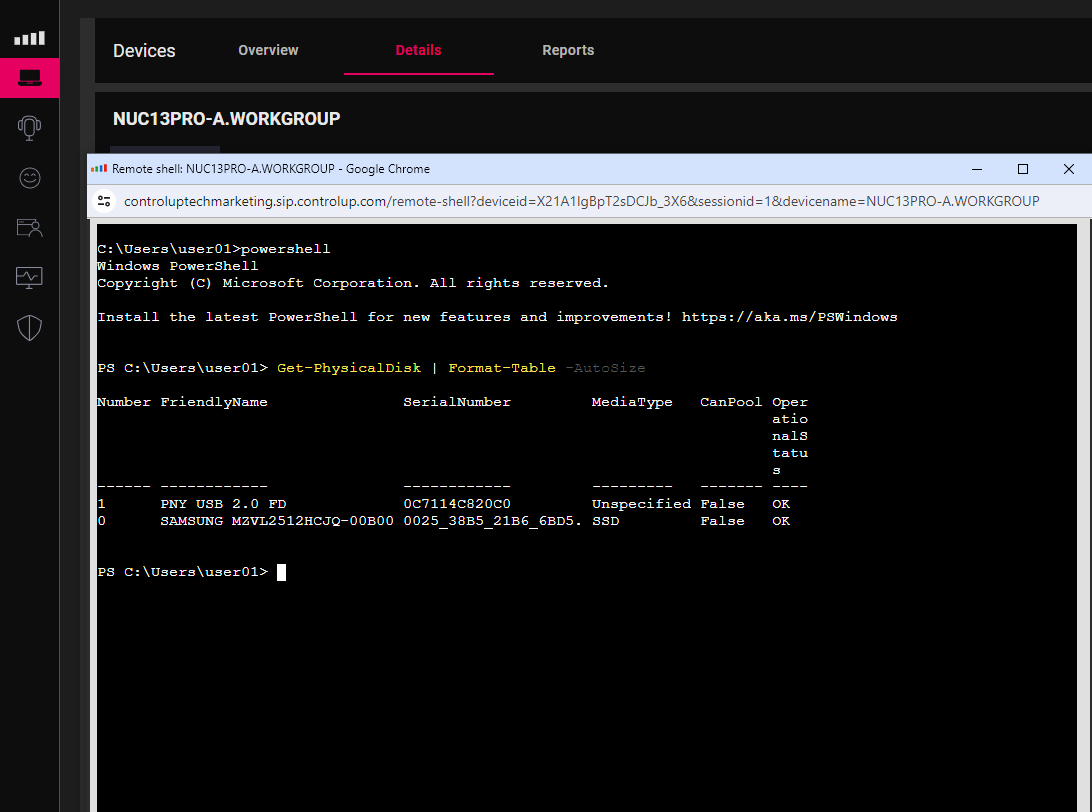
Figure 1 – Remote Shell Output
The output from this command shows that the device (NUC13PRO-A) has two disks. One is a USB drive with an unspecified media type, while the other is a Samsung SSD drive.
This is a quick way to gather information from a single device, but running this command on multiple devices would be time-consuming.
Semi-Manually, For Multiple Devices
If you need to gather additional information on a few select devices on an ad-hoc basis, creating a script and selecting the devices to run it on would be best.
To create the script, click the Configuration icon in the upper right of the dashboard. From this page, select Scripts from the navigation pane. Select Add Script. Enter a name for the script in the Name text box (i.e., Win_Disk_Info). In the Content text box, enter the command you want to run. Set the Platform and Language fields and select Custom Action- System from the Trigger drop-down menu. Click Create Script.
Below is the script I used to gather and display the information.
[Console]::OutputEncoding = [System.Text.Encoding]::UTF8 # This line is added automatically to help with Unicode characters. Please add your code below
$reults=Get-PhysicalDisk | Format-Table -AutoSize
## Write-Output "### SIP EVENT BEGINS ###"
## Write-Output  $results
## Write-Output "### SIP EVENT ENDS ###"
[array]$arrSysInfo = @()
$arrSysInfo  =   Get-PhysicalDisk | select MediaType, OperationalStatus, Size, FriendlyName, Manufacture, Model | Format-list
Write-Output("### SIP EVENT BEGINS ###")
Write-Output $arrSysInfo
Write-Output("### SIP EVENT ENDS ###")
To see more information about using scripts in Edge DX, visit https://support.controlup.com/docs/scripting-guide.
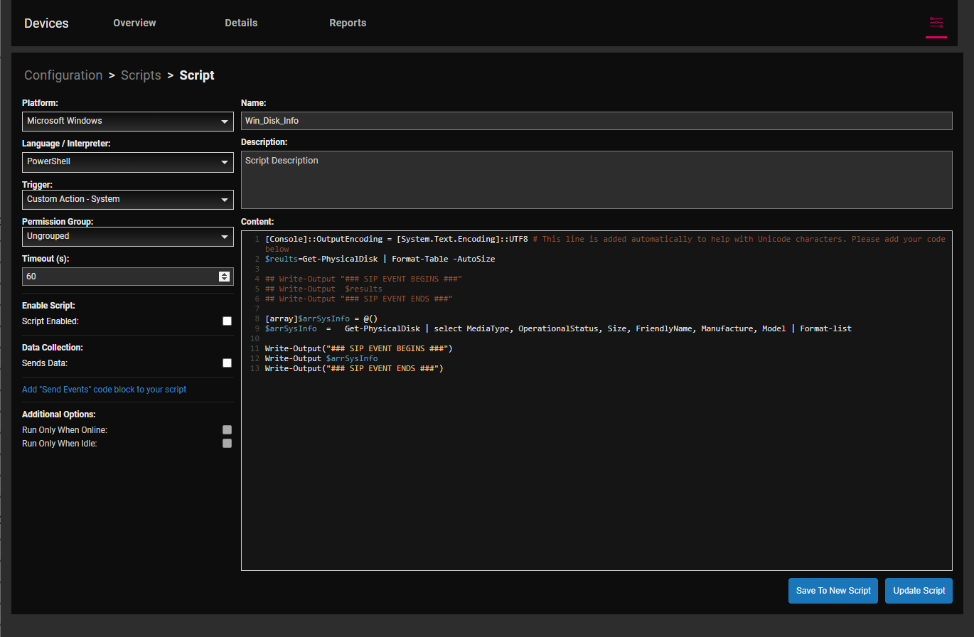
Figure 2 – Script Creation
To run the script, go to the device’s home page and select the script from the Actions drop-down menu.
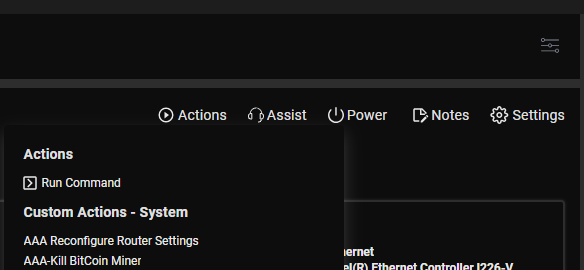
Figure 3 – Running a Script
To see the collected information, go to a device’s home page and click the Device Events tab.
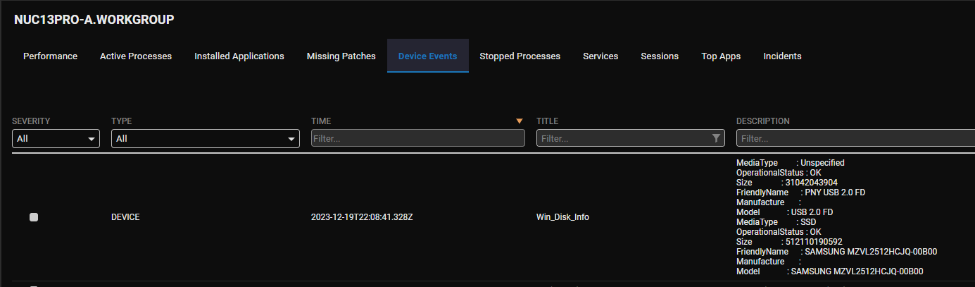
Figure 4 – Script Output
To run the script on multiple devices simultaneously, go to the Details home page and use filters only to show online Windows devices.
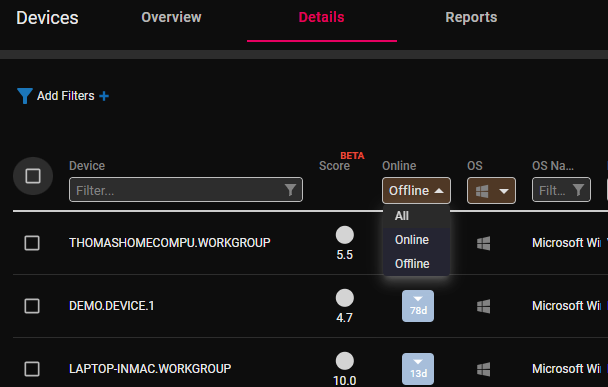
Figure 5 – Filtering Devices
You can then use the checkbox on the top row of the device to specify if you want to run the script on all the devices on that page, all those that have been filtered on. You can also manually select the devices you want to run it on. I chose Select all filtered rows to run it on all the filtered devices.
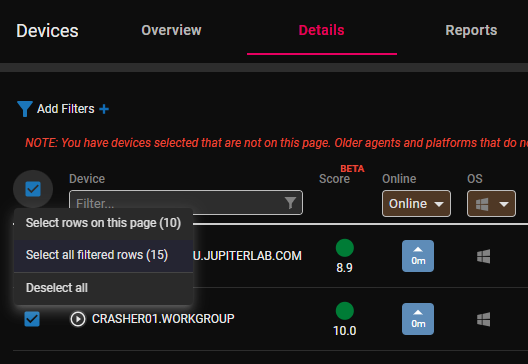
Figure 6 – Filtering Data
From the Actions (right arrow in a circle) drop-down menu, select the script you want to run (i.e., Win_Disk_Info.)
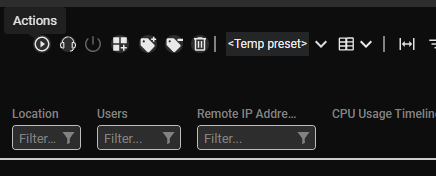
Figure 7 – Actions Icon
This will execute the script on all the devices that were selected.
To see the results from an individual device, you can go to its home page and see the information using the above procedure.
To see the output from all the devices, go to the Configuration page and select System Events. If other events are interspersed in the events, you can filter on the script using the Title column.
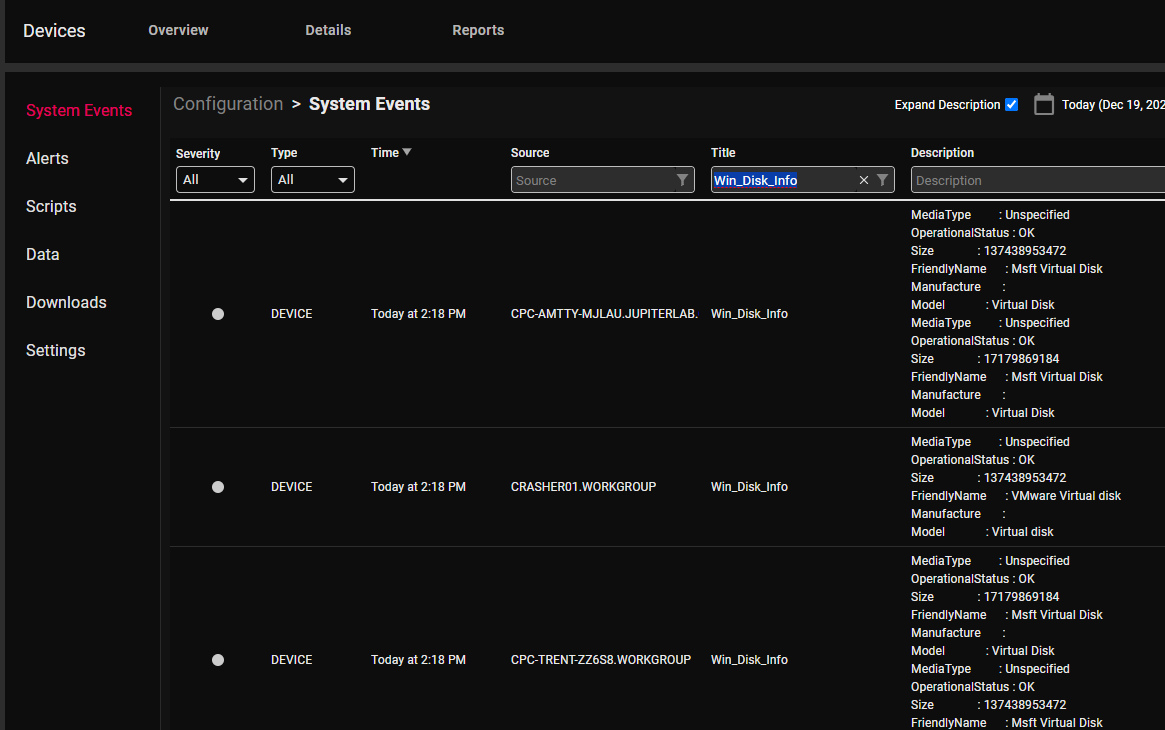
Figure 8 – Data from Multiple Devices
Select Export to CSV to do further work with this output. If you export the output, make sure that you use filters to export the needed information.
This is a great way to gather information that is only needed occasionally. There are occasions when you want to capture the information regularly to see the latest information or to detect changes in systems; this is where Edge DX shows its power.
Persistent Data Collection
To keep track of the latest device changes, you can use Edge DX’s powerful and open database!
You can modify the script to collect the data and write it to a data index by converting it to JSON and including the SIP DATA stanza. This is shown below. Leaving the SIP EVENT stanza in it will write it as a device event; this may be useful, but this is not required.
[Console]::OutputEncoding = [System.Text.Encoding]::UTF8 # This line is added automatically to help with Unicode characters. Please add your code below
$reults=Get-PhysicalDisk | Format-Table -AutoSize
## Write-Output "### SIP EVENT BEGINS ###"
## Write-Output  $results
## Write-Output "### SIP EVENT ENDS ###"
[array]$arrSysInfo = @()
$arrSysInfo  =   Get-PhysicalDisk | select MediaType, OperationalStatus, Size, FriendlyName, Manufacture, Model
Write-Output("### SIP DATA BEGINS ###")
Write-Output $arrSysInfo | ConvertTo-JSON
Write-Output("### SIP DATA ENDS ###")
Write-Output("### SIP EVENT BEGINS ###")
Write-Output $arrSysInfo | ConvertTo-JSON
Write-Output("### SIP EVENT ENDS ###")
Selecting the Sends Data checkbox and entering a name for the data index (i.e., Win_Disk_Information) will automatically create and write the JSON data from the SIP DATA stanza.
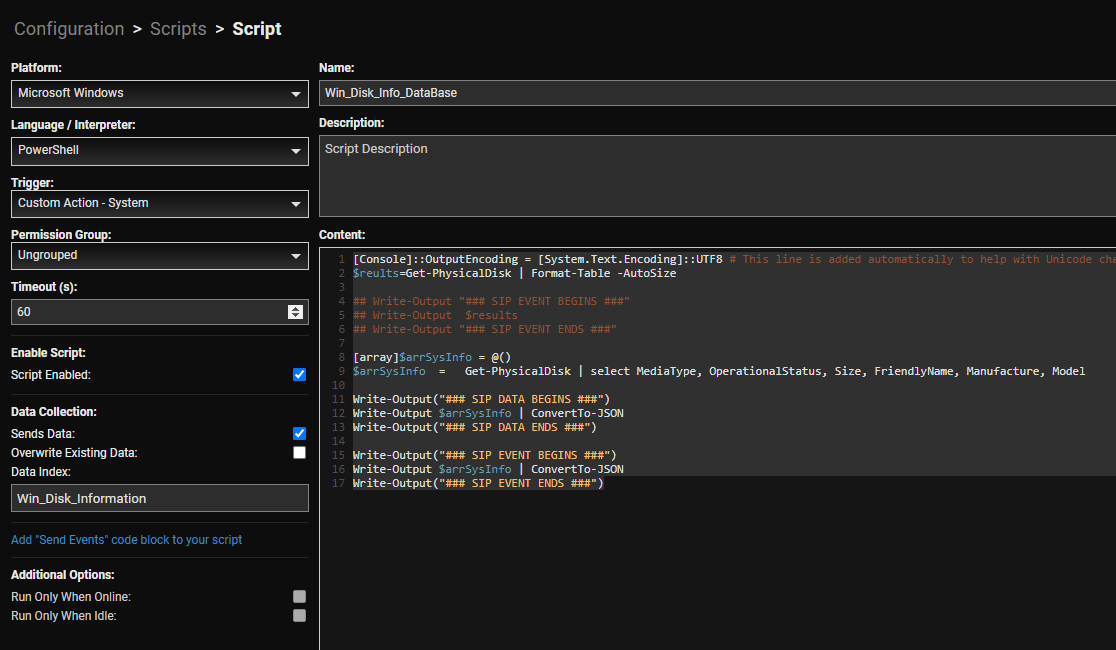
Figure 9 – Writing to a Data Index
If the trigger is set to Custom Action – System, you can run it as you did before on one or multiple devices from the Actions drop-down menu.
Once the script has been run, you will see the information stored in the data index by selecting the Configuration page and selecting Data from the navigation pane.
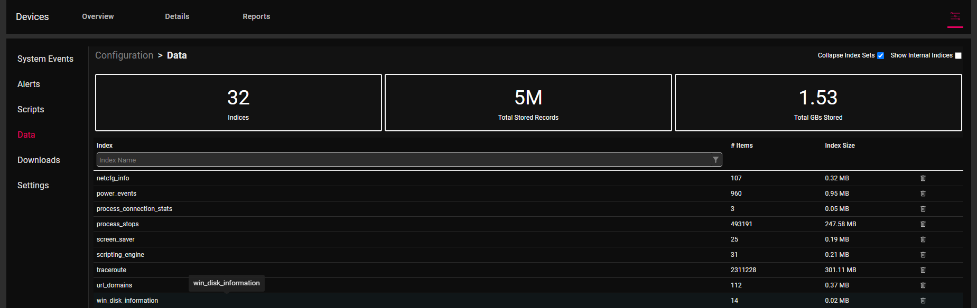
Figure 10 – Data Indexes
Selecting the data index that you specified when the script was created will display all the values it collected and information about the device it was collected on.
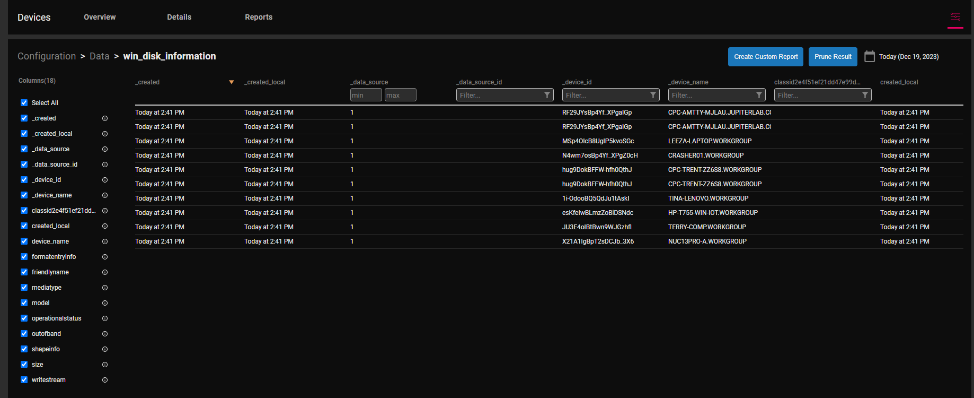
Figure 11 – Collected Data
You can select the columns you want to display in the left-hand column.
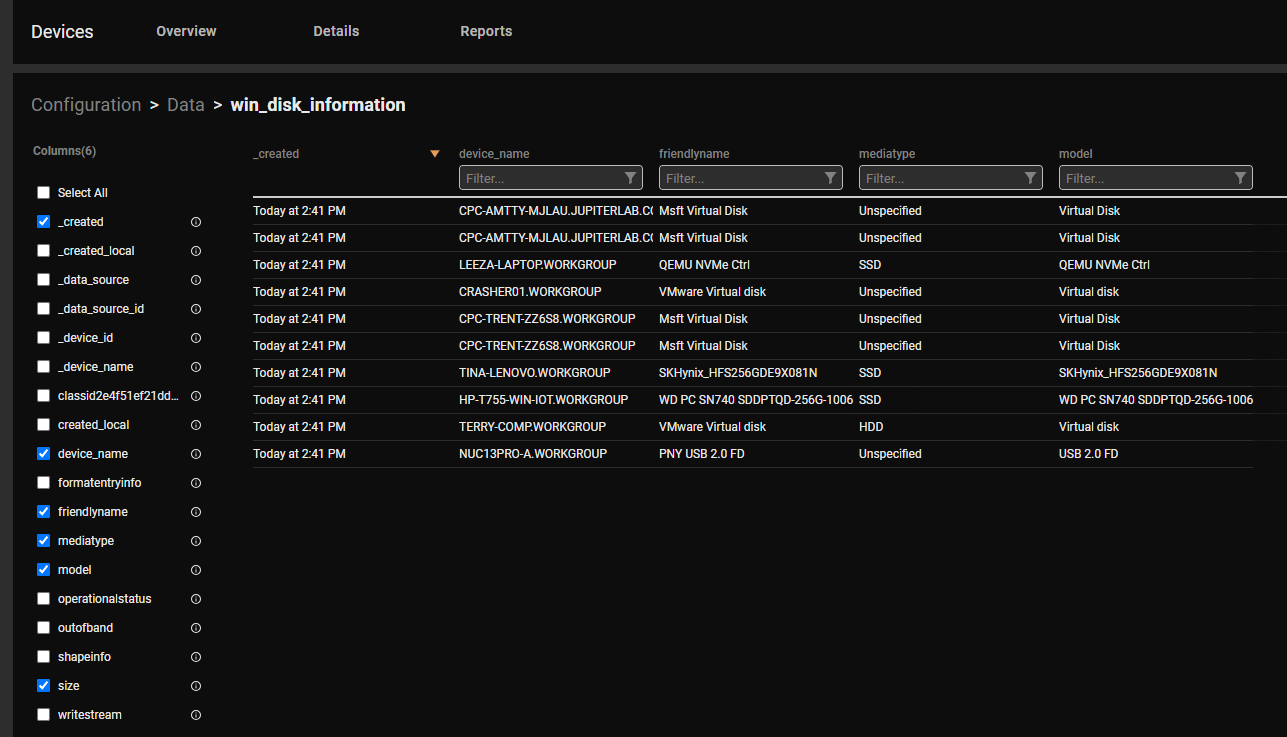
Figure 12 – Curated Data
Custom Reports
Once you have displayed the data, select Create Custom Report if you want to access the information regularly.
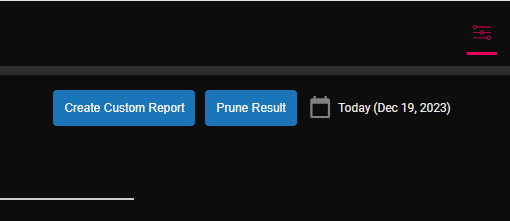
Figure 13 _Create Custom Report.
Put the values you want in the pop-up Wizard, click the Publish checkbox, and click Create.
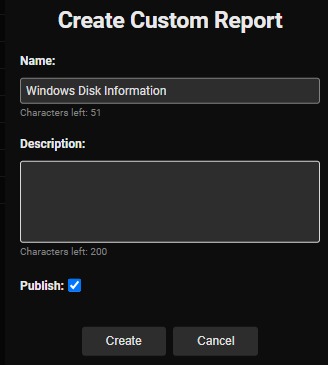
Figure 14- Publish Custom Report
The report can be viewed by selecting the Reports tab. I like using the table view (set in the upper right corner) and using the Name filter box to find my reports.
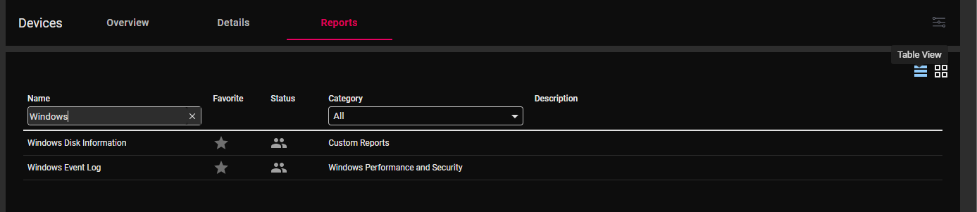
Figure 15 – Custom Reports
Once a report is displayed, it can be edited, exported as a CSV file, deleted, or filtered to show only the required information.
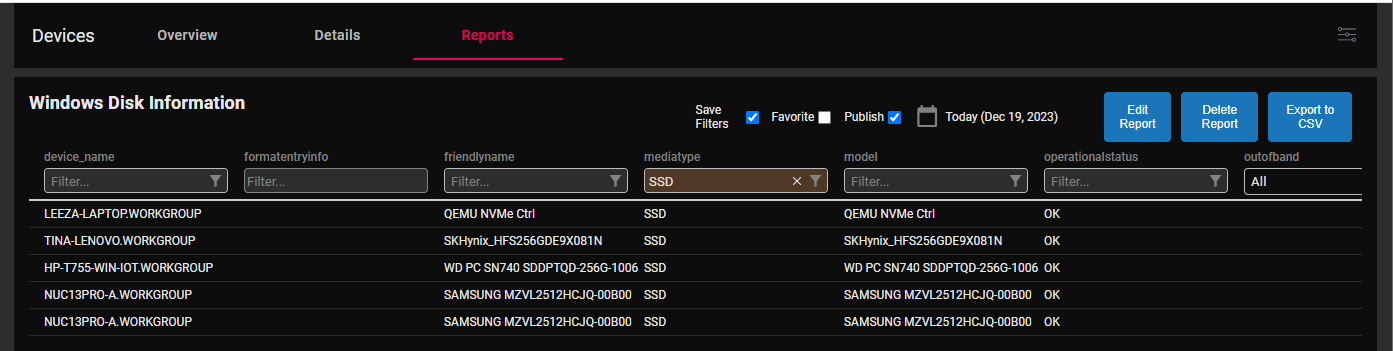
Figure 16 – Filtered Report
Automated Data Collection
So far, we have covered collecting data as needed. Still, you can also automatically collect data on a schedule when a device is powered on (SIP Service Start), when a user logs on, or when another event occurs.
To do this, edit the script and select the Trigger you want to set off the script. I decided to have this script run Once a day. Make sure to click Update Script once you have changed the trigger.
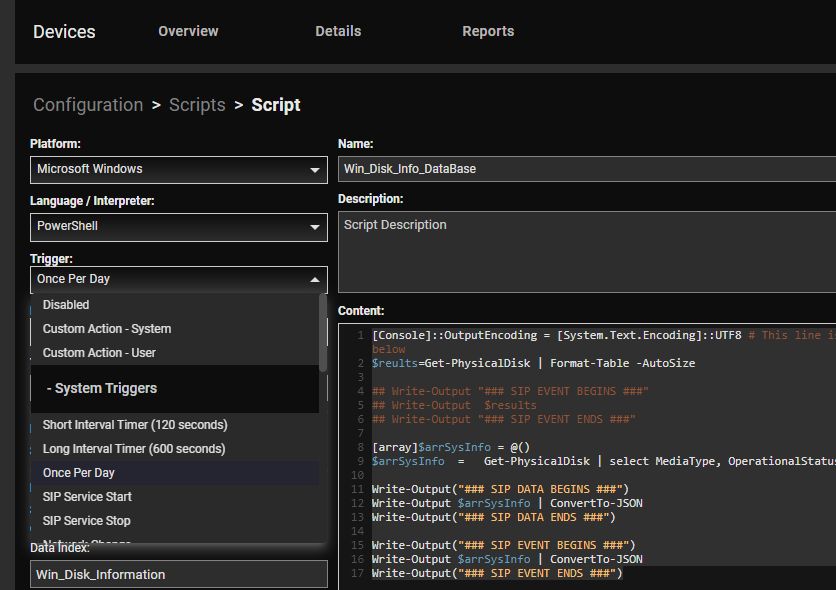
Figure 17 – Other Triggers
You can now view this information from your Custom Report.
Although Edge DX collects the information most users need, it also enables the collection of additional information and allows users to display information in ways limited only by their imagination. The information included in this article should help you decide which method is best for your situation.
If you currently use ControlUp for Desktops, you can cut and paste the script in this blog into your environment. If you are not yet on Edge DX, you can visit this web page for more information, to start a free trial, or to book a demo of it or any other of ControlUp’s award-winning products.