Solve Problems Faster with Edge DX and 10ZiG!
ControlUp is excited to announce that Edge DX now supports thin clients running 10ZiG PeakOS! This partnership will provide 10ZiG’s customers with unprecedented insights into their endpoint devices so problems can be identified quicker and solved faster.
10ZiG is a long-time and much-respected player in the thin client marketplace, with millions of devices deployed worldwide. It is one, if not the only, thin client company that supplies both thin client hardware and software. That said, its thin client software, PeakOS, can also be deployed on other hardware, allowing its customers to repurpose older or outdated PCs, laptops, and other x86 hardware. This short blog is geared towards existing PeakOS customers to demonstrate how Edge DX complements it.
Introduction to Edge DX
Edge DX is a SaaS-based solution accessed via a web browser (Figure 1). It helps IT teams lower costs associated with supporting physical devices by quickly finding, fixing, or preventing issues that traditional device management software solutions can’t. Edge DX is a fully-managed, cloud-based solution that lets you see time-to-value immediately, with worldwide coverage, unlimited scalability, and end-to-end security.
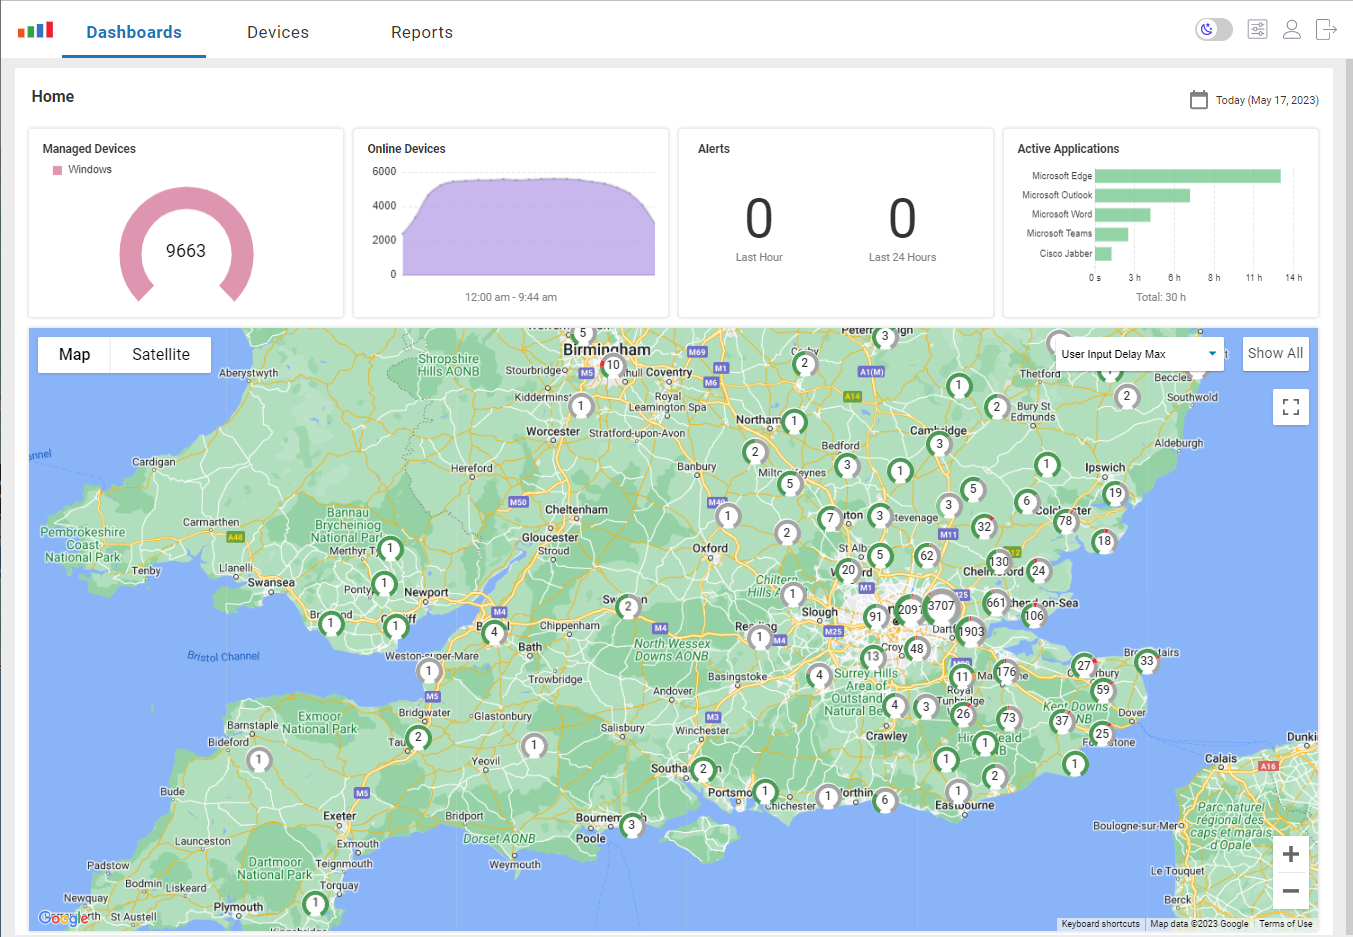 Figure 1: Edge DX Dashboard
As Edge DX is SaaS-based, it only requires a quick call to ControlUp Sales to set up the tenant, followed by installing a lightweight agent on the devices you want to monitor. Using Edge DX dashboards and reports, you can identify actual or potential problems so that they can be remedied automatically via triggers and actions (Figure 2) or alternatively by manually running self-created scripts or ones from our community script library.
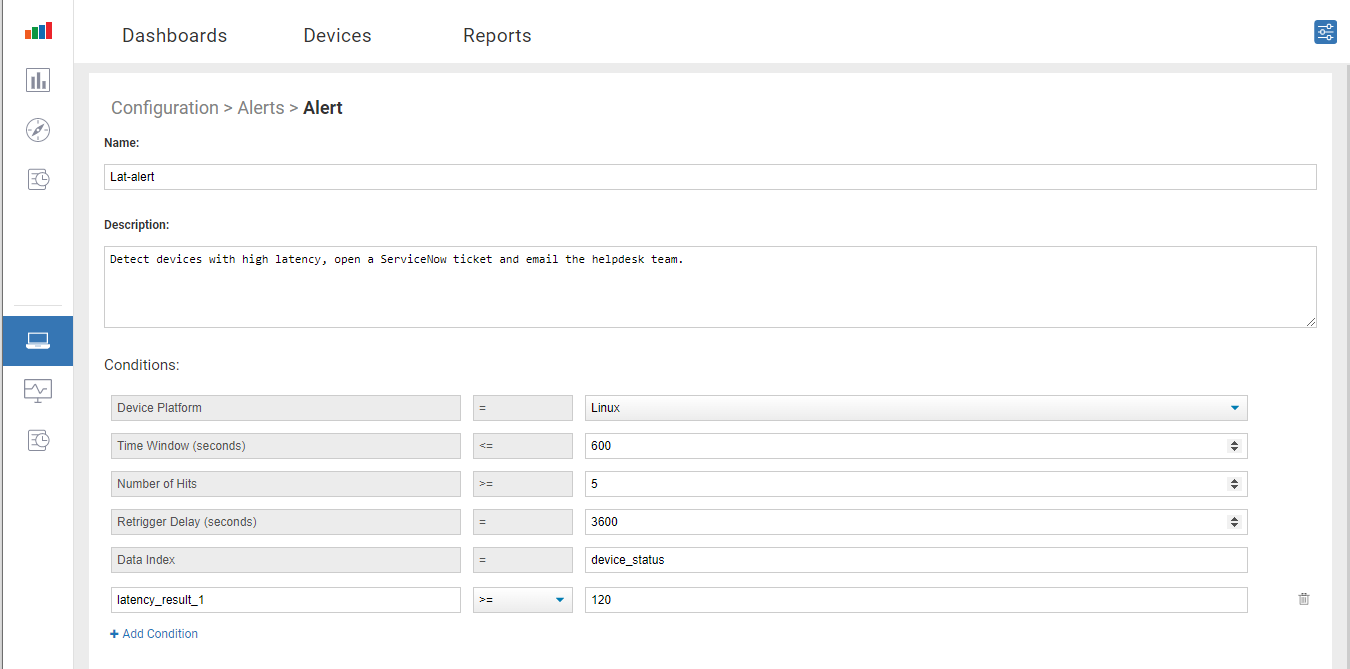
Figure 2: Edge DX Alerts
Some problems need more in-depth investigation, or users must show IT what they are experiencing. Edge DX allows IT professionals to remotely control or shadow desktops (Figure 3) to help solve these types of problems quickly and efficiently.

Figure 3: Remote Control Session
Other problems can be solved by running a few commands on the device’s command line. For these problems, Edge DX can establish a remote shell connection (Figure 4) to devices running PeakOS.

Figure 4: Remote Shell
For mass healing, scripts can be simultaneously initiated on multiple devices (Figure 5).
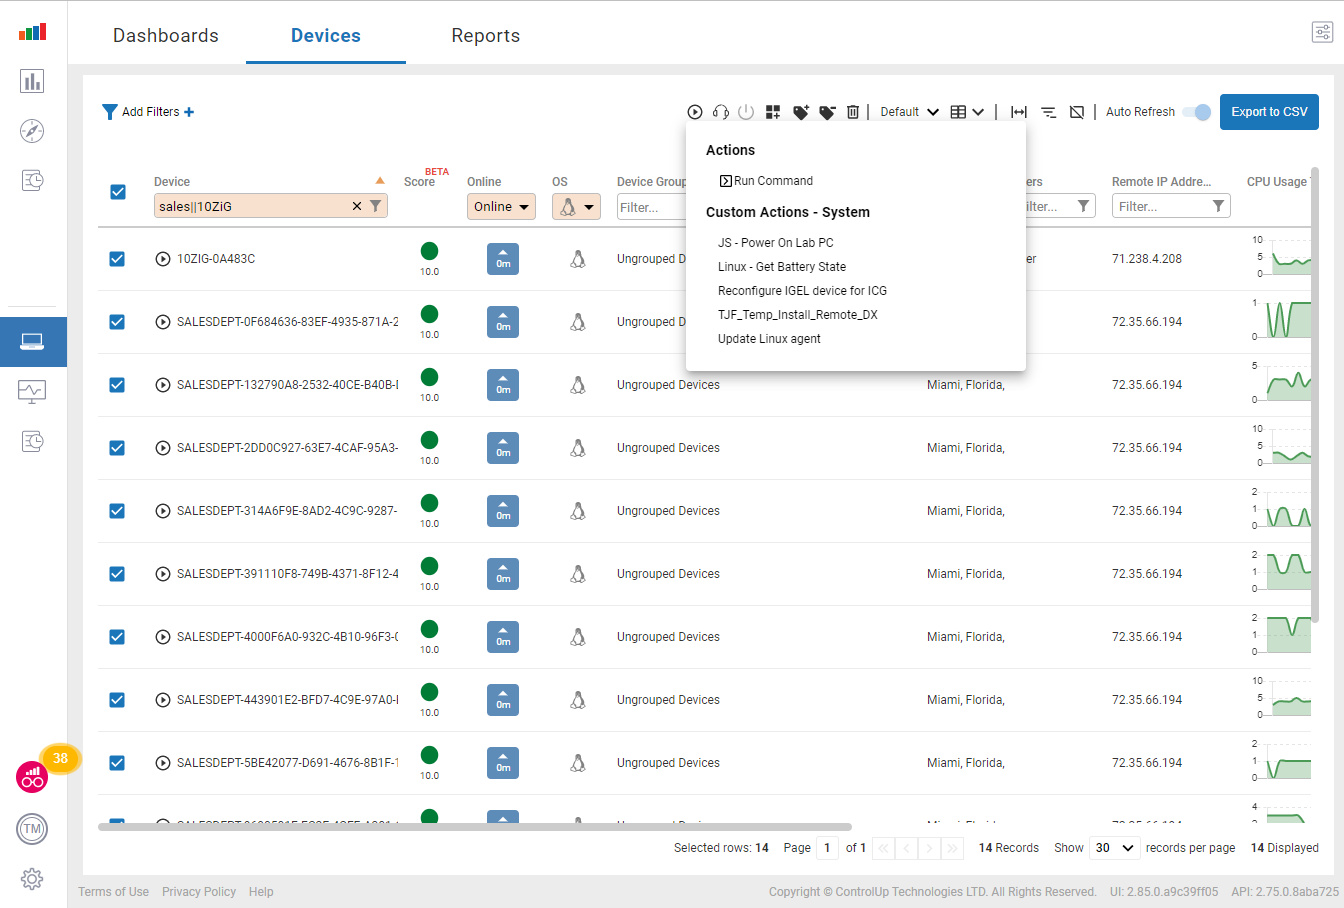
Figure 5: Mass-healing
Monitoring and Gathering Information Using Edge DX
PeakOS is a highly-performant, bespoken OS explicitly designed for thin clients. Companies have been trusting it for business-critical workloads for decades. However, as is true with all IT products, they do need to be monitored and observed. Edge DX’s intuitive web-based dashboard makes it easy to spot anomalies, while its powerful, leading-edge database stores historical data to make it easy to spot trends.
The top of the device’s dashboard (Figure 6) shows persistent information (e.g., OS, hardware, networking, uptime, etc.) about the device, while the lower portion shows its key performance metrics.

Figure 6: Devices Dashboard
The metric widgets display more information (Figure 7) if they are hovered over or clicked.

Figure 7: Metric Widgets
From this page, you can also find other information, such as device events, which services are running, and which processes are consuming the most CPU cycles or memory (Figure 8). You can even kill a process from this dashboard.
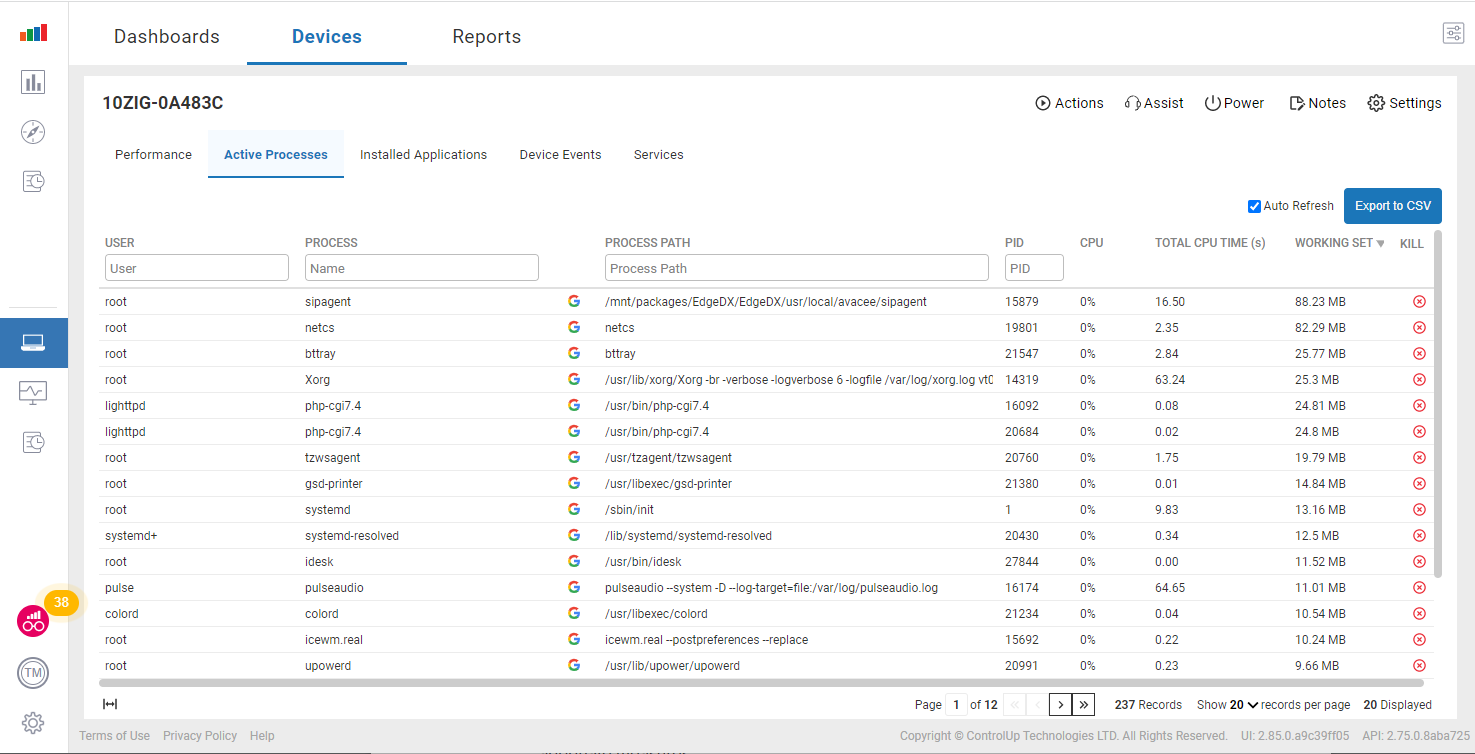
Figure 8: Active Processes
Being able to get actionable real-time information is critical for help desk professionals. Still, IT managers need aggregated information to see the big picture, spot trends, and forecast future events, such as hardware refreshes when devices become obsolete or can no longer meet the workload requirements.
Device data is stored on a high-performance cloud-based database, and reports can be generated from it to answer such questions. Dozens of pre-defined reports are available (Figure 9), or custom reports can be generated.

Figure 9: Predefined Reports
Data indexes (Figure 10) can be viewed from the Edge DX portal. You can create new data indexes to store additional device information if needed.

Figure 10:Device Indexes
In this blog, I have demonstrated the power that Edge DX can bring to devices running PeakOS. I have shown how Edge DX can monitor devices and remediate issues when they are encountered. Edge DX makes it possible to solve problems faster and have fewer tickets opened.
Edge DX monitors millions of devices and has virtually unlimited scalability – we have customers monitoring as few as 50 devices while other customers monitor over a hundred thousand.
For more information, be sure to visit our Edge DX page or schedule a demo with a ControlUp sales engineer.