
Let’s face it: analyzing Blue Screen of Deaths (BSOD) is a painful experience. However, ControlUp just released a way that makes it less so. And the best part is that it is absolutely, positively 100% free!
A while ago, I wrote a blog post that showed how to report when a system had experienced a BSOD automatically using ControlUp for Desktops but I did not discuss the more arduous task of analyzing it. Fortunately, some clever folks (shout out to Guy Leach, Bill Powell, Matt Pinnell, and others at ControlUp) put their heads together and created a script to analyze them automatically. This will save you a lot of time when dealing with this challenging task.
How the Script Works
When the script is executed it look for any BSOD kernel crash dumps created in the past seven days. If it finds any it will download Nirsoft’s bluescreenview to a temporary folder on the device and then uses it to perform an analysis of any of them. It then creates a table with information about the BSOD in it. This includes the dump filename, the date/time of the crash, the details of the driver or module that possibly caused the crash (filename, product name, file description, and file version), and other information.
This program works with most modern versions of Windows desktops and Server OS, but you must ensure your system is configured to take dumps. You can follow Nifsoft’s instructions or see my article on how to do this.
Getting the Script
Edge DX is a powerful framework for monitoring, troubleshooting, and remediating issues on Windows, macOS, Linux, and thin clients using a library of pre- and user-created scripts. The BSOD detection is a pre-created script that can be freely downloaded from ControlUp’s Edge DX script library.
To download and install the script, select Configuration on the Edge DX dashboard, select Scripts, then Select Script Library. From the Choose a script to import list, click Analyze BSOD minidumps and then Import Script.

Run the Script Automatically
To get the most from the script, you should configure it to automatically check if a BSOD has occurred every time the system boots up.
To do this, when you install the script, verify that the Platform is set to Windows, the Language to PowerShell, and then, from the Trigger drop-down menu, select SIP Service Start and click Sends Data and enter something like a2_bsod_minidump in the data_index text box.

BSOD Data
After the script runs, information about the dump can be seen by clicking the Device Events tab. If it has been a while since the dump was taken, it may not appear on the first page of events. To help locate it, you can enter BSO in the Title column to filter on them.

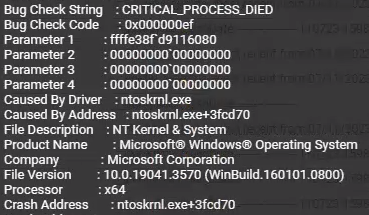
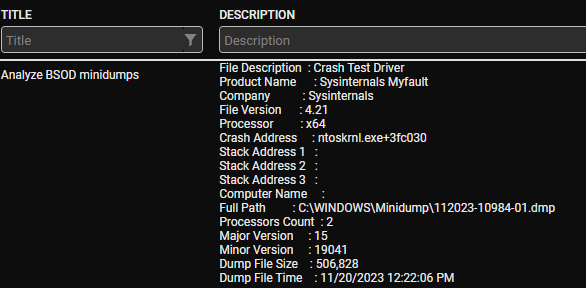
When you point at the Description column of the dump, it will show critical information about it.

I have found that the most useful information are in the Caused By Driver and Caused By Address fields.
BSOD Workflows
You can use many different workflows to identify when a BSOD has taken place. The one that have I found the most useful is Edge DX’s BSOD report which identifies which devices have experienced a BSOD. To access it, click the Reports tab and then click Top Devices with Blue Screen Events.

This report will show the devices that have experienced BSOD. The time frame to search for BSOD is set in the upper right.
Below is a screenshot of a report that shows that two different devices have experienced BSODs in the last month.

By clicking on the name of the device, you will be brought to the device’s dashboard, where you can navigate to see information about the dump.
Examples of BSOD
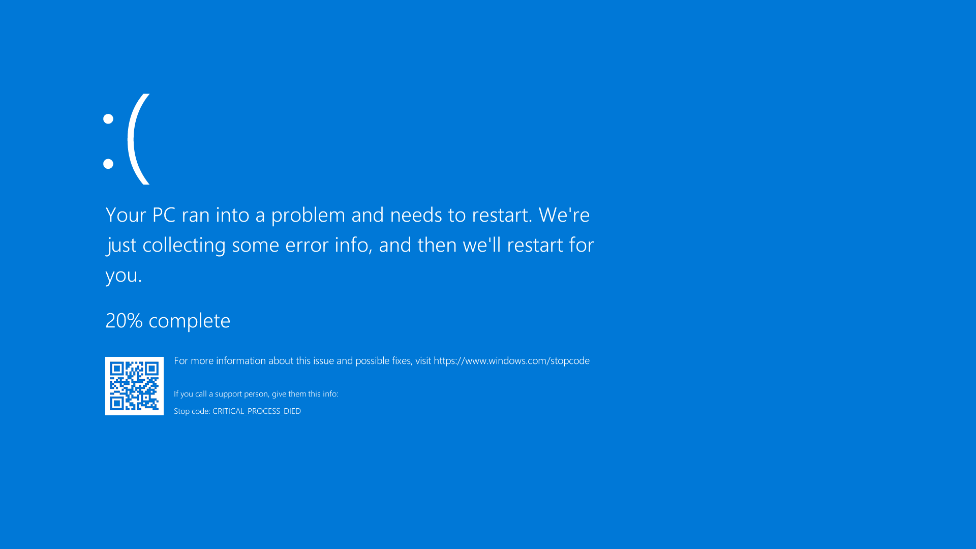
Below are a few examples of BSOD’s.
In this case, the system crashed with a code overwrite as indicated by the message PAGE_FAULT_IN_NONPAGED_AREA.

I caused a BSOD that was caused by “stack trash” by running SysInternals NotMyFault program. The File Description shows that the crash was caused by the Crash Test Driver.
Trending and Correlating Historical Crash Data
If you created a data index to save information about crashes, you can use it to see historical information about the crashes on your systems. Using this information, you can spot trends and correlate information with other events and information to gain additional insights and understanding to what is happening in your environment.
To access it select Data on the Configuration page.
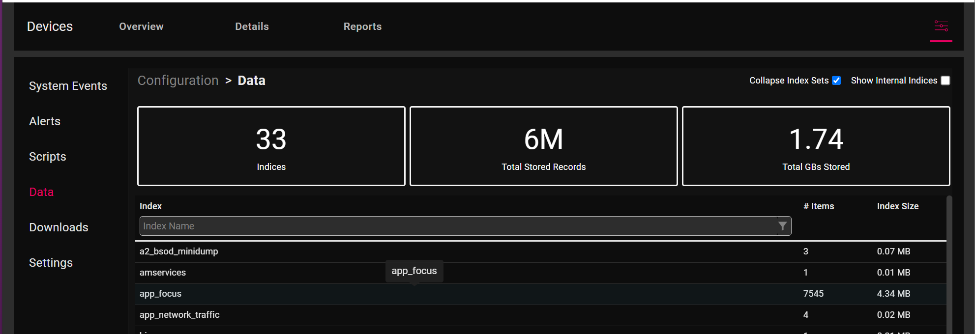
Then select the crashes data index (i.e., a2_based_minidump). In the left hand you can select the data index fields that you would like to display.

If you would like to access this information repeatedly you can select Create Custom Report. This report can be accessed by selecting the Reports tab.
How You Can Get This Powerful Troubleshooting Tool for Free
If you already have Edge DX, the Analyze BSOD minidumps script can be downloaded and installed for free, just like any of our other scripts. If you have yet to install Edge DX, you can get our 50-user VIP pack for FREE by clicking this link!

Detecting and analyzing BSODs is a difficult but essential part of any good system administrator’s job. I am glad to see that we made it a hell of a lot easier with our Analyze BSOD minidumps script! Enjoy!