Go for the Gold: Ensure Flawless VDI Availability with ControlUp Synthetic Monitoring

What do you strive to provide your users? Nothing but the best, I’d assume. But things happen, often when you least expect them.

Do you have 24/7 monitoring of your virtual desktops and other user resources? What happens when an unexpected update freezes user sessions, or a critical web page suddenly takes longer to load or fails altogether? Will you know about it? Can you resolve it before widespread issues occur?

Enter ControlUp Synthetic Monitoring.

Based on our decades of experience in monitoring user experience and availability of ‘end-to-end’ resources, ControlUp’s Synthetic Monitoring module allows you to monitor the health of individual resources (like a web page or a server) and excels at monitoring virtual desktop platforms. From login to the platform, verifying the resources your users need are represented as available for them to launch, to verify the user gets the resource with the look and feel they expect.

I  could go on and on about how we do it, but what’s more interesting is when we catch issues that would have prevented users from doing their work.

The following is a showcase of things you do NOT want your users to see, and if they were to happen, you want to know about it first. ControlUp will help you with that!

Examples of Failure Detection with ControlUp Synthetic monitoring

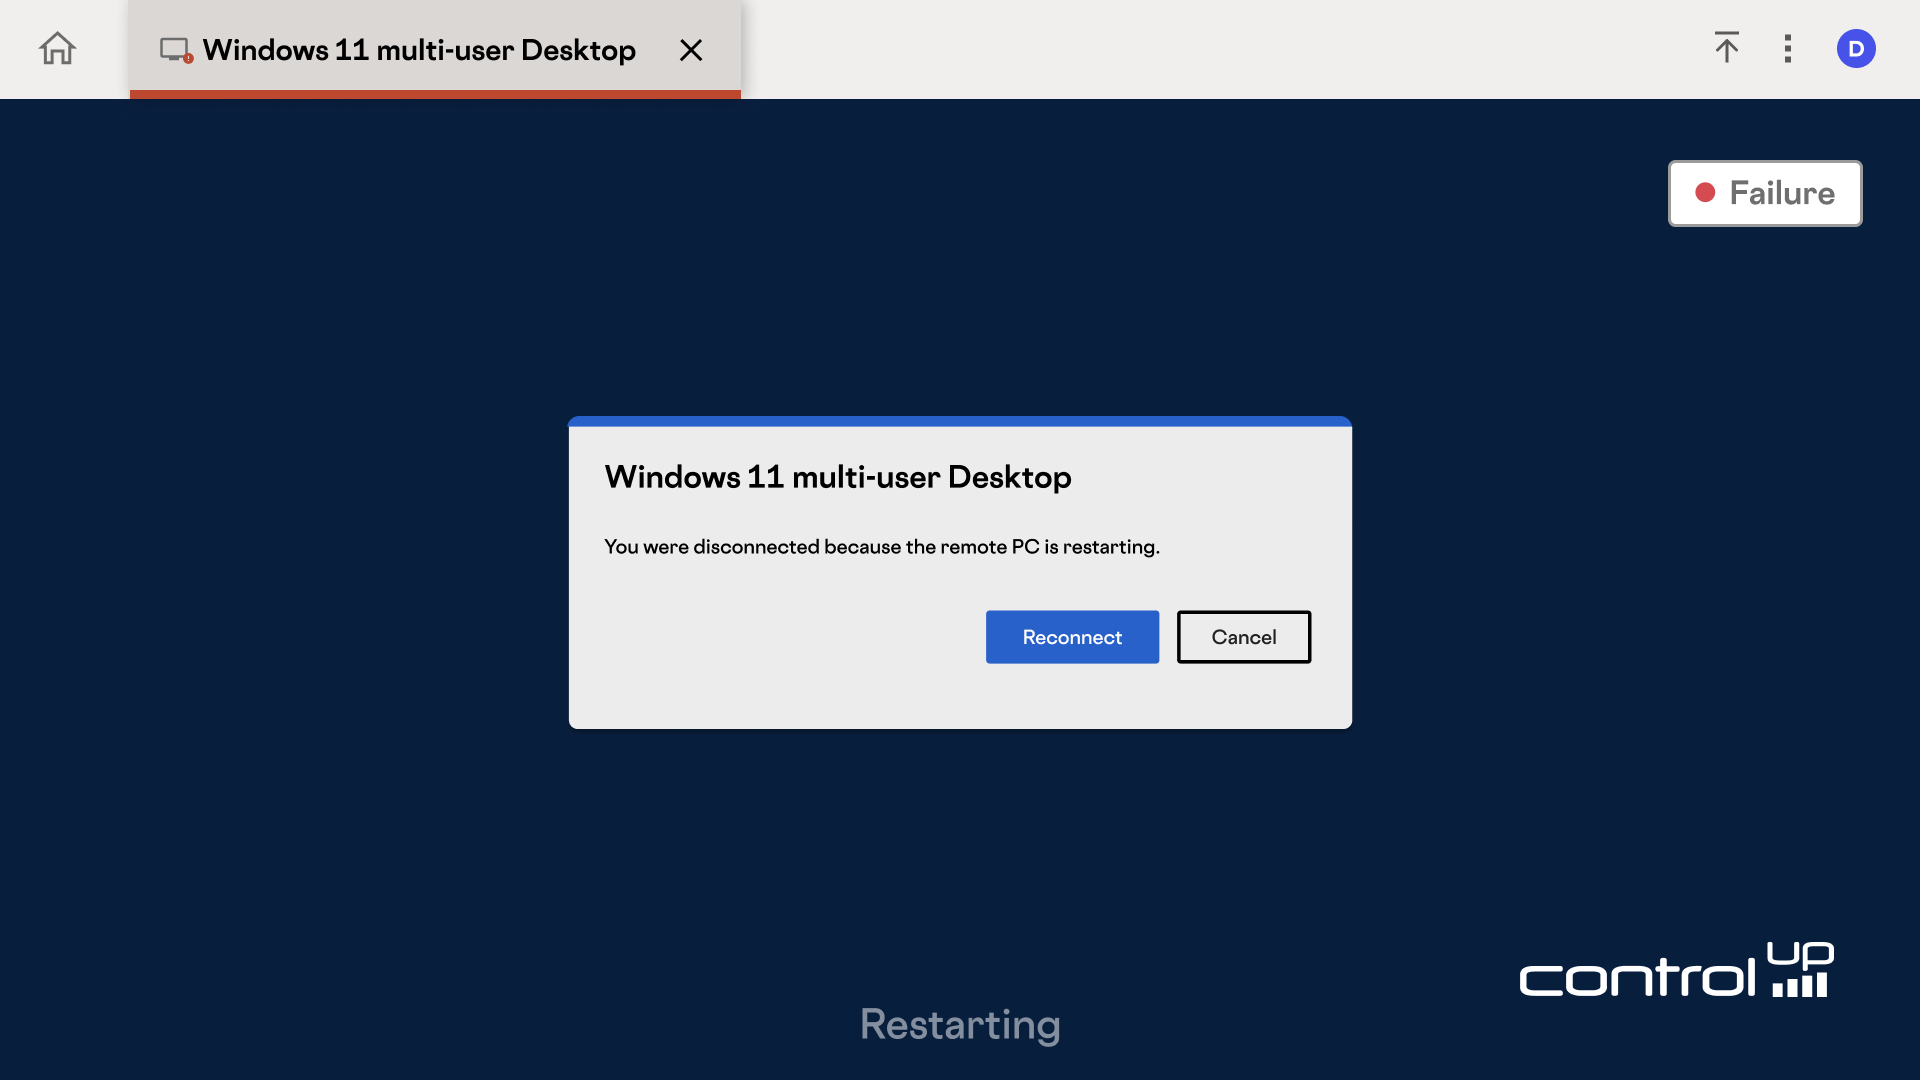
1. Microsoft Azure Virtual Desktop accepting sessions, but prematurely terminating the session due to a pending restart

The image shows a screenshot of a desktop monitoring tool. In the center, a pop-up window says, "Windows 11 multi-user Desktop" with the message, "You were disconnected because the remote PC is restarting." Below the message are two buttons: "Reconnect" and "Cancel." The background shows the monitoring application's interface with "Synthetic Monitoring" in the top left corner, a sidebar menu, and a table of test results. The "Test Details" panel on the right side provides information about the current test.
The platform detected and alerted on a critical issue, catching this pending restart of a Microsoft Azure Virtual Desktop host before users could be impacted by an abrupt session termination.

2. Desired look and feel at the beginning of a session versus the received ones during failures

A screenshot of the ControlUp Synthetic Monitoring tool's "Baseline Session Screenshot" feature. The screen shows a "Baseline Image" from a successful session, displaying a Windows 11 desktop with a welcome message. Below it, several smaller thumbnails show "failed" screenshots from different sessions. Each failed thumbnail has a red 'X' and a percentage, indicating a visual mismatch from the baseline. One of the failed screenshots shows an error message pop-up, demonstrating the type of visual anomaly the tool can detect.

3. Citrix – failed to download a connection instructions (ICA) file

 A screenshot from a monitoring tool showing a failed test result for a "notepad" resource. The status is marked as "Failure" with a red dot. A highlighted section labeled "Current Test:" shows a progress bar with a warning icon and the message "Cannot download ICA." A legend below the progress bar indicates that the test failed during the "ICA Download" phase, which is represented by a blue bar.

You’ve Resolved Your Issue—How it all Looks

After receiving the alert and implementing the necessary fixes, ControlUp will return to capturing your desired look and feel. (Note that due to display protocol compression, you will never get a 100% match for the hour:minute in the clock.) You can then confirm that you are good to go!

 A screenshot of the ControlUp Synthetic Monitoring tool's "Baseline Session Screenshot" feature. The screen shows a "Baseline Image" of a successful session. Below it, a gallery of smaller thumbnails shows both successful and failed session results. One thumbnail is marked "Successful" with a green checkmark and a percentage of 94.23%. The other thumbnails are marked "Failure" with a red X and a percentage, indicating a visual mismatch from the baseline. Some of the failed thumbnails show black screens, indicating a complete failure to render the desktop.


A screenshot of the ControlUp monitoring dashboard showing a list of synthetic monitoring tests. The table has columns for "Start Time," "Scout," "Total Time to Session Ready," "Status," "Image," "Authentication," and "Image Anomaly Score." The table shows a mix of successful and failed tests. The "Status" column has a red dot and "Failure" for most rows and a green dot and "Success" for one row. The "Total Time to Session Ready" column for failed tests shows "N/A" and the "Image Anomaly Score" shows a lower percentage for the failed tests and a high percentage for the successful test.

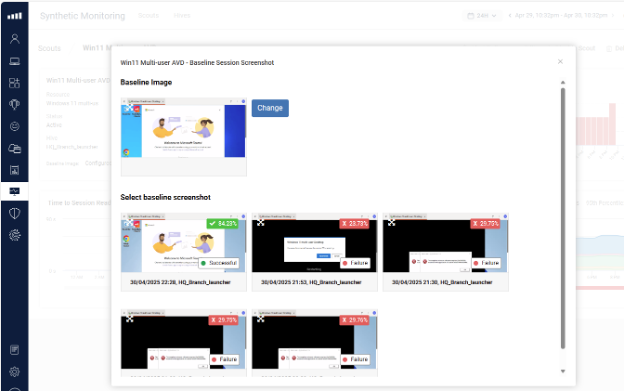
Including that healthy screen you expect your users to get.

 A screenshot of the ControlUp Synthetic Monitoring dashboard. A table shows a list of tests with their status. A green arrow highlights a successful test row and points to a pop-up window. The pop-up, which is also outlined in green, shows a screenshot of a successful session on a Windows 11 multi-user desktop, displaying the Microsoft Teams welcome screen. This visual confirms that the synthetic monitoring test successfully launched the application and rendered the expected user interface.

How to Alert—or, Better Yet, Follow Up

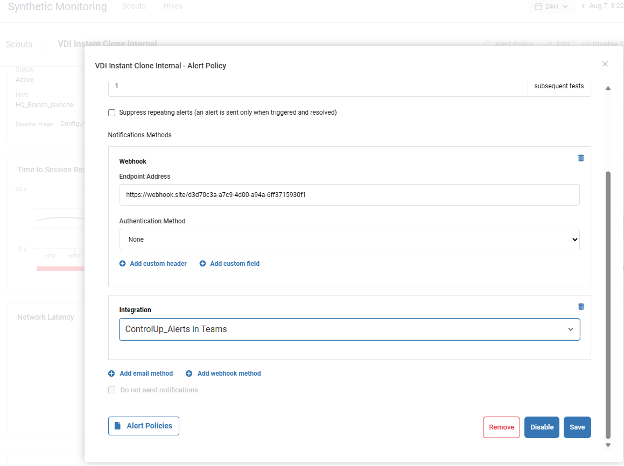
Detecting the problem is the first part. ControlUp then allows you to:

Alert via Email

The classic method of notification. ControlUp supports sending to specific people or groups.

A screenshot of a user's email inbox, showing three email alerts from "Scoutbees Alerts." The subject line for the top email is "Scout malfunction alert," and all three emails have a similar message preview: "Hi there, It looks like some of your Scouts haven't been..." The emails are timestamped to show that the alerts were received over a period of two days, highlighting a recurring issue.

Alters via Integrations with Your Other Tools

Or better yet, get your alerts in ServiceNow, Teams or other platforms that accept Webhooks.

A screenshot of the ControlUp Synthetic Monitoring tool's "Alert Policy" configuration. The policy is for "VDI Instant Clone Internal" and is set up to use a webhook for notifications. The screen shows a "Webhook" section with an "Endpoint Address" field populated with a URL. Below that, an "Integration" dropdown is set to "ControlUp_Alerts in Teams," indicating that alerts for this policy will be sent directly to a Microsoft Teams channel.

How to Take Action

In many circumstances, you will already have the prescription solution for the problem ControlUp reports. Let’s face it, some of these problems just keep sneaking back. In this case, you can leverage ControlUp’s Workflows, which is easily triggered from our Synthetic Monitoring, to have the platform solve the issue for you. Workflows allow you to prepare those actions and run them on demand, for example, as a webhook trigger. Check out a complete list of supported integrations here

In summary, ControlUp’s Synthetic Monitoring module offers a comprehensive solution for maintaining optimal end user experience and resource availability, especially for virtual desktop platforms. By proactively detecting and alerting on issues such as premature session terminations, look-and-feel discrepancies, and failed connection instructions, ControlUp helps organizations identify and resolve problems before they impact users. Furthermore, its integration capabilities and automated workflows allow for efficient problem resolution, ensuring that critical resources are consistently available and performing as expected, ultimately preventing disruptions and maintaining productivity.