
For years, IT teams have relied on ControlUp to deliver real-time visibility into their digital employee experience. But visibility isn’t one-size-fits-all. Every organization has unique environments, unique challenges, and unique questions they need answered. And for exactly those reasons, we built ControlUp Dashboards — a flexible, powerful way to visualize your environment, your way.
Today, we are excited to announce the beta availability of our new Dashboards capability for all our ControlUp for Desktops customers that have a valid subscription as well as other organizations that are currently trying out the ControlUp ONE Platform. More is on the way as part of our roadmap plans so that eventually every ControlUp customer can benefit from this new innovation.
Dashboards your way
When we started working on this project about two months ago, we knew that just like we always want to deliver the “realest real-time” when it comes to data collection, we also wanted to make sure that when it comes to the presentation of actionable insights through dashboards, we give our customers the most flexibility and options. So, when you start using Dashboards you will see that there are options, from ControlUp delivered pre-build dashboards all the way up to full customization of dashboards that you can build from the ground up.
Let’s have a look at some of these options.
ControlUp created, delivered and supported: over 10 dashboards on day one
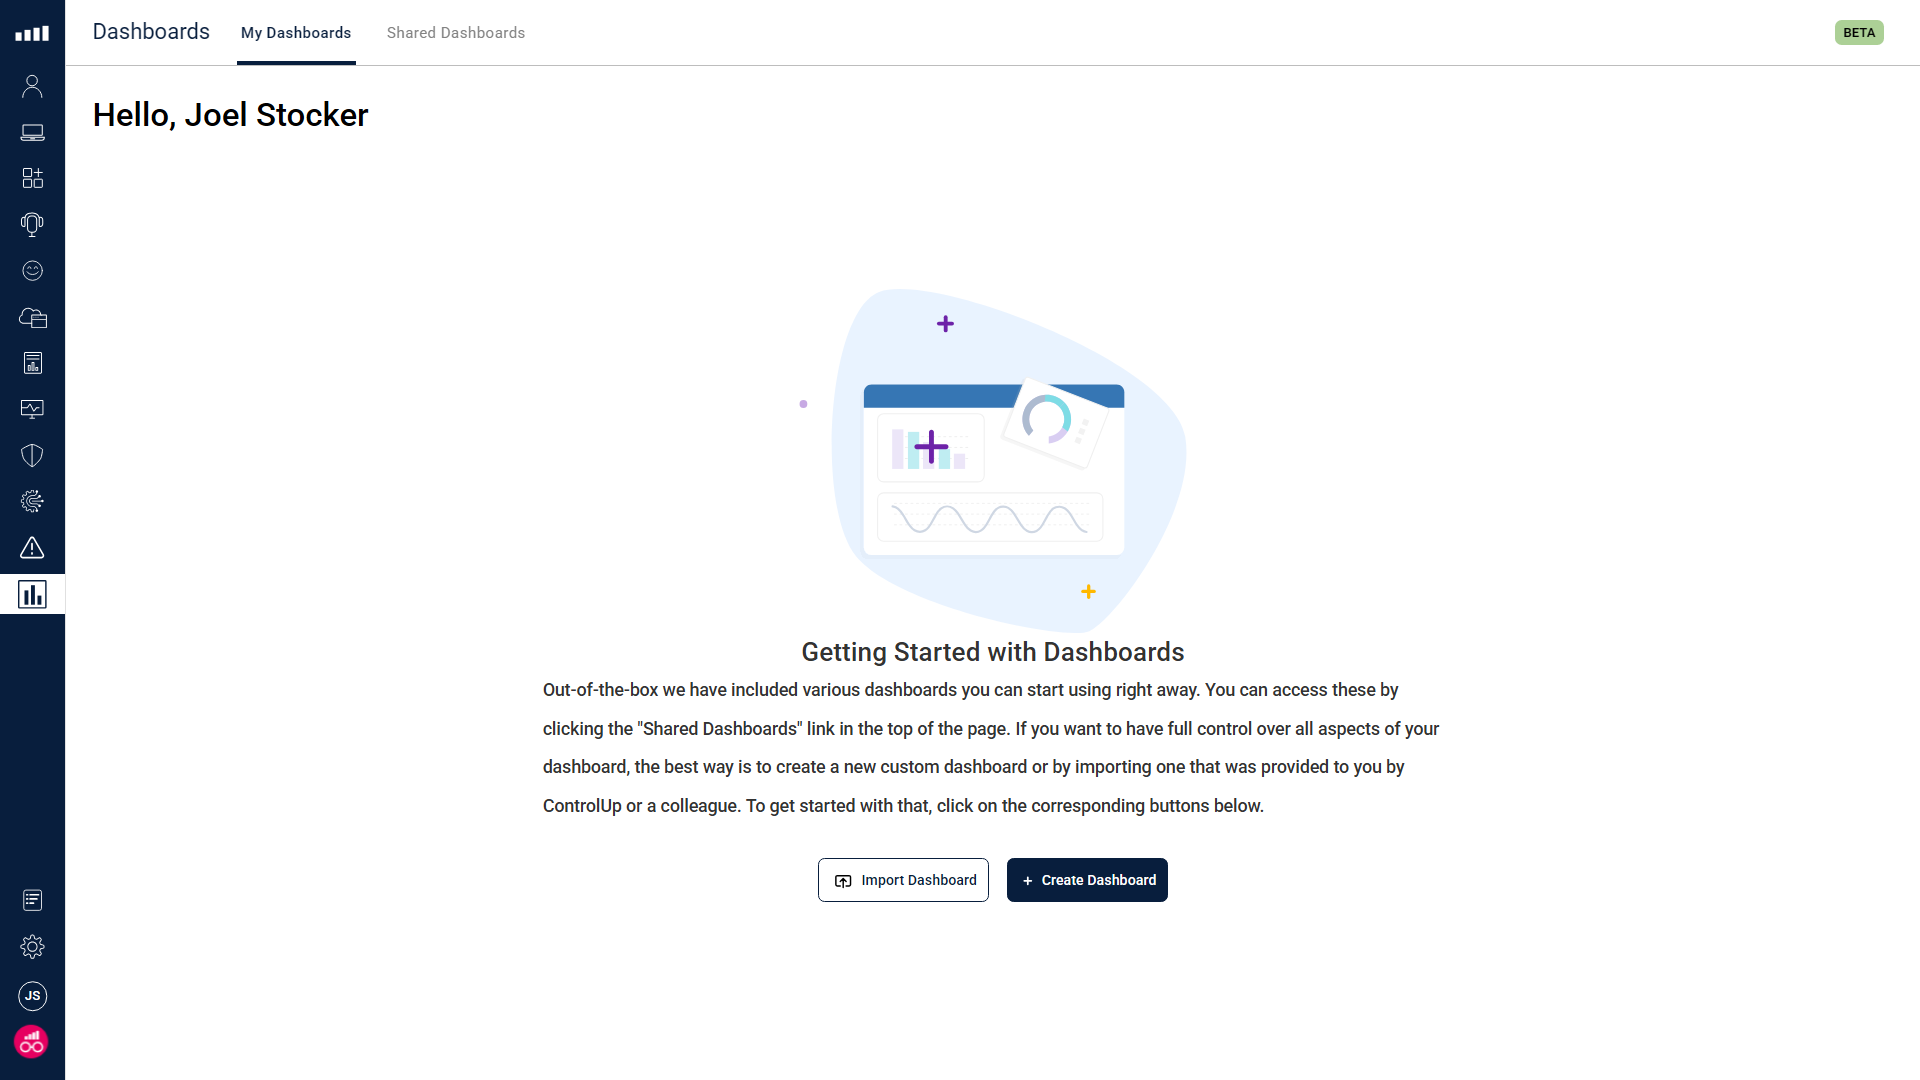
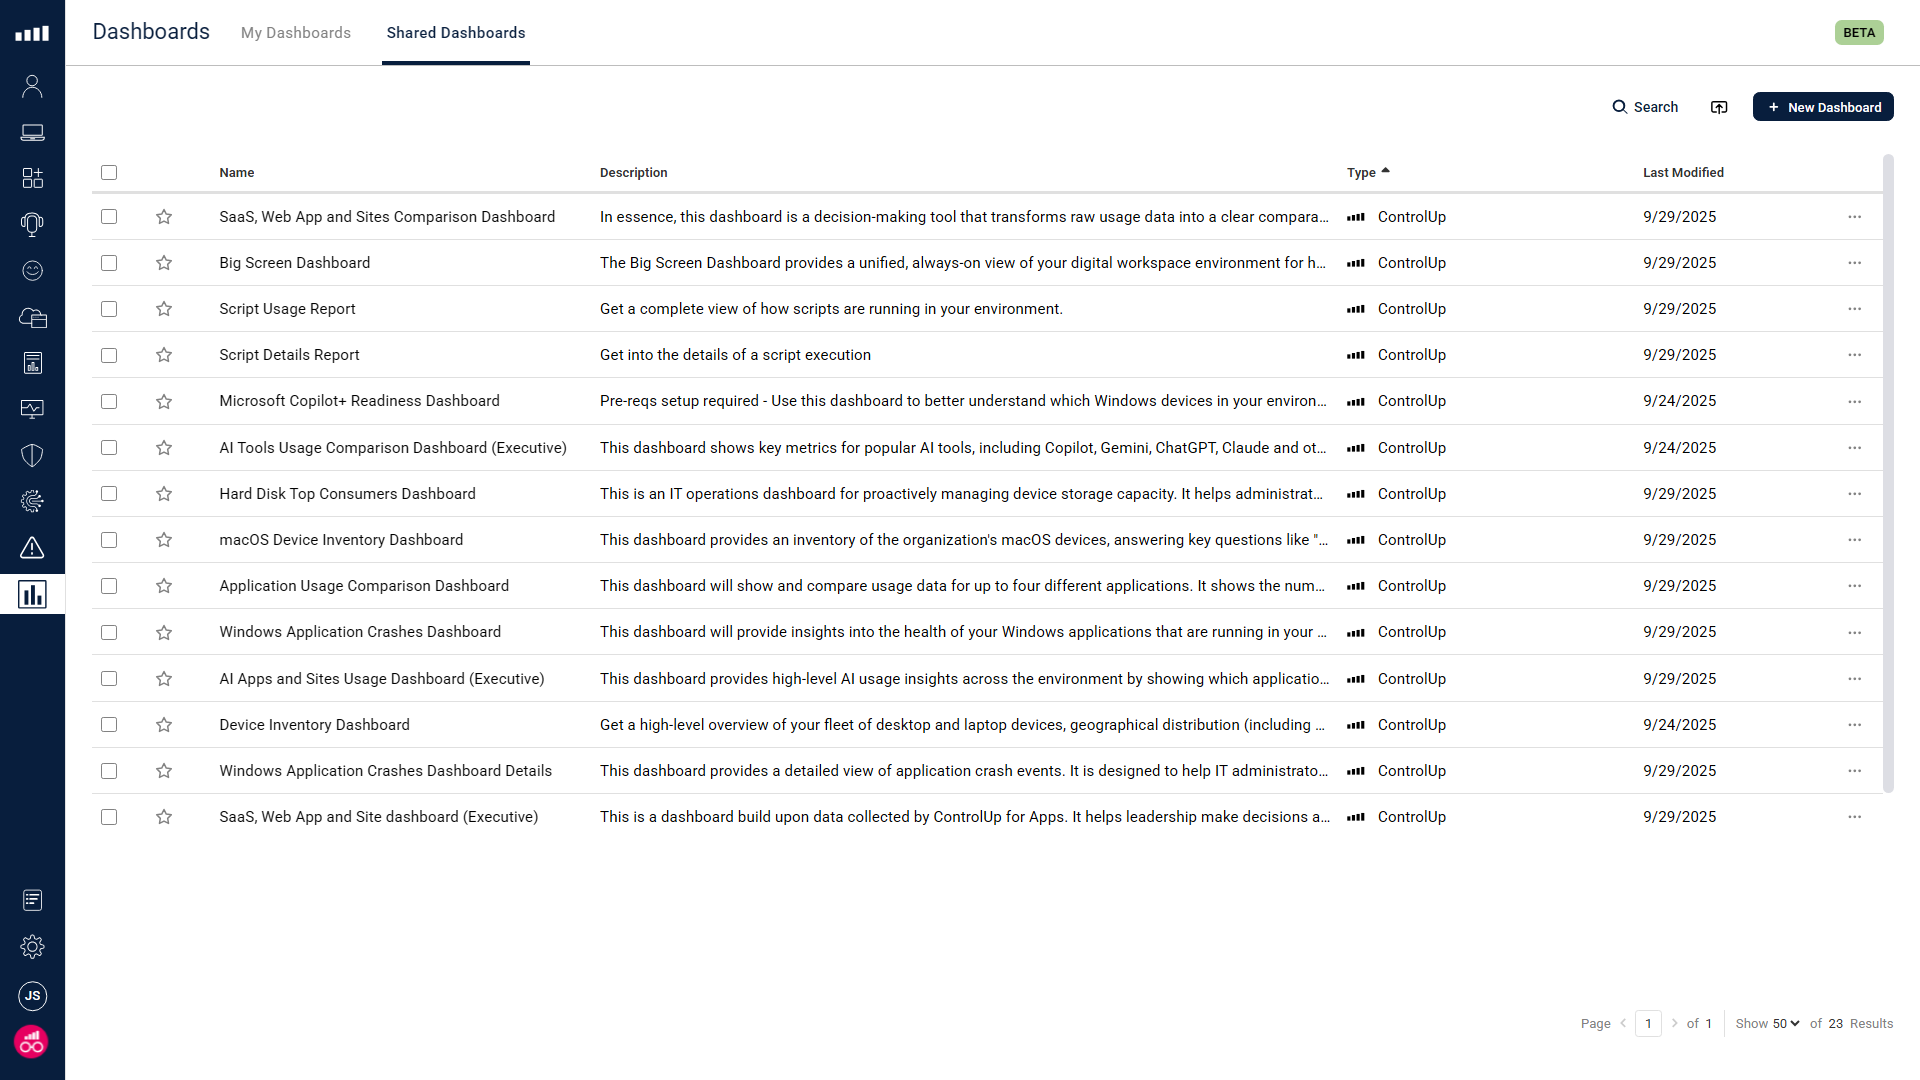
When you select the new Dashboards icon in the ControlUp ONE platform, you won’t be starting from scratch. The capability comes initially with more than 10 pre-built dashboards covering the most common use cases for monitoring and troubleshooting.
These built-in dashboards give you:
- Immediate value without configuration.
- A starting point you can favorite, duplicate, or customize.
- A foundation for new team members to quickly understand your environment.
“Specced” and build by you: ready-to-use visualizations or fully tailored
Every environment is different — and now your dashboards can reflect that.
With ControlUp Dashboards, you can:
- Create your own dashboards: Start fresh or duplicate an existing dashboard. Add widgets, arrange layouts, and build views that match your workflows.
- Build powerful widgets: Use the Widget Builder to pull data from any ControlUp data index. Apply aggregations, groupings, filters, and math transformations to shape your data.
- Choose your visualization: Whether you need a simple Stat, a Gauge for thresholds, a Time Series for trends, or a Table, Donut, or Bar chart for comparisons — ControlUp Dashboards has you covered.
- Make dashboards interactive with variables: Define variables (like device name, OS, or application) and use them as filters across multiple widgets. With a single dropdown, switch your entire dashboard view.
- Inspect the data behind every chart: Every widget comes with a RAW viewer. See the query that powers it, copy it into Power BI, Grafana, or Postman, or export the raw data to CSV. Transparency is built in.
The best of the ControlUp Innovation Guild, now at your fingertips
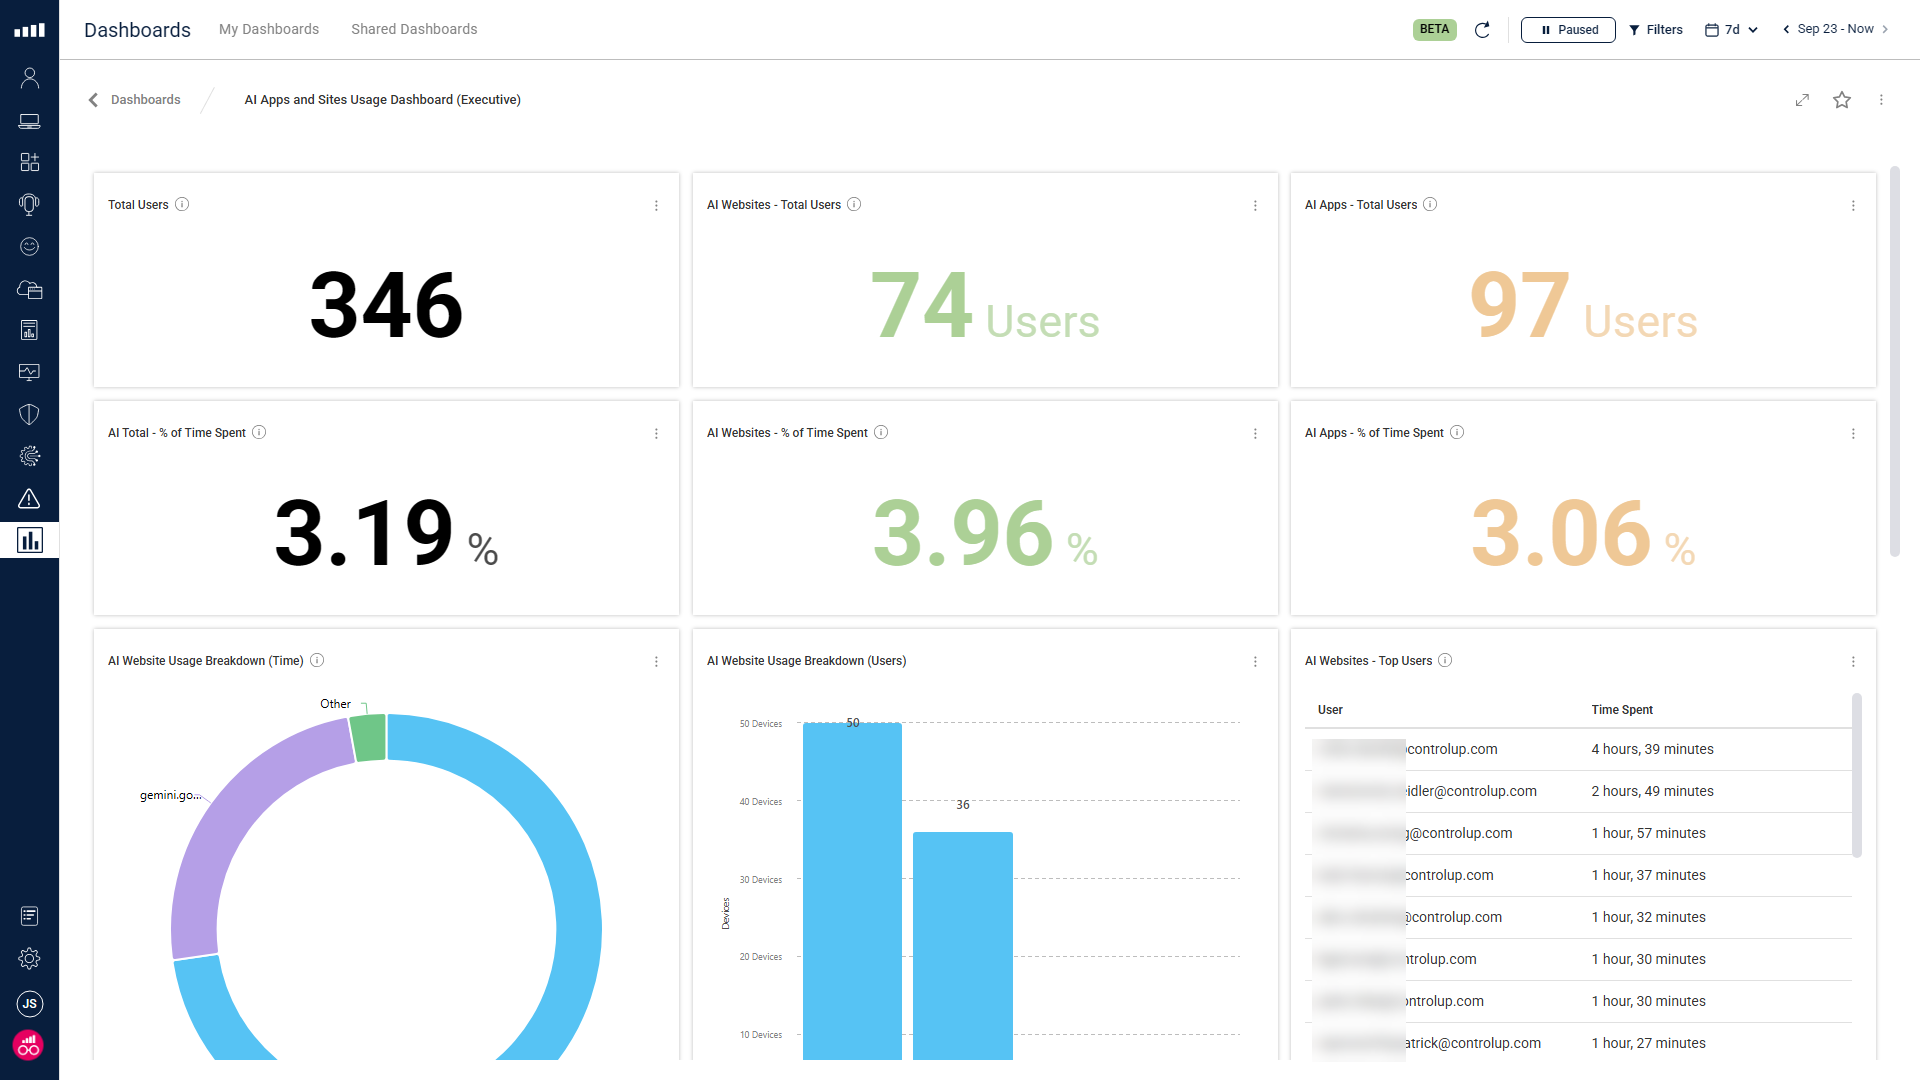
Over the past year, the ControlUp Innovation Guild has been experimenting with new ways to visualize and interact with data. Many of you have already used these dashboards in Grafana — from the Big Screen Dashboard for NOCs and helpdesks, to specialized views for capturing AI use in your company.
Now those community-driven dashboards are available directly inside the ControlUp ONE Platform. No extra tools, no additional setup. Just open, explore, and start using the same dashboards your peers have been raving about.
Get started today with better visualization of actionable insights
As we indicated earlier in this post, Dashboards is now available as a beta for all ControlUp for Desktops customers with broader support for ControlUp and third-party technologies on the way. There is nothing you need to do besides going into the ControlUp ONE interface and click on the Dashboards icon.
With our new Dashboards capability our goal is simple: give you the flexibility to visualize your data the way you want, while continuing to deliver value out-of-the-box. Your dashboards. Your data. Your way.
Check out this video in which I talk in more detail about the features and value that Controlup Dashboards brings.
Providing feedback and getting help
Detailed documentation will be available today from our Knowledge Center. And we are looking forward hearing from you about your experience with the new capability and the best way to provide feedback and ask questions or raise issues is in the ControlUp Community Slack. Not a member yet? Head over to the registration site and you will get quick access to all topical channels, including the #controlup_product-betas channel is there for you. See you there!