
By now, many people have heard about (and sing the praises of) ControlUp and our unique way of bringing IT insights to sysadmins around the world. In version 4.0, we introduced Hypervisor integration to extend our real-time performance monitoring to the virtualization world, starting with VMware ESXi and XenServer. Now, in version 6, we are proud to announce support for Hyper-V hosts as well.
Including support for Hyper-V is a natural progression. Hyper-V’s market share is rising; sysadmins find licensing advantages for running Windows VMs on Hyper-V rather than competing platforms. They also find Microsoft’s natural integration of Windows on Windows attractive and can make end-to-end management easier. This also gives ControlUp an opportunity to show how well we can give full-stack visibility into the environment. MSPs and CSPs are also finding their own unique challenges in their space as VDI and DaaS providers. As they leverage Hyper-V more, there is certainly a case to be made for extending ControlUp to meet this expanding need not just for remote monitoring, but also management, both real needs.
Making it work
With vCenter and XenServer, ControlUp talks directly to the VMware SDK or Xen pool master via an API. Hyper-V, however, requires that we first install the ControlUp agent (which has minimal impact on the host itself) in order to get the hypervisor stats from it. That’s all. SCVMM is not required for integration, (which is a big plus for organizations who do not have SCVMM and are looking for alternatives to monitor and manage Hyper-V) and the Hyper-V hosts can be either stand-alone or in a failover cluster.
How to add your Hyper-V into ControlUp:
- Add the Hyper-V hosts as managed computers (Install the agent via push or MSI in a matter of minutes, your choice), then
- Add the hypervisor connection to the console

When you add the hosts, they will be automatically recognized as clustered or stand-alone and put into the organizational tree accordingly. And like the rest of ControlUp, all of the data shown in the different dashboards is real-time data, something that is missing from SCVMM.
Now we have a dashboard of relevant hypervisor performance data in one window, and we automatically adjust the data according to whether the host is clustered or not. For example, see the “Datastore R/W IOPS” column. The stand-alone hypervisor shows a local logical drive, while the clustered hosts show the relevant Cluster Shared Volume data.

Features
ControlUp 6.0 Hyper-V integration enables real-time performance monitoring and management of the virtualization infrastructure. We have extended the functionality of ControlUp to Hyper-V with the following features:
- The Hosts View – This view displays Hyper-V hosts including a variety of real-time performance metrics and system information that are relevant to hypervisors.

- Hypervisor-based Computer metrics – New computer metrics such as ‘Virtual Disk IOPS’, ‘Host CPU Usage’, and ‘VM Tools Version’ are in the Computers View in order to enable better understanding of your computers’ real-time performance and how it affects the resource utilization on your Hyper-V hosts. Note that in-guest data from the agent and out-of-band data from the hypervisor are presented together in the same row (Disk Reads/sec and Virtual Disk Reads IOPS, for example).

- Non-Windows and agentless monitoring – Once hypervisors are connected, ControlUp can now monitor all VMs (including non-Windows VMs) by retrieving performance metrics and system information from Hyper-V. Since this capability does not require agent deployment into the guest OS, it can also be used to provide insights into the computers’ performance during boot-time where agent communication is not possible. The above is true for computers already managed with ControlUp, as well as for any VM (Windows, Linux or other) hosted on your Hyper-V infrastructure.
- The combination of data sources gives us an additional benefit of being able to see information about the Hyper-V servers both from the perspective of being a hypervisor (as above) as well as a managed computer (below). Notice that the counters have changed to metrics that are more relevant to regular servers.
- Hypervisor-based actions – The new ‘VM Power Management’ action set includes popular actions such as ‘Force Reset VM’ and ‘Power On VM’ which simplifies day-to-day management of virtual workloads. More advanced virtualization-related actions can be created using ControlUp’s Script-Based Actions feature, making ControlUp a single point of management for all virtual machines in your environment. As mentioned above, because we also have our normal agent connection to the Hyper-V host we can manage it as an endpoint, so all of our rich management actions are available to use in managing the hypervisor itself.

- As with any other ControlUp view, drilldown into the VM, session and process layers is possible by double-clicking any object. See below for an example of how this works.
- In addition, although by default all consoles and the monitor connect to the Hyper-V hosts, you can designate a data collector so that there is only one point of contact with any given host instead of many. This reduces the number of computers that are independently pulling performance data from the Hyper-V hosts. You can read more about this data collection mode here.
- And of course, all of this data is uploaded to the ControlUp Insights historical reporting portal. It is worth noting again that ControlUp talks to all hypervisor types – Hyper-V, vCenter, and XenServer in one console and gives you a single place to manage all three environments together, both in the console itself as well as the Insights portal. This is a great advantage for heterogeneous environments.

Example
Let’s review the following use case to illustrate the potential of the Hyper-V integration feature and review some of the Hosts / VM’s available performance metrics (a full list of Host and VM metrics are available on our edocs).
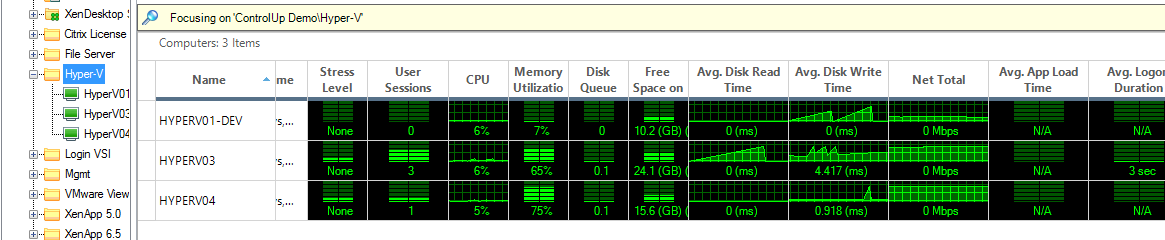
After receiving complaints from some end users regarding slow performance of some servers you know to be Hyper-V virtual machines, the admin launched the ControlUp real-time console to evaluate the current state of the Hyper-V hosts running them:

The admin quickly identified that a single Host (HyperV04) is in a critical stress level due to a high IOPS consumption. Double-clicking the host entry in the data grid allows the admin to drill down and see which guest VMs are currently affected by the I/O bottleneck:

After the admin identified the VM suffering from poor performance and high IOPS usage, s/he can now double-click on the computer to quickly move to the Sessions and Processes view and identify the actual culprit:
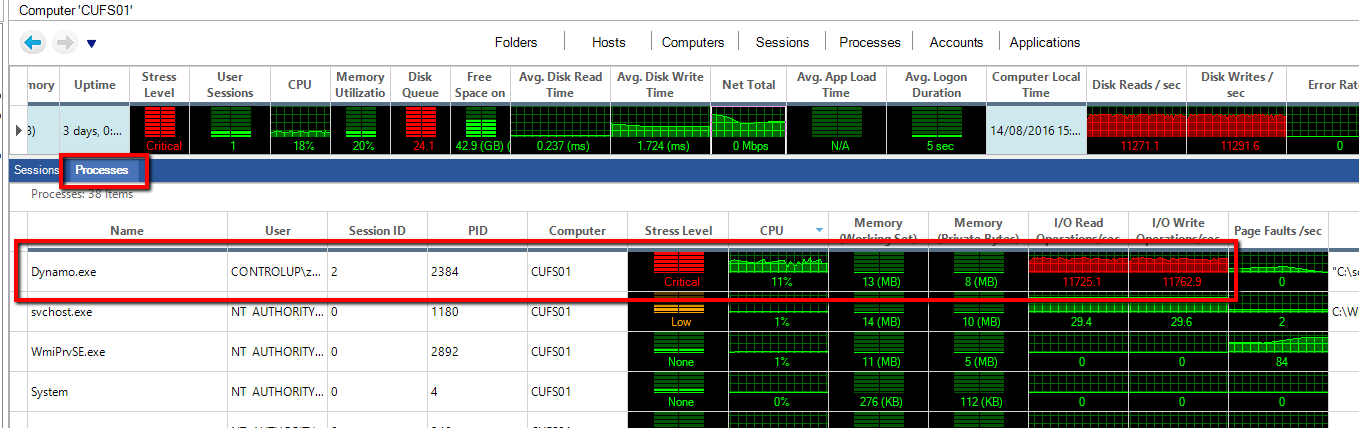
By reviewing the Processes view the admin found that a process called Dynamo.exe running on the affected VM is causing the high IOPS consumption. The next step was getting a screenshot of the user session running on CUFS01 to figure out which component is triggering the Dynamo.exe processes. They switched to the Sessions view (image 1) and used one of the ControlUp management actions (image 2) to do so:


That’s it! By using ControlUp ‘Get Session Screenshot’ action the admin found that a rogue sysadmin was running IOMeter to stress test the storage subsystem in the middle of the working day causing high IOPS usage and performance issues for multiple end users.
Hopefully this quick walk-through of our Hyper-V support will give you an idea of how ControlUp is a really great tool for Hyper-V admins to help efficiently and quickly monitor and manage their environments.