Over the past few years, unified communication (UC) applications such as Microsoft Teams and Zoom have played an increasingly crucial role in allowing remote workers to keep in touch and relay information to each other. With more and more of our workforce remote, having these applications go down or start to misbehave can have devastating consequences for a company.
In recognizing the importance of UC applications to a business’s success, ControlUp released a dashboard for Edge DX last year that tracks the health and performance of Teams meetings and, more importantly, the devices initiating these meetings. Of course, Teams is just one of the myriad UC applications corporations currently use, so we are proud to announce that we have added a Zoom dashboard to Edge DX.
As with other UC dashboards in Edge DX, our new dashboard shows the number of Zoom calls and their performance. This dashboard is sortable, making problem calls easy to be isolated and investigated.
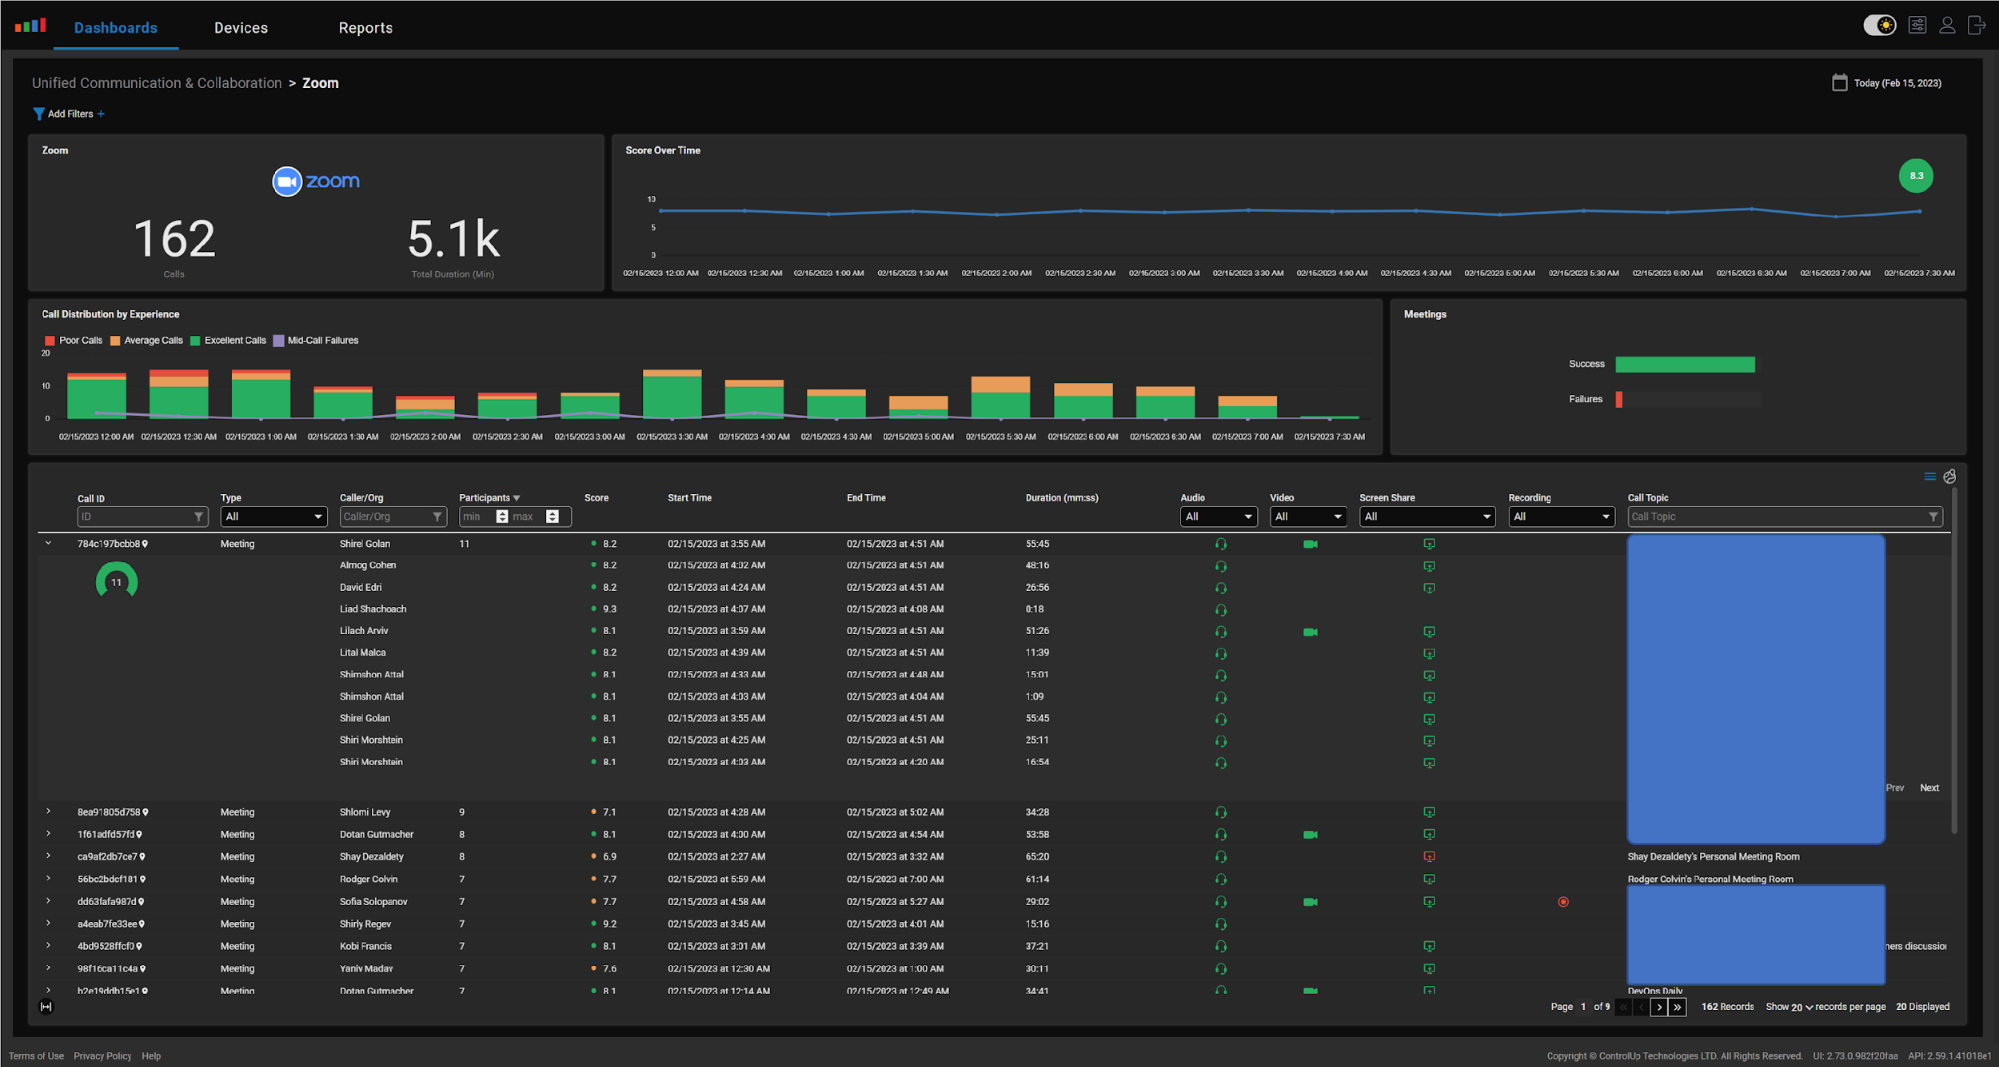
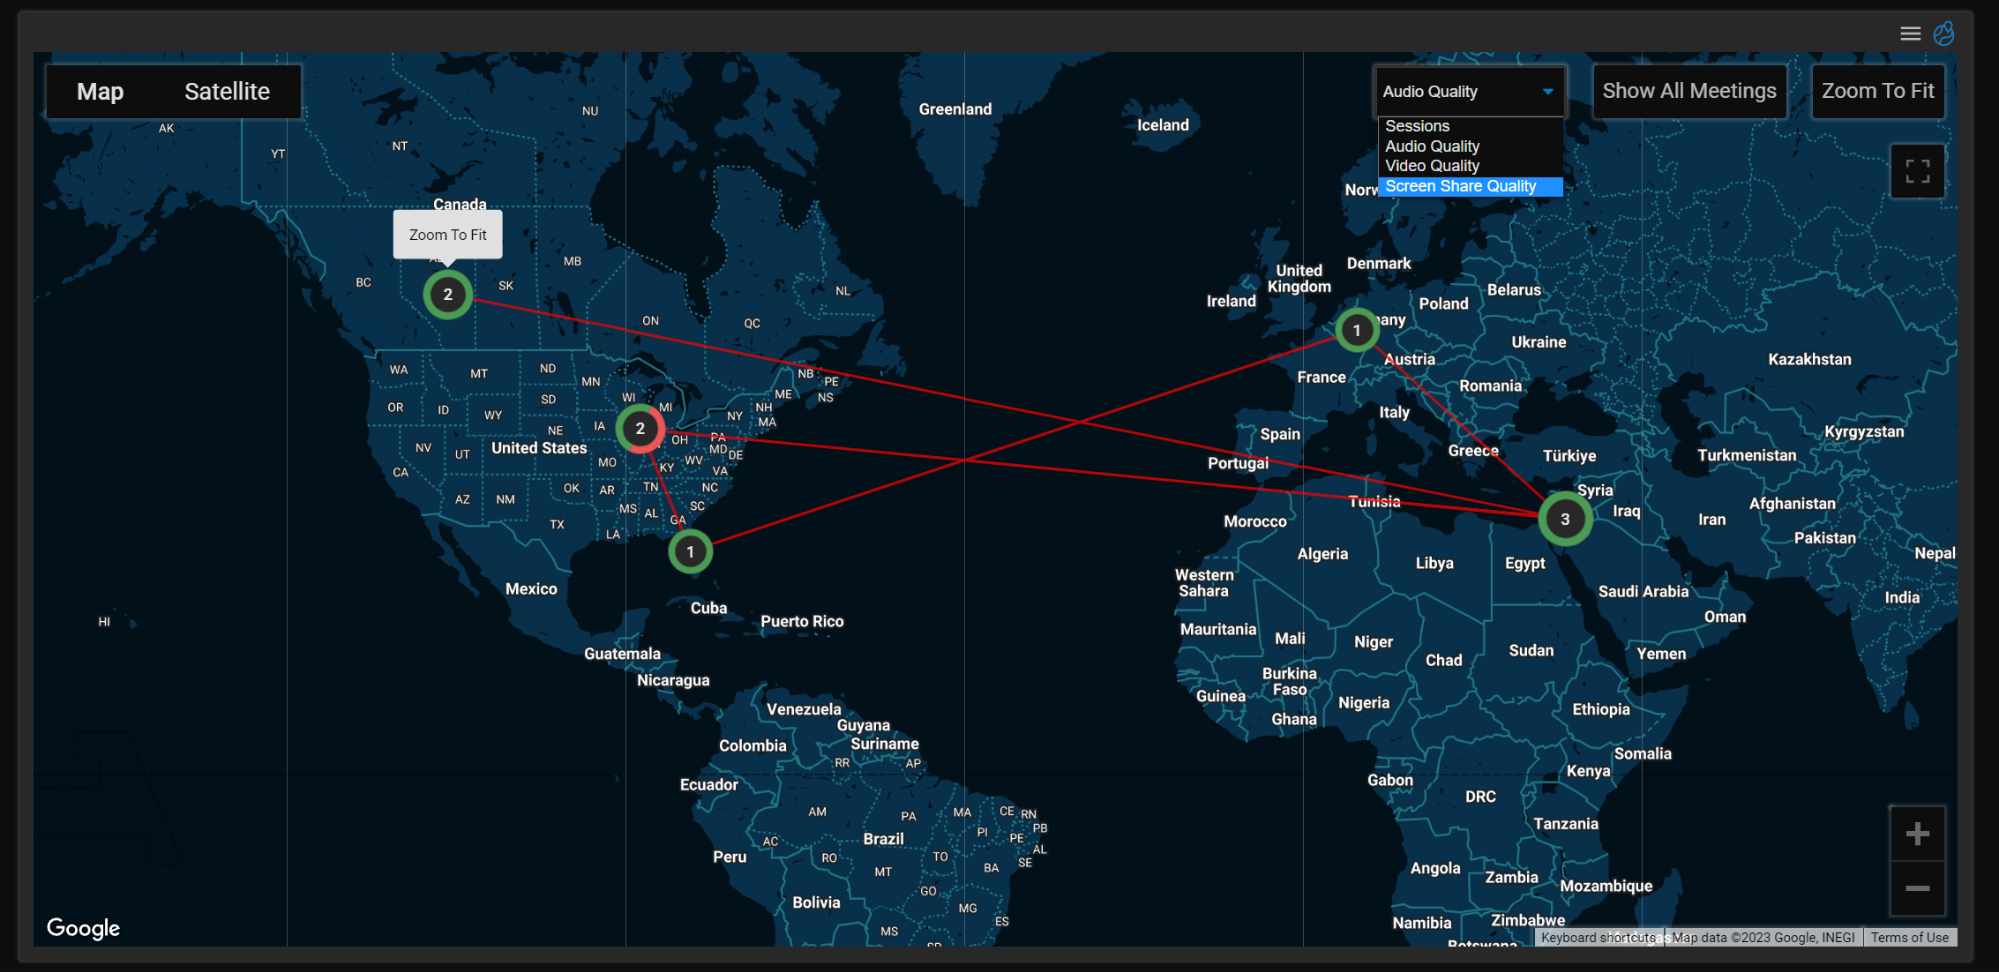
From the dashboard, it’s also possible to monitor a visual map that depicts the current location of callers along with the audio, video, and screen share quality. This information is useful when investigating if a particular site or area has networking issues.
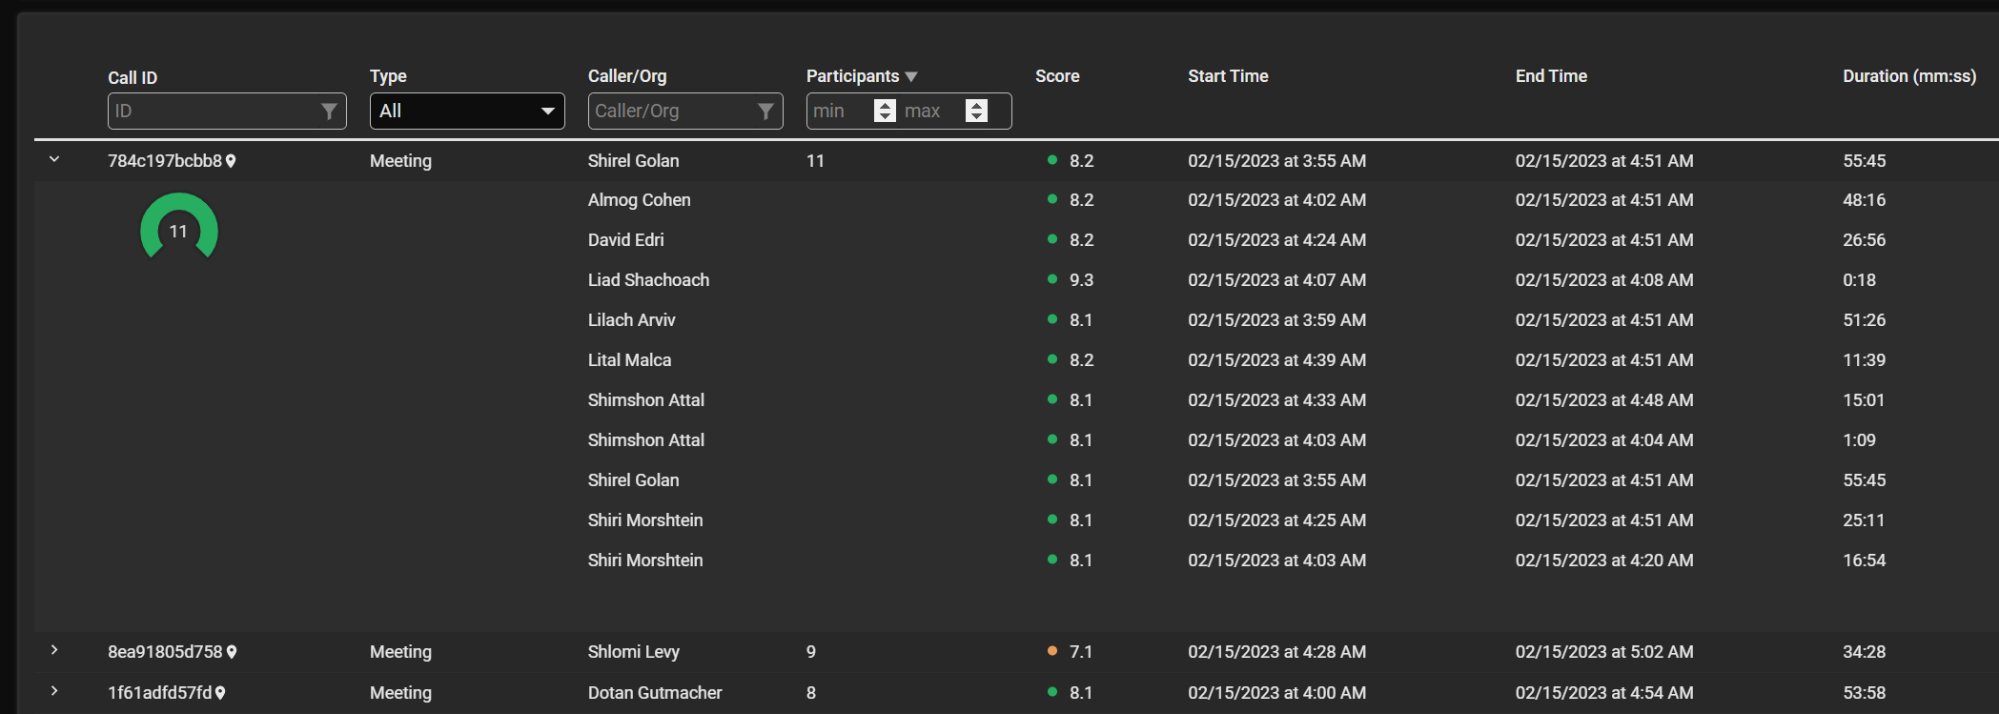
Once a meeting with an issue is identified, it can be expanded to see the health (score) each participant had during the call and the time they were on the call.
While the Zoom dashboard is a powerful tool to identify calls that have had issues, the real power of this tool is its ability to, once a case has been identified, carry out a deep dive into what was happening on the device at the time when the problem was occurring!
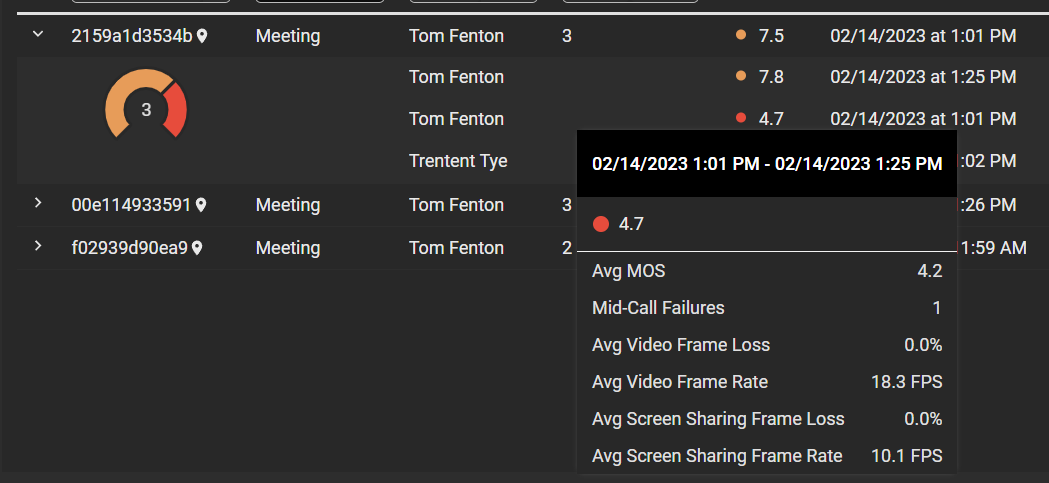
To better understand how Edge DX finds the root cause of a UC issue, let’s look at an example scenario in which a user, Tom, opened a ticket saying that he had a problem with a Zoom call.
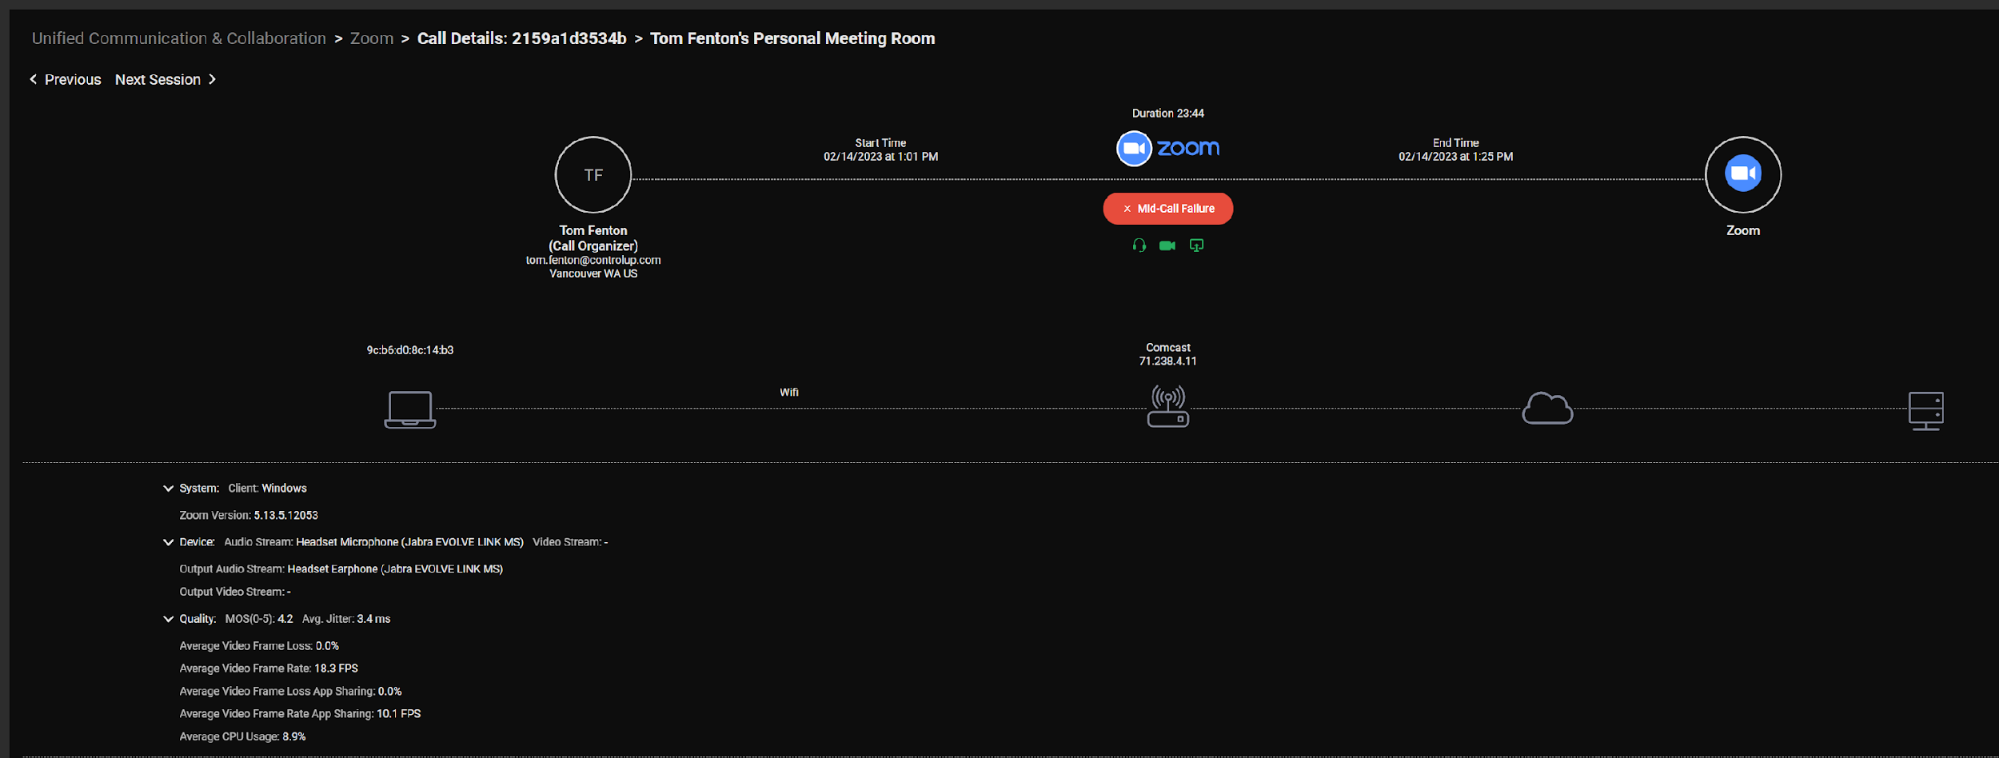
We can start our investigation by going to the Zoom dashboard and searching through the calls for his name. Upon expanding the call, we can see two entries (one for each time he entered the call). One of the entries shows a value of 4.7 in the score field, a synthetic metric composed of other metrics. We can also see that it had a mid-call failure by hovering over it, which is why the score was rated so low.
By clicking on the entry, we can find more information about the call, including how it used Wi-Fi for communication, what type of device (Windows), and what version of Zoom it was using (5.13.5). It even supplies information about the audio and video devices used during the call.
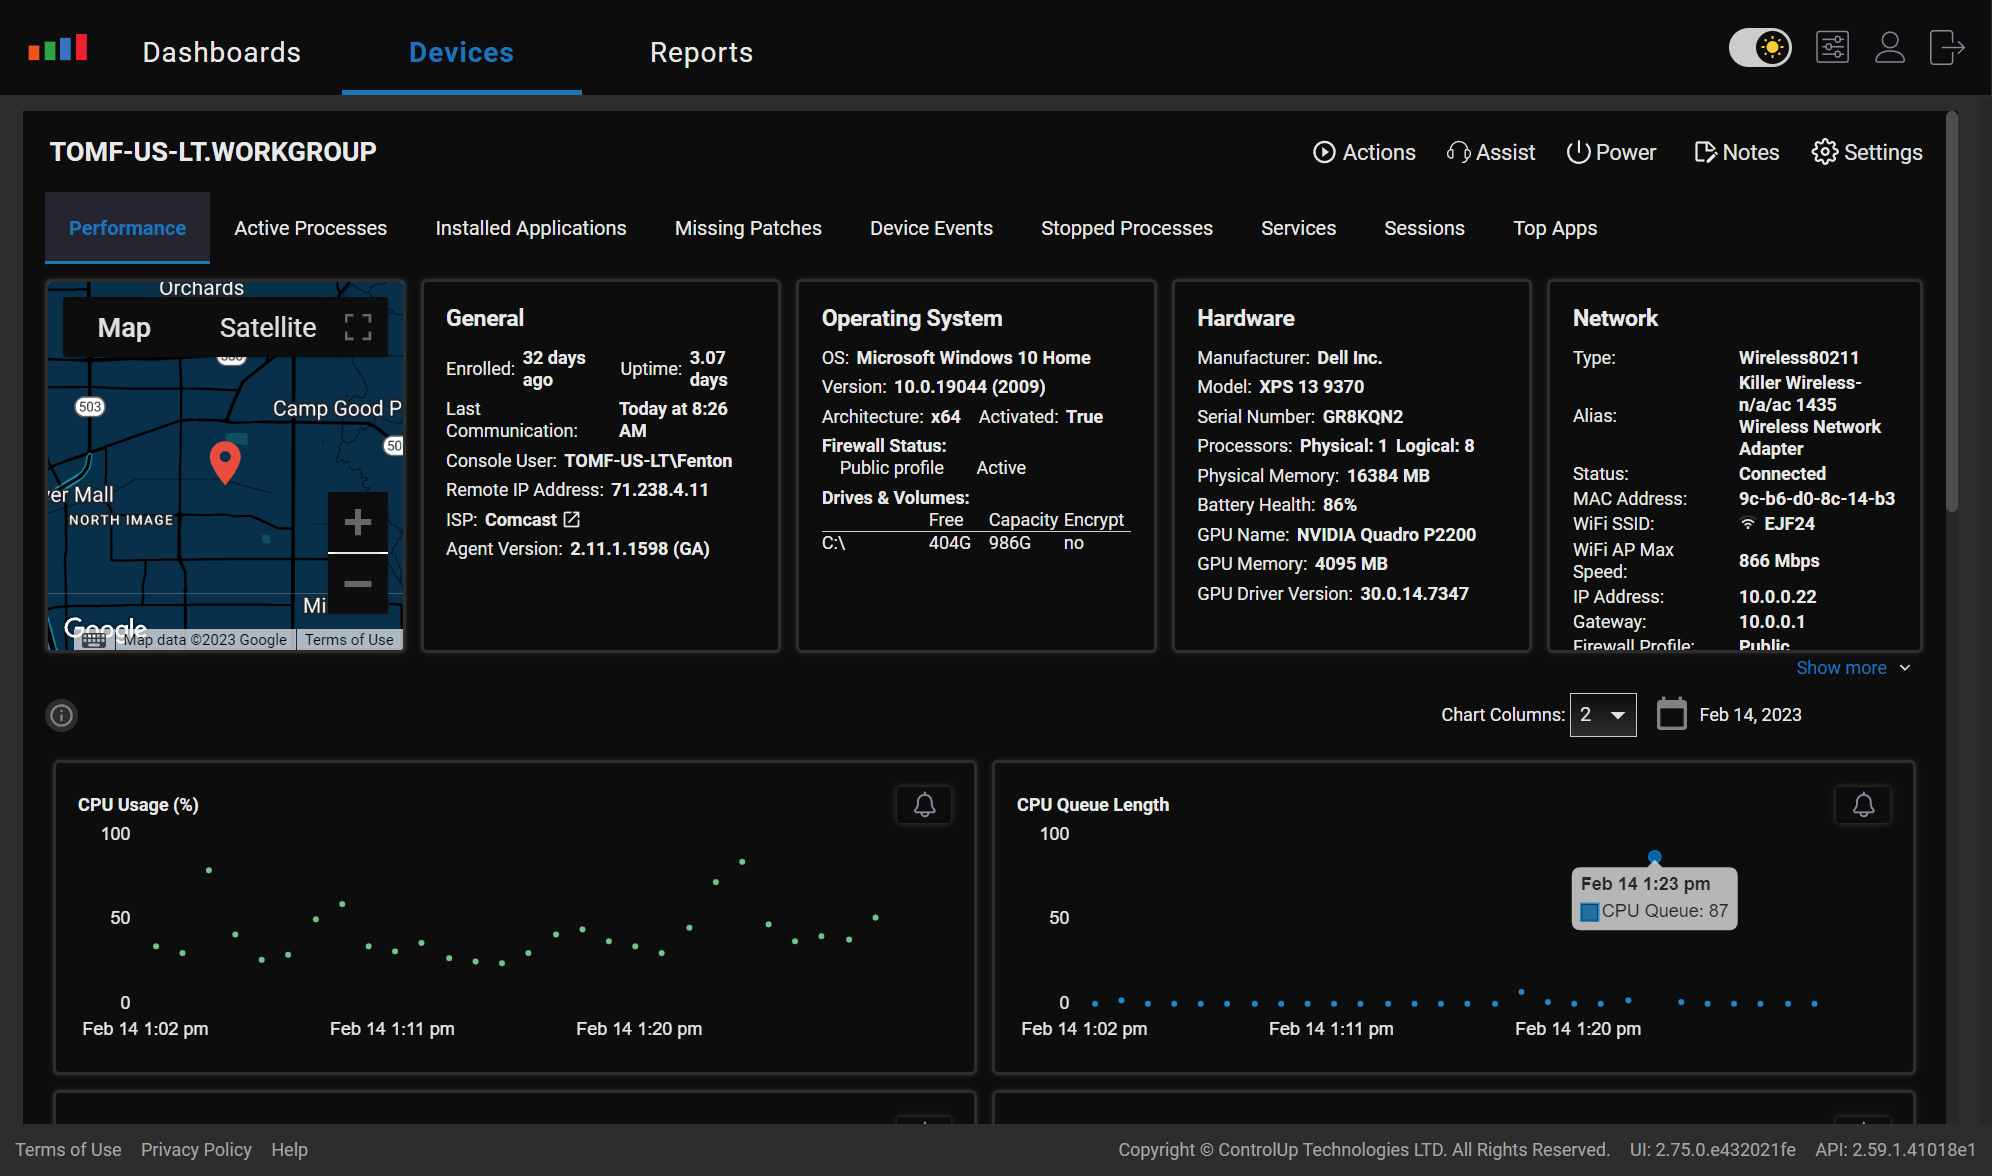
The above information lets us know that we had an issue with a call; however, as mentioned above, Edge DX captured real-time metrics about the device when the problem happened. Clicking on the device presents this information.
On close inspection, the metrics we looked at were from 1-1:30 pm on 2/14, when the mid-call failure occurred. We can also confirm that the CPU usage was quite high during this time; at one point, the CPU queue length reached 87, which is incredibly high for a system with four physical and eight logical cores.
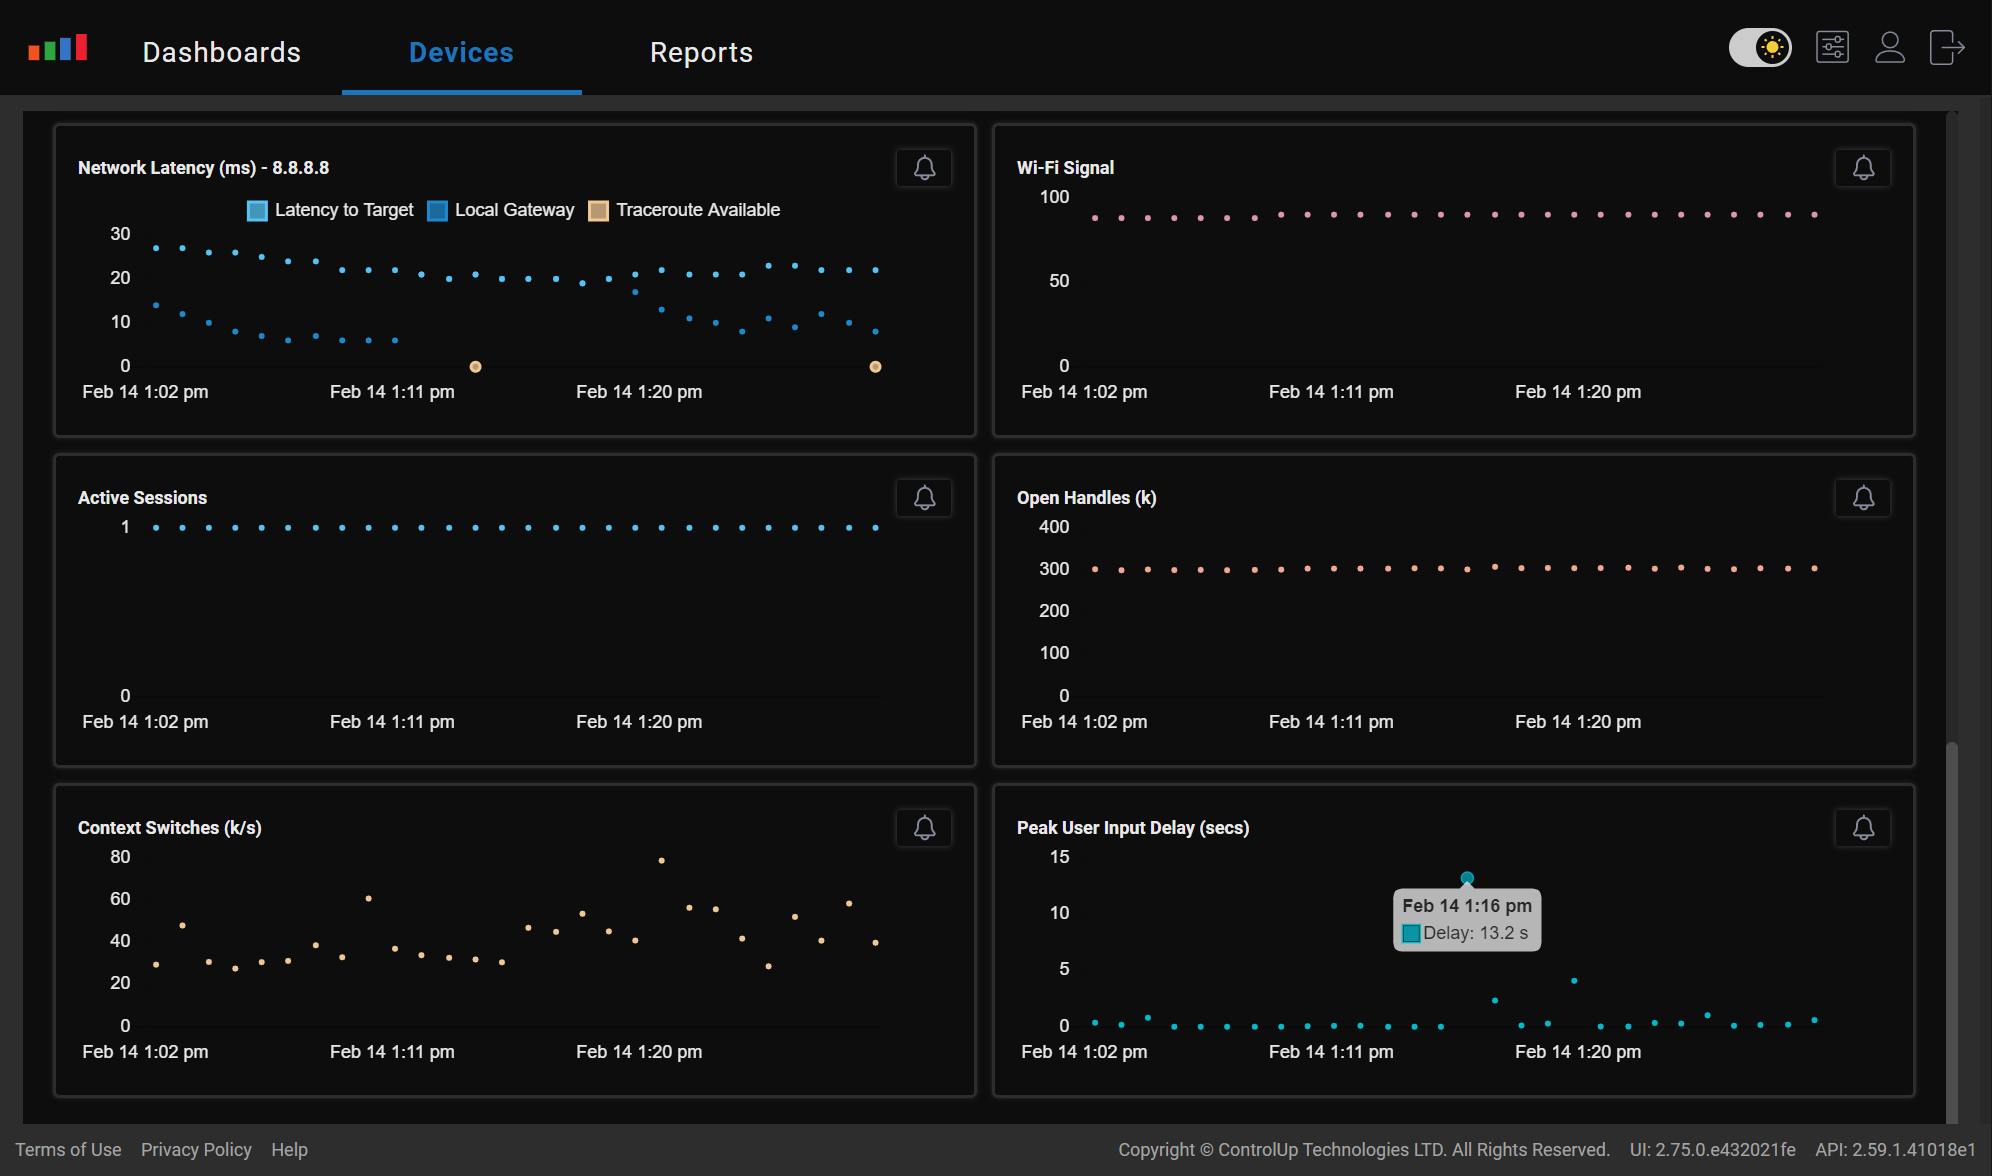
Scrolling down, the network latency and Wi-Fi signal strength are reasonable, but the peak user input reached 13 seconds at one point during the call! That literally means that the user had to wait 13 seconds to get a response from their applications!
The device’s hardware was heavily utilized at certain times during the call, which could explain why Zoom finally failed, but Edge DX can also do further investigation on the device.
To take a closer look at what was consuming the resources on the device, I clicked the Active Processes tab and sorted it by the Total CPU Time column showing that the two processes using the most CPU cycles were services.exe and Qsync.exe.
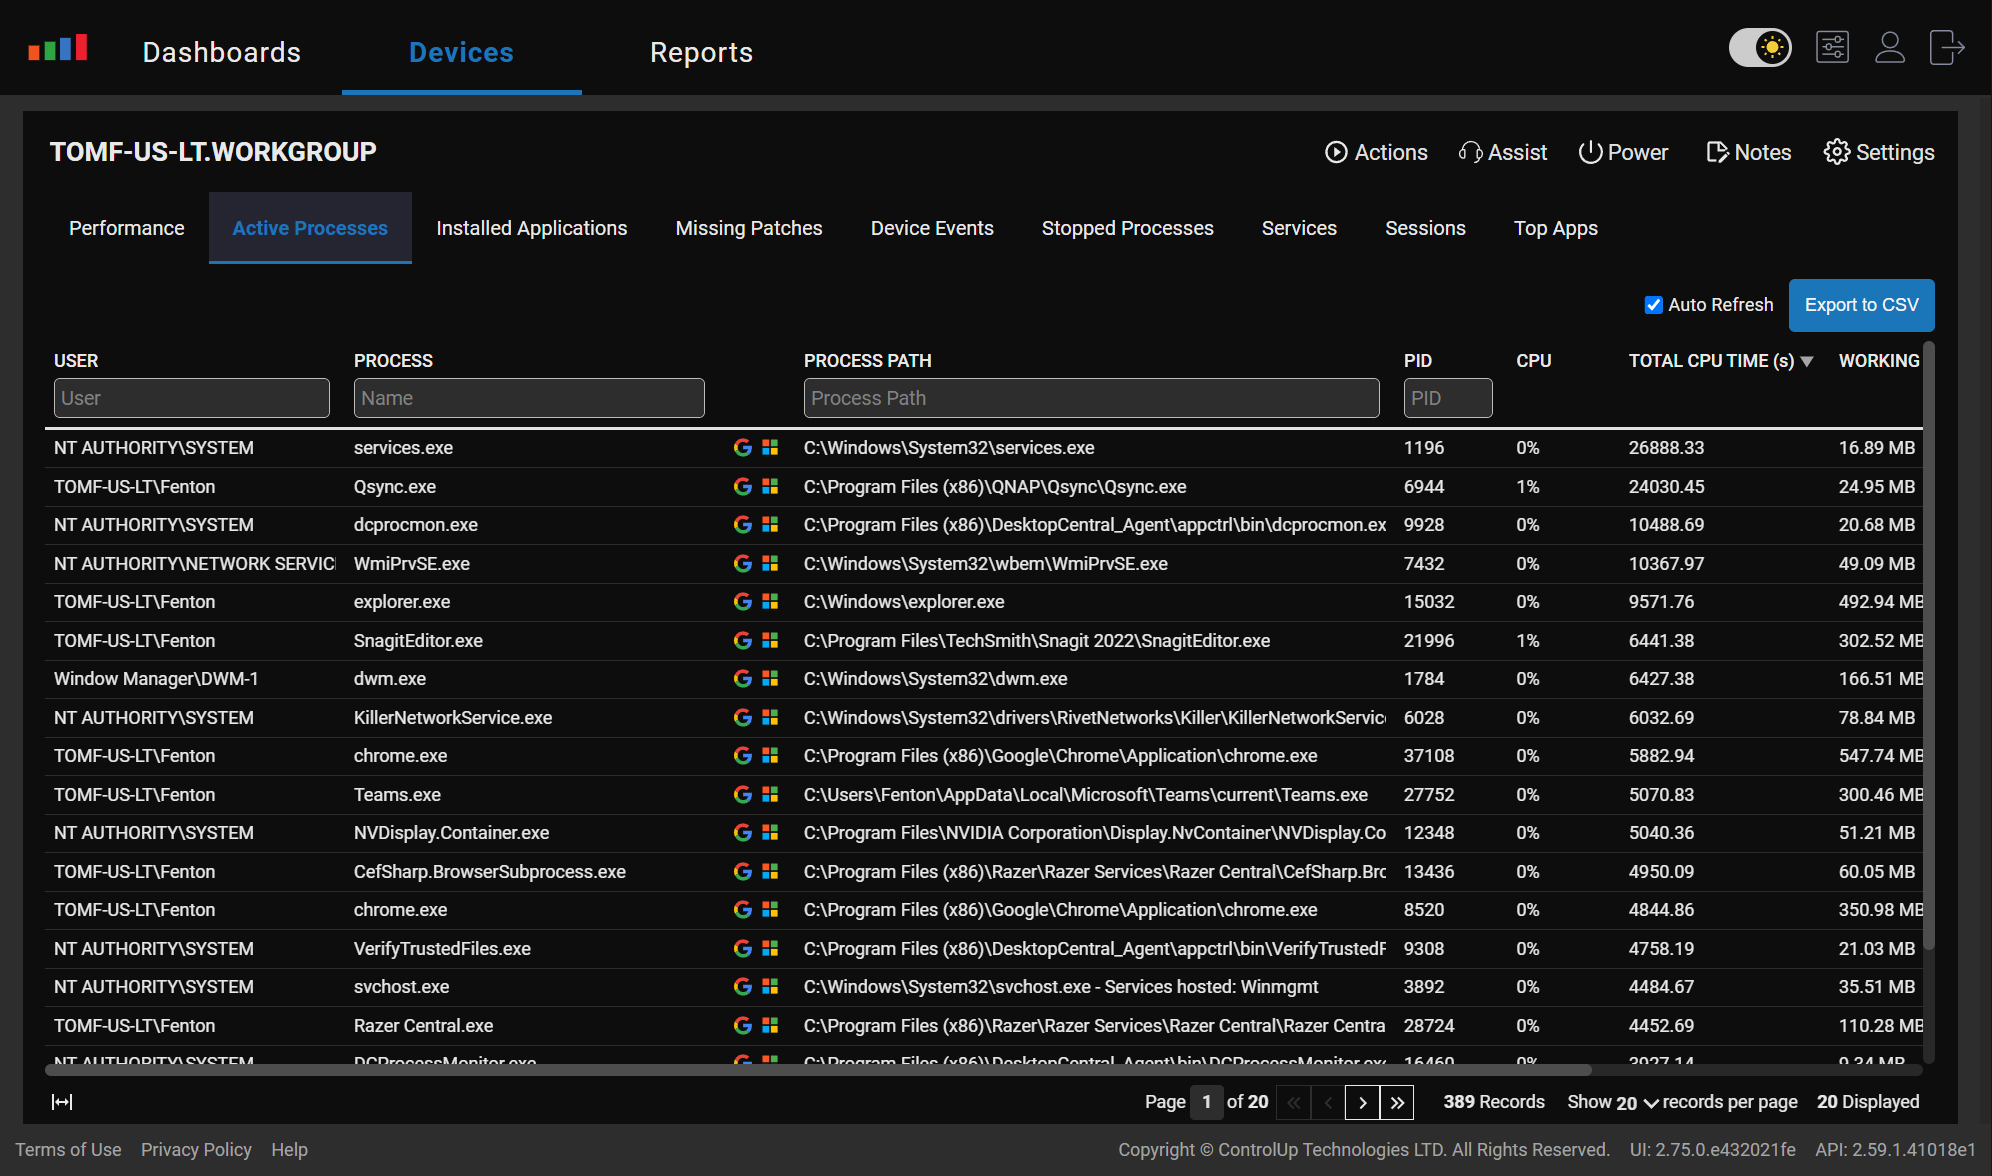
One of the important features built into this dashboard is that you can click an icon to search the process to learn more about it.

Many problems related to the software on the system may have already been resolved, but the patch may not have yet been applied. By clicking the Missing Patches tab, you can see whether or not this is the case.
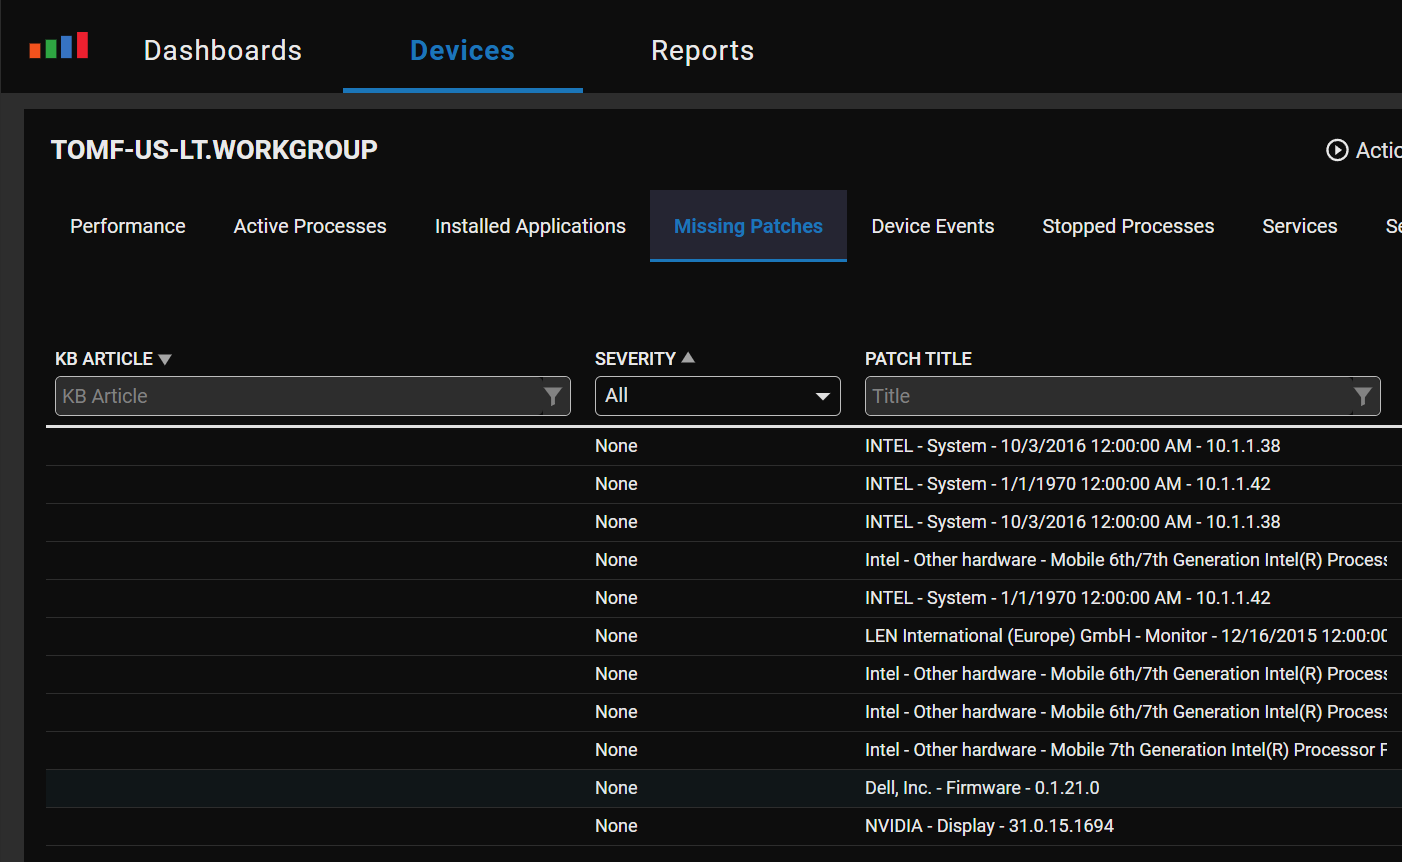
This example shows that this system was neglected and needs many system patches.
The above metrics and information can help you discover what has caused an issue. Using Edge DX’s Action features, you can write a script to upload the Zoom logs from the device to a repository for further investigation or forward them to Zoom for analysis.
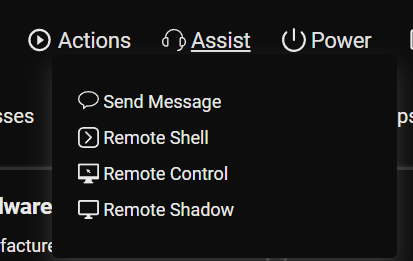
Finally, if I wanted to investigate the problem with the device itself, in that case, I could use Edge DX’s Assist feature to either remotely run commands on the device or remotely access the desktop.

UC applications like Zoom and Teams are mission-critical in today’s modern workplace, meaning we need the tools to identify the issues and determine their root cause when they don’t work as expected. Edge DX supplies system administrators, help desk professionals, and end-users with the necessary tools to do this.
For more information, visit our Unified Communications experience monitoring page or schedule a demo with a ControlUp sales engineer.