
 It’s hard to believe that ControlUp for Desktops has now been out for more than six months! Our customers’ excitement about the product has been fantastic; they love that it is totally SaaS-based (there’s no need to set up any infrastructure), that it can monitor endpoint devices and remote PCs without being on a corporate network or active directory, and that it can automate repetitive tasks on remote devices using a variety of scripting languages (one of their favorite features).
Our developers have been busy making Edge DX even better, but just in the short time it’s been available, it has been gratifying to see the dashboard’s excellent responsiveness with a live customer base. For example, one of our customers was able to collect over 58 thousand device metrics (including Wi-Fi samples) every hour from over 3000 managed devices without any issues at all.
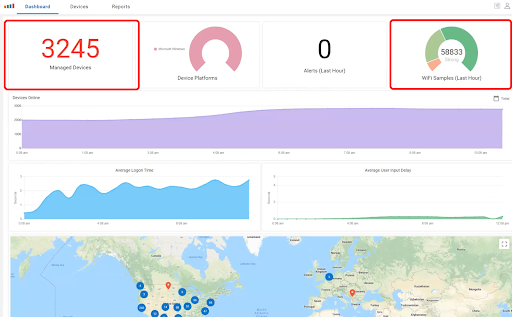
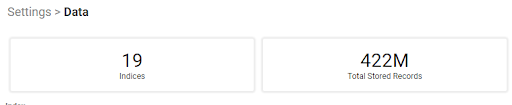
Further, the same customer has hundreds of millions of records, but the dashboard has still been incredibly fast and reports that search those records are near instantaneous.
We have also implemented some new features suggested by our customers. The ones I am most excited about include:
- a native agent installer for macOS users,
- detection of the local internet gateway and the
- collection of local network latency
- collection of BSSID for Wi-Fi access points
- improvements in the information that we collect on GPUs on Windows systems
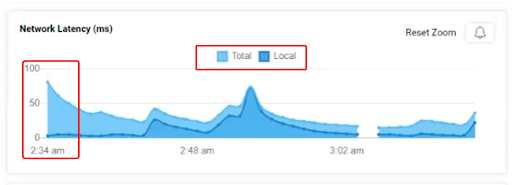
Remote work has brought about some unique support situations. For example, when someone complains about a poor user experience, we need to help them decipher its cause. One of the most common problems is latency in the network, but where in the network? Edge DX can tell you. By comparing the Total Network Latency to the Local Network Latency, we can begin to understand where the problem may lie. The Local Network Latency measures the data transmission time from the device to the local gateway.
In the screen capture below, you can see that at around 2:34 a.m., the user’s total latency approached 80ms while, at the same time, the local latency was close to 5ms (you can hover over a data point to get the exact number). This indicates that the problem was not with the local network, but with something further up the line, possibly the internet service provider or the remote server network.
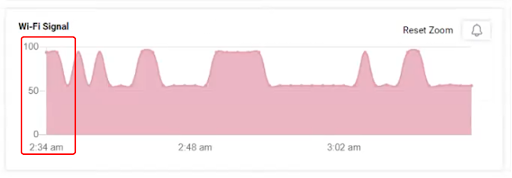
By using the Wi-Fi Signal graph, we can further narrow down issues. The graph below shows that the Wi-Fi signal varied between ~100% and 50%. This could have been due to movement of the device, external interference, or any number of other factors. The important thing is that we know that this could have caused someone to have a less-than-desirable digital experience.
One of the more interesting use cases was solved using another piece of network information that we collect: the Wi-Fi channel that a device is using.
In this case, a small, crowded office was using consumer-grade networking hardware. Their Wi-Fi router was old and only had 13 channels. Many of the devices were using the same channel, which caused network collisions and packet loss. We created a simple script to extract this information from the devices and compared the channels that the devices were on. With this information, we could see that more than half the devices (the ones experiencing “flaky” performance) were all on the same channel.
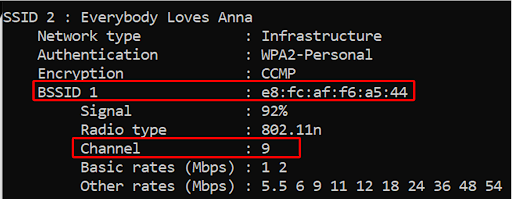
Another interesting Wi-Fi-based troubleshooting issue that a customer was able to quickly solve using Edge DX was in a mesh Wi-Fi topology where the Wi-Fi Access Point had the same name but the BSSID of each node in the mesh had a slightly different Wi-Fi signal strength. Using this information, the customer was able to identify a defective node in their mesh.
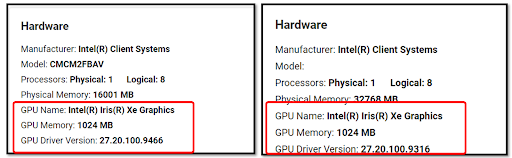
And isn’t just great at troubleshooting network problems. You can also use it to diagnose just about any hardware or software issue. For instance, by using the new GPU information that Edge DX provides, one of our customers has been able to better understand their users’ devices and determine the GPU’s suitability for particular uses, and whether or not the driver was up to date.
The screen capture shows that one device was using the new Intel Iris Xe GPU, which has 1GB of memory and was running the latest GPU driver. The other device, which they were having problems with, had the same GPU but was running a slightly older version of the driver. Once they updated the driver, the problems went away.
NEW Edge DX Scripting Guide
Over the past few months, we’ve had lots of requests for a guide on scripting in Edge DX. So I’m happy to announce the release of the “Edge DX Scripting Guide!“ It’s a terrific reference for information regarding scripts. For example, the usage guide for the UserPrompt.exe executable included with the SIP Agent explains how to display a dialog to the user via an Edge DX script. If you are new to scripting and need a primer on how to get started, you can reference Part 3 of Tom Fenton’s recent article in article Virtualization & Cloud Review: “Hands-on with ControlUp for Desktops.”
Customer Questions
If you ever have any questions about Edge DX, we are happy to help! So recent questions:
- What information does the Missing Patches report contain? Because it uses the built-in Windows Update COM library, it uses Microsoft’s patch database, which only covers Microsoft patches.
- How do I run a Custom Action as something other than the System account? We do not yet have that ability, but we are working on it.
- Can I access a desktop from a script? Yes! You can choose whether scripts run as System or User. Note that “User” is only an option for certain triggers; Custom Actions are only run as System for now.