Introducing the AI Report Dashboard: Complete Visibility Into AI Trends, Usage, and Tools in Your Organization

ControlUp Innovation GuildCustom DashboardsDigital Employee Experience (DEX)

Spot trends, discover your AI champions, and see which platforms drive the most engagement in one clear, dynamic view.

Introducing another ControlUp Innovation Guild solution! This time, we unlock the complete picture of AI in action across your organization! The new ControlUp AI Report dashboard provides real-time insights into how your teams leverage AI, showing how many employees are using AI apps and websites, how much time they spend on them, and which tools are taking the lead.

In this video, Chris talks to Doug and explains in more detail what value customers can get out of these new dashboards:

Why Monitor AI Usage in the Enterprise?

AI has moved from hype to daily utility, with tools like ChatGPT, Microsoft Copilot, and Gemini becoming fixtures in knowledge worker environments. But are your users adopting them? And are they using the right tools safely and productively?

With ControlUp’s AI Report dashboard, you can:

  • Measure organization-wide AI adoption by users and devices
  • Compare app-based vs. web-based AI tool usage
  • See how deeply AI is integrated into daily workflows by measuring time spent on these tools
  • Understand usage distribution to help with training, security, and policy planning
This dashboard titled "AI Usage Total" displays various metrics related to AI usage.The top row shows: "AI Usage - Total Users": 75 "AI Websites - Total Users": 69 "AI Apps - Total Users": 26 "AI Usage - % of Users": A donut chart showing "Using AI" at 79% (blue) and "Not using AI" at 21% (light purple). The middle row presents percentage of time spent: "AI Sum - % of Time Spent": 4.84% "AI Websites - % of Time Spent": 3.79% "AI Apps - % of Time Spent": 1.05% The bottom row provides breakdowns: "Apps vs Website Breakdown": A bar chart showing 69 users for "Websites" and 26 users for "Apps". "Website Usage Breakdown": A bar chart detailing website usage by AI tool: Chat (55 users), Gemini (36 users), OpenAI (13 users), Claude (4 users), Copilot (3 users), and Deep... (0 users). "Apps Usage Breakdown": A bar chart showing app usage by AI tool: Copilot (16 users), Cursor (12 users), and ChatGPT (1 user). "AI Sum - % of Time Spent": A pie chart illustrating "Not In AI" at 95.16% (light purple) and "In AI" at 4.84% (blue).
Figure 1 – AI Usage Dashboard – AI Usage Overview

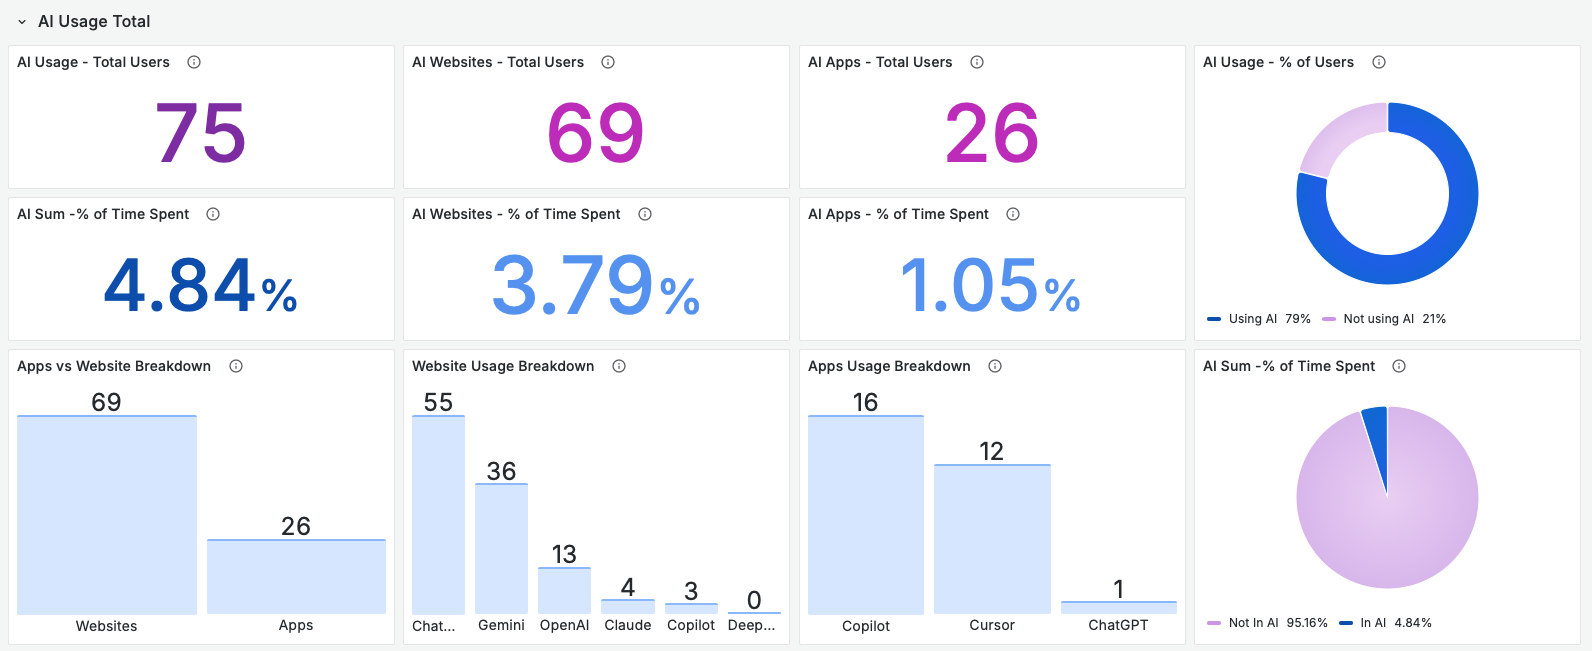
What can you track with the AI Report Dashboard?

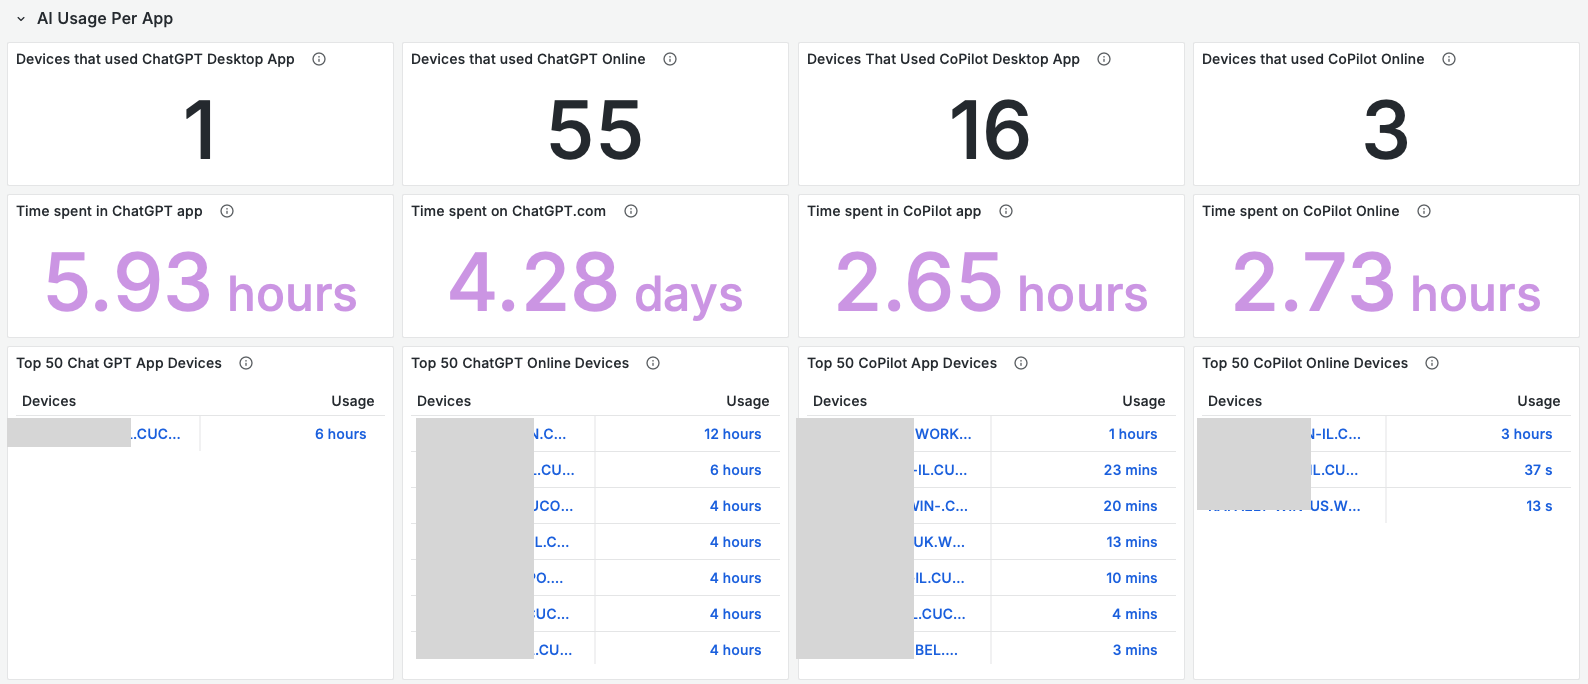
  • AI Apps – Total Users: A stat panel showing how many unique users launched AI applications like ChatGPT, Copilot, and Cursor
  • Top 50 ChatGPT devices: See which devices have spent the most time on ChatGPT.com
  • AI Usage – % of Users: A donut chart visualizing the proportion of users leveraging AI tools versus those not yet onboard
  • AI Time Spent: Metrics showing the percentage of total active time users spent interacting with AI applications or websites, giving you a sense of engagement depth
  • Total Time Spent in AI: A time series graph that shows the amount of time people spend using AI tools. This helps you to track trends between days, weeks, and months

These widgets are fully filterable by device group and tag, allowing you to drill down per department, site, or user cohort.

This dashboard, titled "AI Usage Per App," displays metrics for ChatGPT and Copilot, broken down by desktop and online usage.The top row shows the number of devices used: "Devices that Used ChatGPT Desktop App": 1 "Devices that Used ChatGPT Online": 55 "Devices That Used CoPilot Desktop App": 16 "Devices that Used CoPilot Online": 3 The middle row presents the time spent using each application: "Time spent in ChatGPT app": 5.93 hours "Time spent on https://www.google.com/search?q=ChatGPT.com": 4.28 days "Time spent in CoPilot app": 2.65 hours "Time spent on CoPilot Online": 2.73 hours The bottom row lists the "Top 50" devices and their usage, with specific device names partially obscured: "Top 50 Chat GPT App Devices": Shows one device with 6 hours of usage. "Top 50 ChatGPT Online Devices": Lists multiple devices, with usage ranging from 12 hours down to 4 hours. "Top 50 CoPilot App Devices": Lists several devices, with usage ranging from 1 hour down to 3 minutes. "Top 50 CoPilot Online Devices": Lists a few devices, with usage ranging from 3 hours down to 13 seconds.
Figure 2 – AI Usage Dashboard – AI Usage per App

Prepare for the Future of AI Devices—Track Copilot+ Readiness

Microsoft’s new Copilot+ Devices represent a major evolution in end-user computing. These devices are designed to run next-generation AI features directly on the endpoint, delivering enhanced productivity, personalization, and performance without relying entirely on the cloud.

This dashboard provides an overview of Windows devices, focusing on their readiness for CoPilot and potential upgrade requirements.The top row displays summary counts: "All Evaluated Windows Devices": 93 "CoPilot+ Ready": 20 "CoPilot+ Ready" (Donut Chart): Shows "NO" at 78% (Value: 73, in purple) and "YES" at 22% (Value: 20, in blue). "Total Windows Devices": 94 The middle row details the reasons why devices might not be ready: "Require Replacement Because of NPU": 73 (in red) "Require Windows 11 Upgrade": 0 (in yellow) "Require RAM Changes": 0 (in orange) "Require SSD Changes": 0 (in yellow) The bottom row provides further breakdown: "Number of devices not ready, by reason": A horizontal bar chart indicating "No or insufficient NPU" for 73 devices (in red). "CoPilot+ Ready Devices": A list of device names, all appearing to be related to "CONTROLP.COM" or similar domains.
Figure 3 – AI Usage Dashboard – AI Readiness View

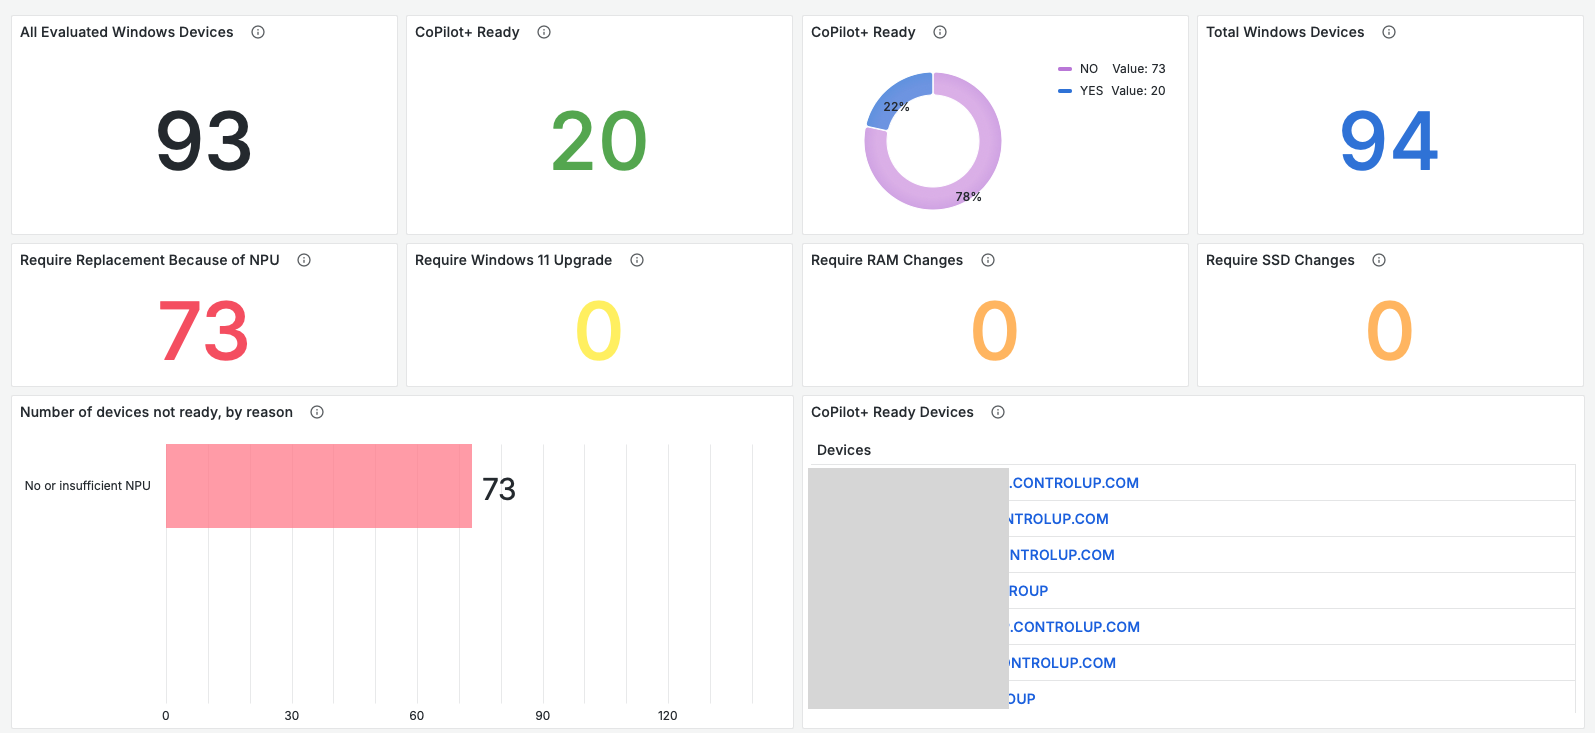
To unlock these features, devices must meet strict hardware requirements:

  • Windows 11
  • 16 GB RAM
  • 256 GB SSD
  • Neural Processing Unit (NPU) with 40+ TOPS (trillion operations per second)

Copilot+ is a game-changer—it powers new on-device AI experiences such as:

  • Recall: Search your past activities using natural language to instantly retrieve files, emails, websites, and app interactions—even screenshots
  • Cocreator in Paint: Generate AI-powered art using prompts directly in Microsoft Paint
  • Live Captions with Translation: Automatically subtitle any audio from any app, with real-time translation
  • Studio Effects 2.0: AI-driven video enhancements like eye contact correction and background blur during video calls, processed locally

Since the NPU is needed for Copilot+  and not upgradeable, knowing which of your existing endpoints are ready is critical for futureproofing.

This dashboard, titled "AI Hardware," displays information about Neural Processing Units (NPUs) in devices.It features four panels: "Type of CPU's in laptops with NPU": A table listing two CPU names and the number of devices for each: "Intel(R) Core(TM) Ultra 7 165U" with 14 devices and "Intel(R) Core(TM) Ultra 7 165H" with 6 devices. "Type of NPU's": A table showing "Intel(R) AI Boost" as the NPU Name with 20 devices. "Devices with an NPU": A large number "20" indicating the total count of devices equipped with an NPU. "Avg. NPU TOP": A large number "48", representing the average NPU Tera Operations Per Second (TOPs).
Figure 4 – AI Usage Dashboard – AI Hardware Details

How can the AI Report dashboard help with Copilot+ readiness?

  • Instantly filter and identify Copilot+ ready endpoints
  • Target non-compliant devices for upgrade or refresh
  • Support executive decision-making for procurement and rollout

Whether you’re piloting Copilot+ devices or planning for mass adoption, this visibility gives your IT team the clarity and control it needs.

Built on Grafana, Backed by ControlUp

Just like our popular Big Screen Dashboard, the AI Report is powered by Grafana and ControlUp for Desktops. That means it’s not only beautiful, but customizable, extensible, and instantly familiar to anyone already using Grafana dashboards.

See our knowledge base article on how to set up the AI Report Dashboard.

Download the AI Report Dashboard here.

Start Monitoring Your AI Landscape Today

With the ControlUp AI Report Dashboard, you’re no longer guessing how AI is used across your digital workspace. You’re measuring, managing, and maximizing its value, all while preparing your fleet for what’s next.

Let AI adoption and Copilot+ readiness become your IT edge—starting now.

Chris Twiest

Chris Twiest works as a Technical Integrations Manager at ControlUp, where he focuses on designing integrations within the ControlUp product and with other technologies to enhance its capabilities and effectiveness. With two decades of experience as a consultant managing, creating, and automating workspace environments, he has a deep understanding of customer workflows. He is passionate about integrating products and data to meet specific customer needs and deliver optimal solutions.