
ControlUp has the built-in ability to allow you to manage and monitor your NetScaler appliances with all their services and components, so that you can see their real-time performance metrics and identify issues and abnormalities.
But what about analyzing your NetScaler usage trends? The existing NetScaler reporting methods can be cumbersome, and so we at ControlUp have decided to step up and introduce new NetScaler reports to allow you to easily access all that information in the simple, straightforward manner you are already familiar with if you have ever used our historical and analytics portal, ControlUp Insights. Everything is user-friendly, interactive and responsive, and the data you need is easily accessible. Let’s have a quick tour and see what these new reports offer.
The NetScaler reports are divided into three sections, NetScaler, Load Balancing and Gateways, each with their respective breakdowns, showing you the health, performance and various behavior trends for your NetScaler ADC appliances and its Load Balancing and Gateway services, over any selected period of time. Let’s explore.
NetScaler
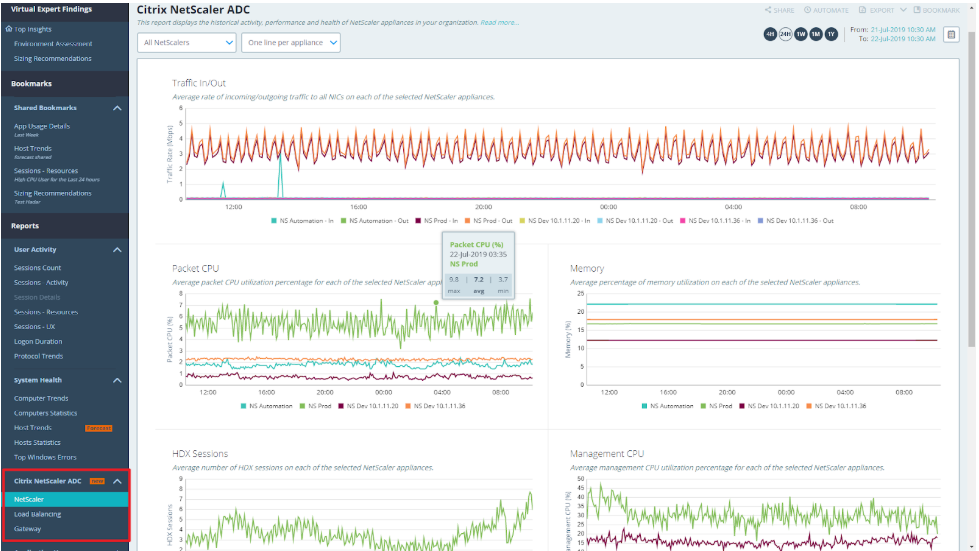
In the NetScaler report, you have the traffic in/out metric which shows the average rate of incoming/outgoing traffic to all NICs, the packet CPU showing the average packet CPU utilization percentage, memory utilization, usage of management CPU and HDX sessions that displays the trend of HDX sessions connected through the appliance during the selected time frame.
At the bottom of the report you’ll find a detailed summary of all the NetScaler ADC appliances’ data, complete with config info so that you could check the history of configuration changes and when the latest configuration changes happened.
As in any other Insights report,you can hover your cursor above any data point to see the details of that specific point and drill down to the specific NetScaler ADC appliances for more details.
The report will allow you to quickly find the answers to questions such as these:
- Which NetScalers ADC appliances were available during the selected time period?
- Are enough NetScalers ADC appliances deployed in the organization for our current load?
- Does NetScaler ADC appliance X have a powerful enough CPU for its workload?
- Is the workload shared evenly among the organization’s NetScaler ADC appliances?
- Were there any configuration changes on my NetScaler ADC Appliances and when did they occur?
- Is NetScaler ADC appliance X itself causing bottlenecks?
Load Balancers
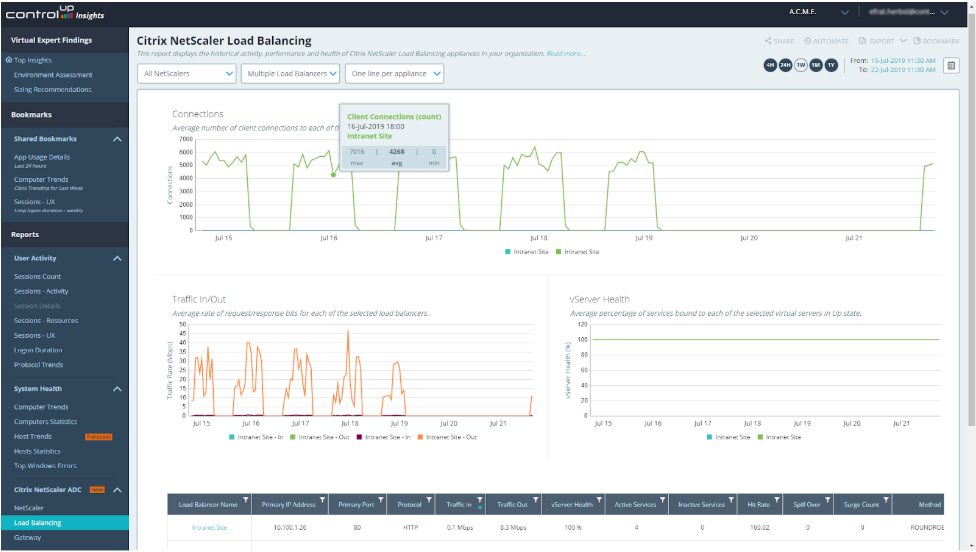
Next, we have the load balancing section, where we get detailed information on the trends happening in our load balancing virtual servers. First we have our connections, showing the trend of client connections to each of the selected load balancers. Next, there’s the traffic in/out which displays the average rate of request/response bits for each load balancer. Further down we have the vServer health which shows us how healthy the serving services and service group members have been during the selected time frame. At the bottom, you’ll find a table with the consolidated performance data for your load balancers.
This will enable you to swiftly answer questions such as:
- Should we add more capacity to serve the requests coming to the Load Balancers?
- Are the Load Balancers dividing the load among the virtual servers optimally?
- How many requests does Load Balancer X usually handle during business hours?
- Are my Load balancers’ traffic and behaviour influencing my user experience?
Gateways
And finally we arrive at the Gateways section, where we can see the concurrent users showing the total number of user connections to the specified gateway services, the traffic in/out displaying the total rate of request/response bits for the selected gateway services as well as the request/response rate, showing us the total rate of requests/response for the selected gateways. At the bottom you’ll find a table showing all the stats and performance metrics for your gateways, including the certificate name and expiration date – very useful.

With the Gateway section you could easily answer questions like:
- Can my NetScaler ADC appliance handle the amount of connections to its Gateways?
- How many users does Gateway X usually handle during a selected time period?
- How responsive are the gateways to my user requests? Are there delays at specific times?
Monitoring your NetScaler ADC appliances with ControlUp makes NetScaler ADC management easy and intuitive, but with the addition of the NetScaler ADC reports we are proud to give you a well rounded monitoring and management solution to encompass real time monitoring as well as trend analysis in order to make better decisions regarding your capacity and hardware needs, knowing the actual loads and traffic going through your infrastructure and detecting weaknesses and anomalies that may require your attention, all within the easy to use ControlUp Insights interface.
Haven’t used ControlUp Insights yet? Get a free trial now on the ControlUp website.