
A major new feature with ControlUp 8.1 is scalability of the real-time monitor for up to 100,000 machines!
The Challenges of Scaling in Real-time
ControlUp is a unique product in that it collects information in a 3-second cadence. I’m going to take a step back and talk about the challenges of collecting information at this speed.
Let’s start by looking at the data ControlUp collects.
ControlUp collects information from different data sources. One data source is hypervisors such as VMWare ESXi, Nutanix AHV, Citrix XenServer and Microsoft’s Hyper-V. Another data source is EUC environments like your Citrix Virtual Apps/Desktops or VMWare Horizon environments. Lastly, we collect information from machines which have the ControlUp agent installed. Machines with the ControlUp agent provide computer metrics plus user session and processes metrics.
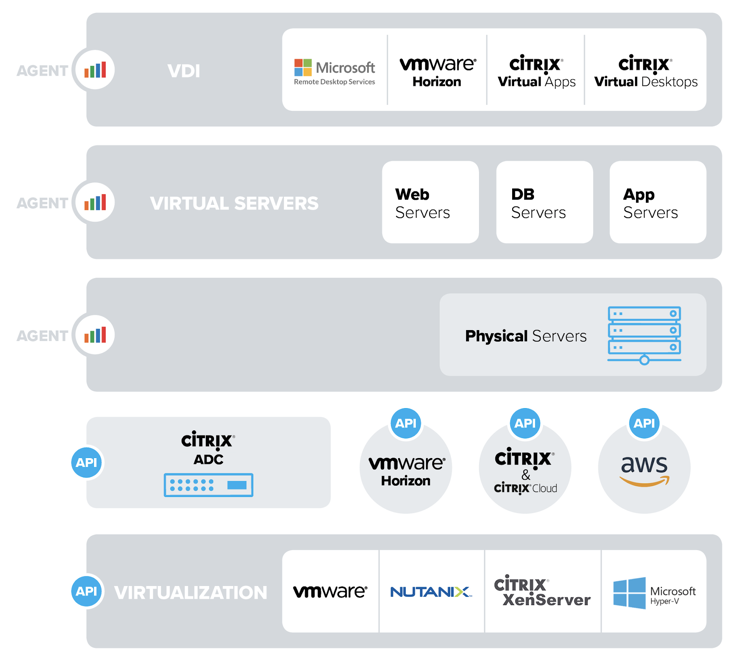
All data collected by ControlUp is aggregated to a single object. This is actually a complex task as ControlUp needs to evaluate multiple properties to ensure the objects are related, establish links between related objects, and format the data for presentation. The result from this complex series of tasks is that you can then see how your environment is performing from the hypervisor level down to machine level, down to the session level, and finally to the process level.
Collection of all of this information consumes resources where the console and the ControlUp Monitors are being run. The data collected is stored in a in-RAM database–the more data, devices and objects (hypervisors, EUC environments, machines, sessions, and processes) involved, the more memory ControlUp uses. Formatting and displaying the data consumes CPU–and the more data, the bigger the CPU consumption.
Lastly, the more connected devices involved, the more Windows resources are consumed. Why? ControlUp is a heavily multithreaded application with each network connection consuming Windows resources such as TCP sockets and the like. These are not unlimited though, and the more devices we ask the ControlUp Console or Monitor to observe, the more Windows resources are consumed.
These are not ControlUp limits per-se, but limits of today’s technology. Processors, memory and the architecture of the Windows server operating system that ControlUp runs on have constraints that also constrain ControlUp.
What’s the Limit?
That’s a hard question to answer.
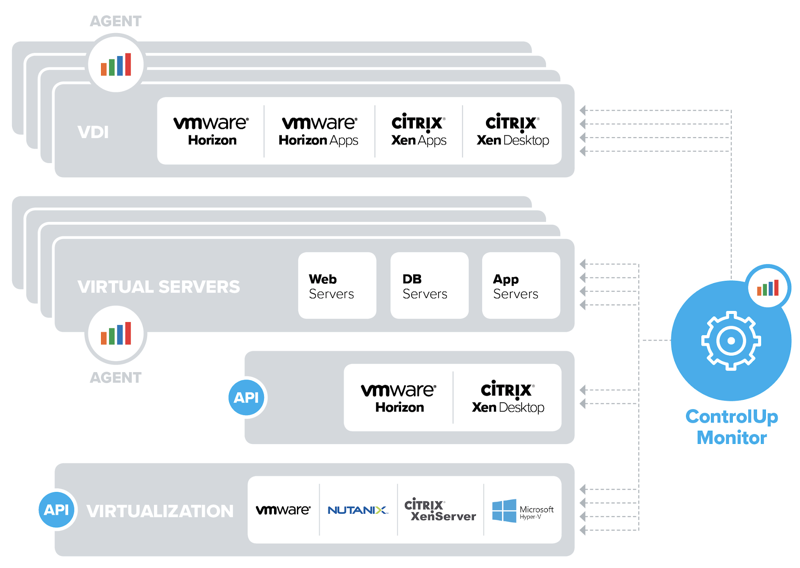
If you are collecting hypervisor statistics, EUC environment metrics and agent metrics, then the number of devices you can monitor at any one time is reduced due to the challenges listed above. With ControlUp 7.4, we recommend a limit of around 5,000 devices. This is due to the 7.4 architecture utilizing a single monitor instance to attempt to monitor all resources.
While building ControlUp 8.1, we spent significant time and resources to ensure we could break these barriers. We did it by rearchitecting how the ControlUp Monitors operate. In ControlUp 8.1, the number of devices a single monitor node can observe has been reduced slightly to roughly 4,000 devices… but now we can “scale out”, meaning that we can add more monitor nodes as needed to cover the biggest environments.
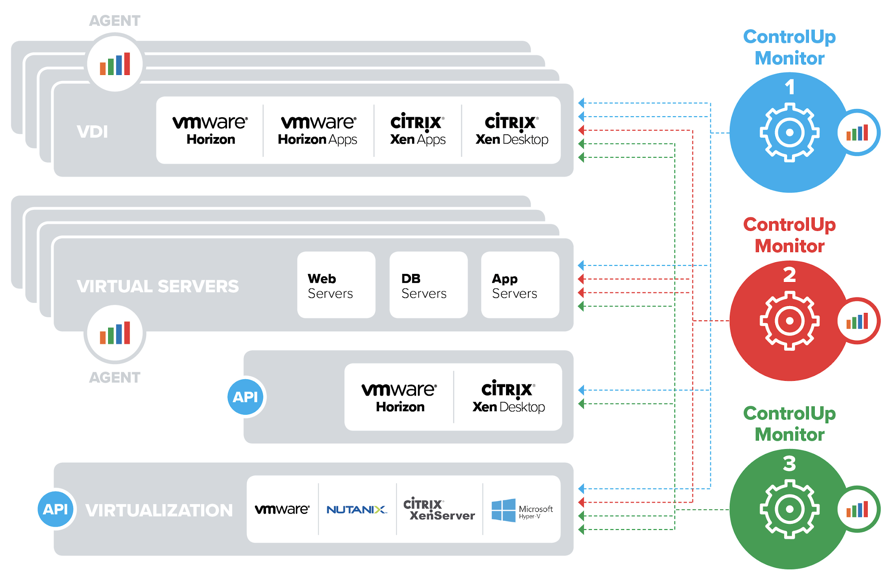
ControlUp 8.1 introduces the concept of clustered monitors. When you scale out the ControlUp monitors they automagically work together in a cluster. The clustered monitors have intelligence built into them to self-configure and self-assign resources. If one monitor goes down then those objects will automatically be picked up and shared among the remaining monitors.
For ControlUp 8.1 detailed sizing guidelines, click here.
In addition to scaling out, ControlUp clustering can be defined by logical or physical boundaries called Sites.
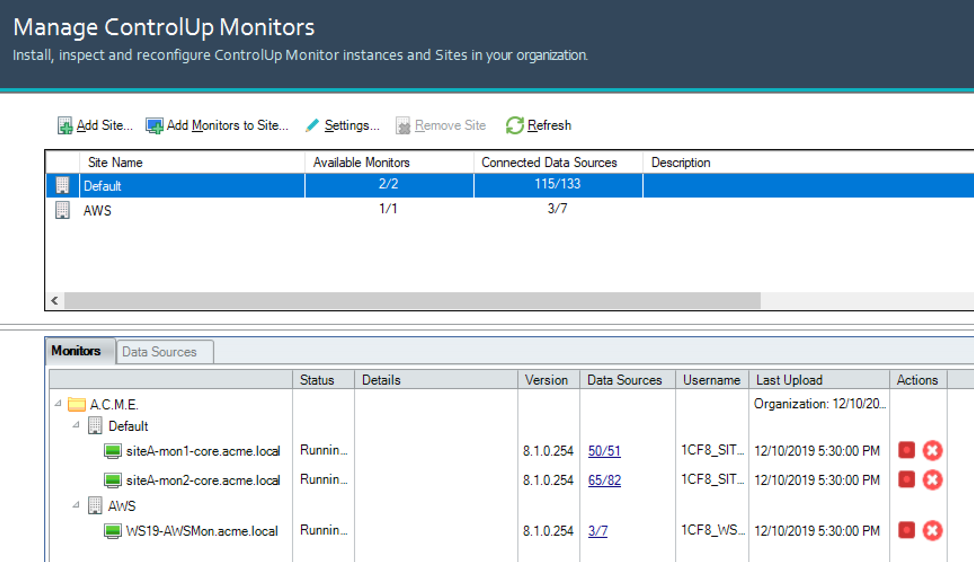
A Site ensures that things like network traffic can be segmented by datacenter, keeping everything local.
We devoted extensive work and time to ensure that Sites operate automatically and transparently to make this one of the easiest features to add to your environment.
Set up Clustered Monitors
To set up a monitor cluster, watch this video.
With much intense thought and some imaginative rearchitecting, ControlUp 8.1 delivers high scalability without losing the simplicity and ease of use you know and love.