
Visibility isn’t one-size-fits-all. Every organization, environment, and user is unique, which is where static dashboards often fall short. In order for data to make a difference and deliver truly actionable insights, visualization needs to be customizable and tailored to your environment.
This is why we are pleased to announce that ControlUp Dashboards has reached general availability. It’s now fully supported and available for all ControlUp for Desktops customers, as well as anyone with an active ControlUp ONE trial license. This flexible, powerful new capability empowers IT to turn data into a clear, actionable picture of your environment.
With this new feature, not only can you see your data exactly how you want, but it’s accessible to users across your organization. You can use pre-built dashboards, customize existing views, or create completely from scratch for total visibility, tailored to you.
Moving from Beta to Fully Supported GA
Last month, we announced the availability of ControlUp Dashboards in beta—and the response was overwhelming! We’ve heard from customers who have already used it to quickly identify a software update that caused app crashes, or to see devices with high latency or low WiFi strength.
The general availability brings a few key changes to improve usability, onboarding, and experience:
- Getting Started Experience: When you launch Dashboards, you will now see onboarding resources to help you get up to speed and become an expert quickly.
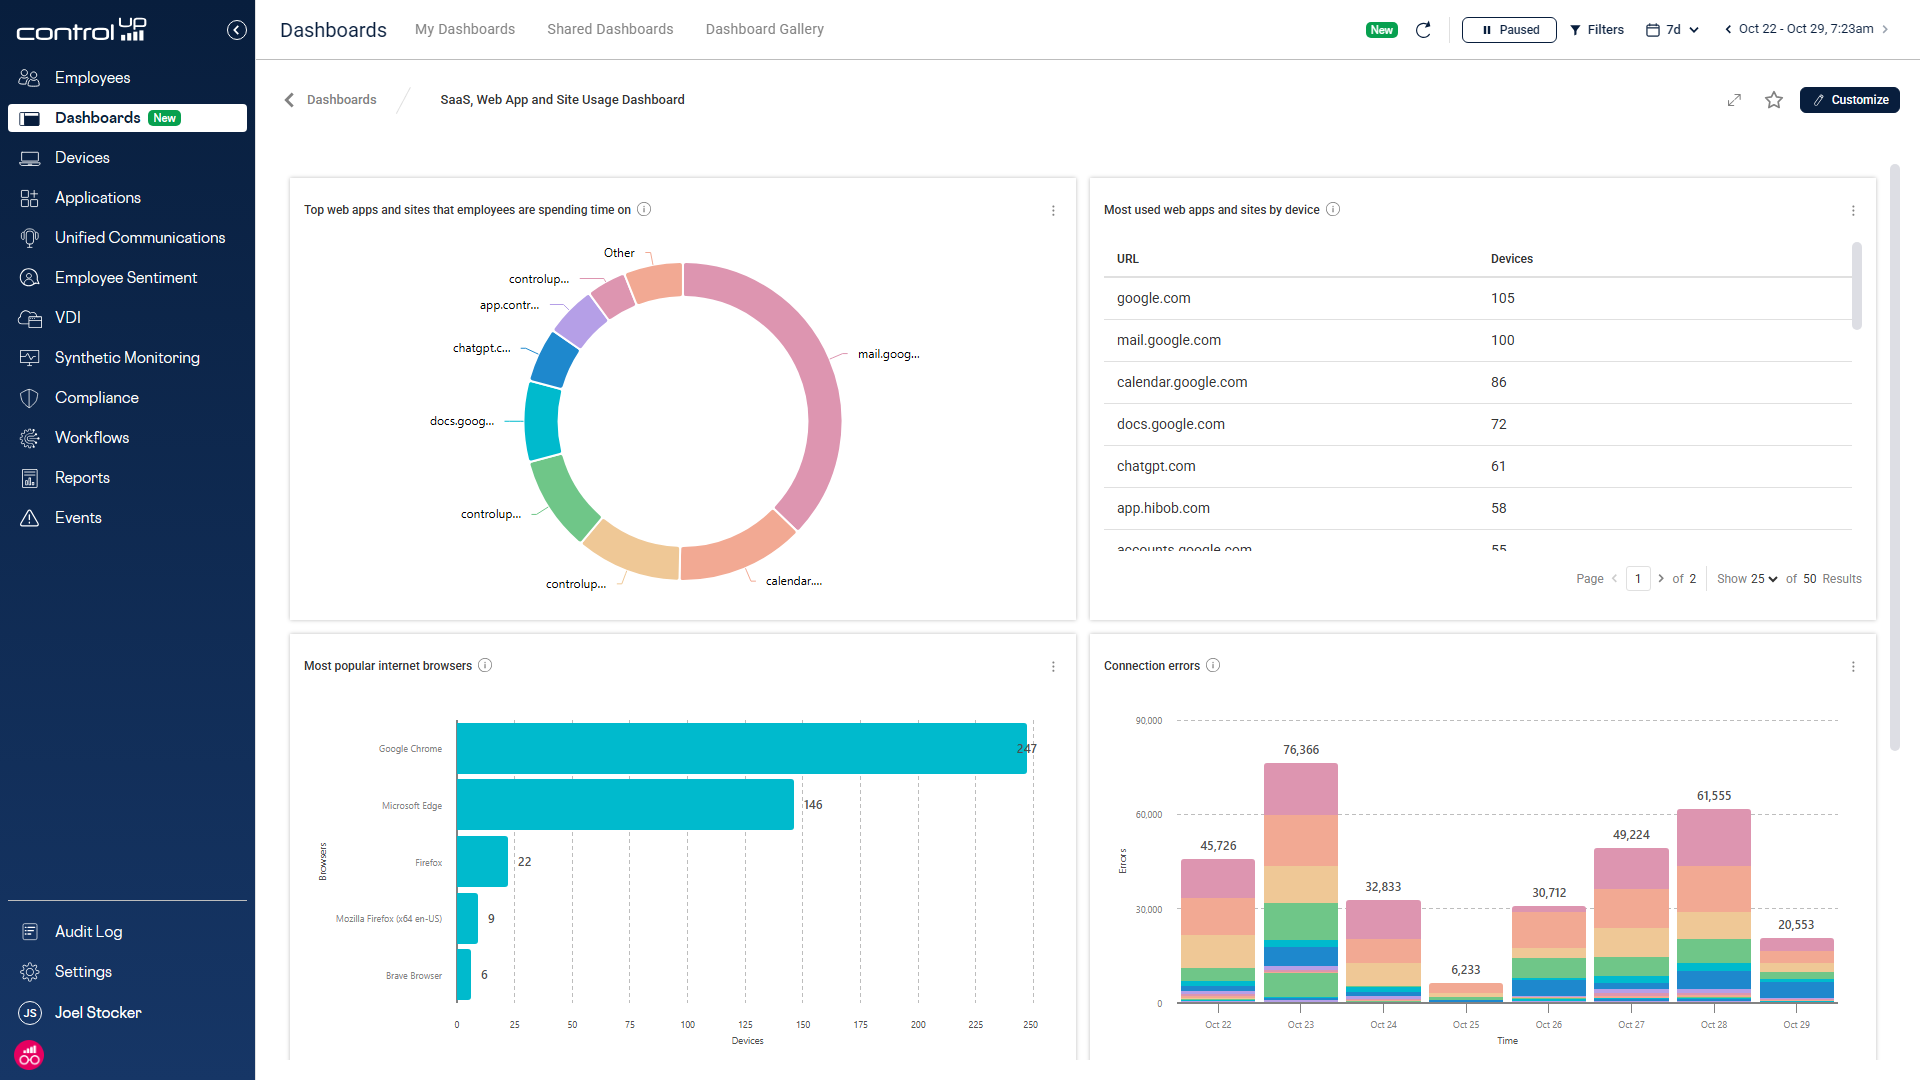
- Dashboard Gallery 👀: This view of pre-built dashboards displays all the information you need right on the screen. You can view a dashboard as-is, customize it which creates your own personal copy allowing you to add or remove widgets, customize widgets both visually and data-wise, change the dashboard or widget names (e.g. if you want to localize it in your language ), and you can share your custom dashboards with just the click of a button.
- Usability Improvements: We have updated some visual elements, buttons, and flows to make Dashboards easier to use.

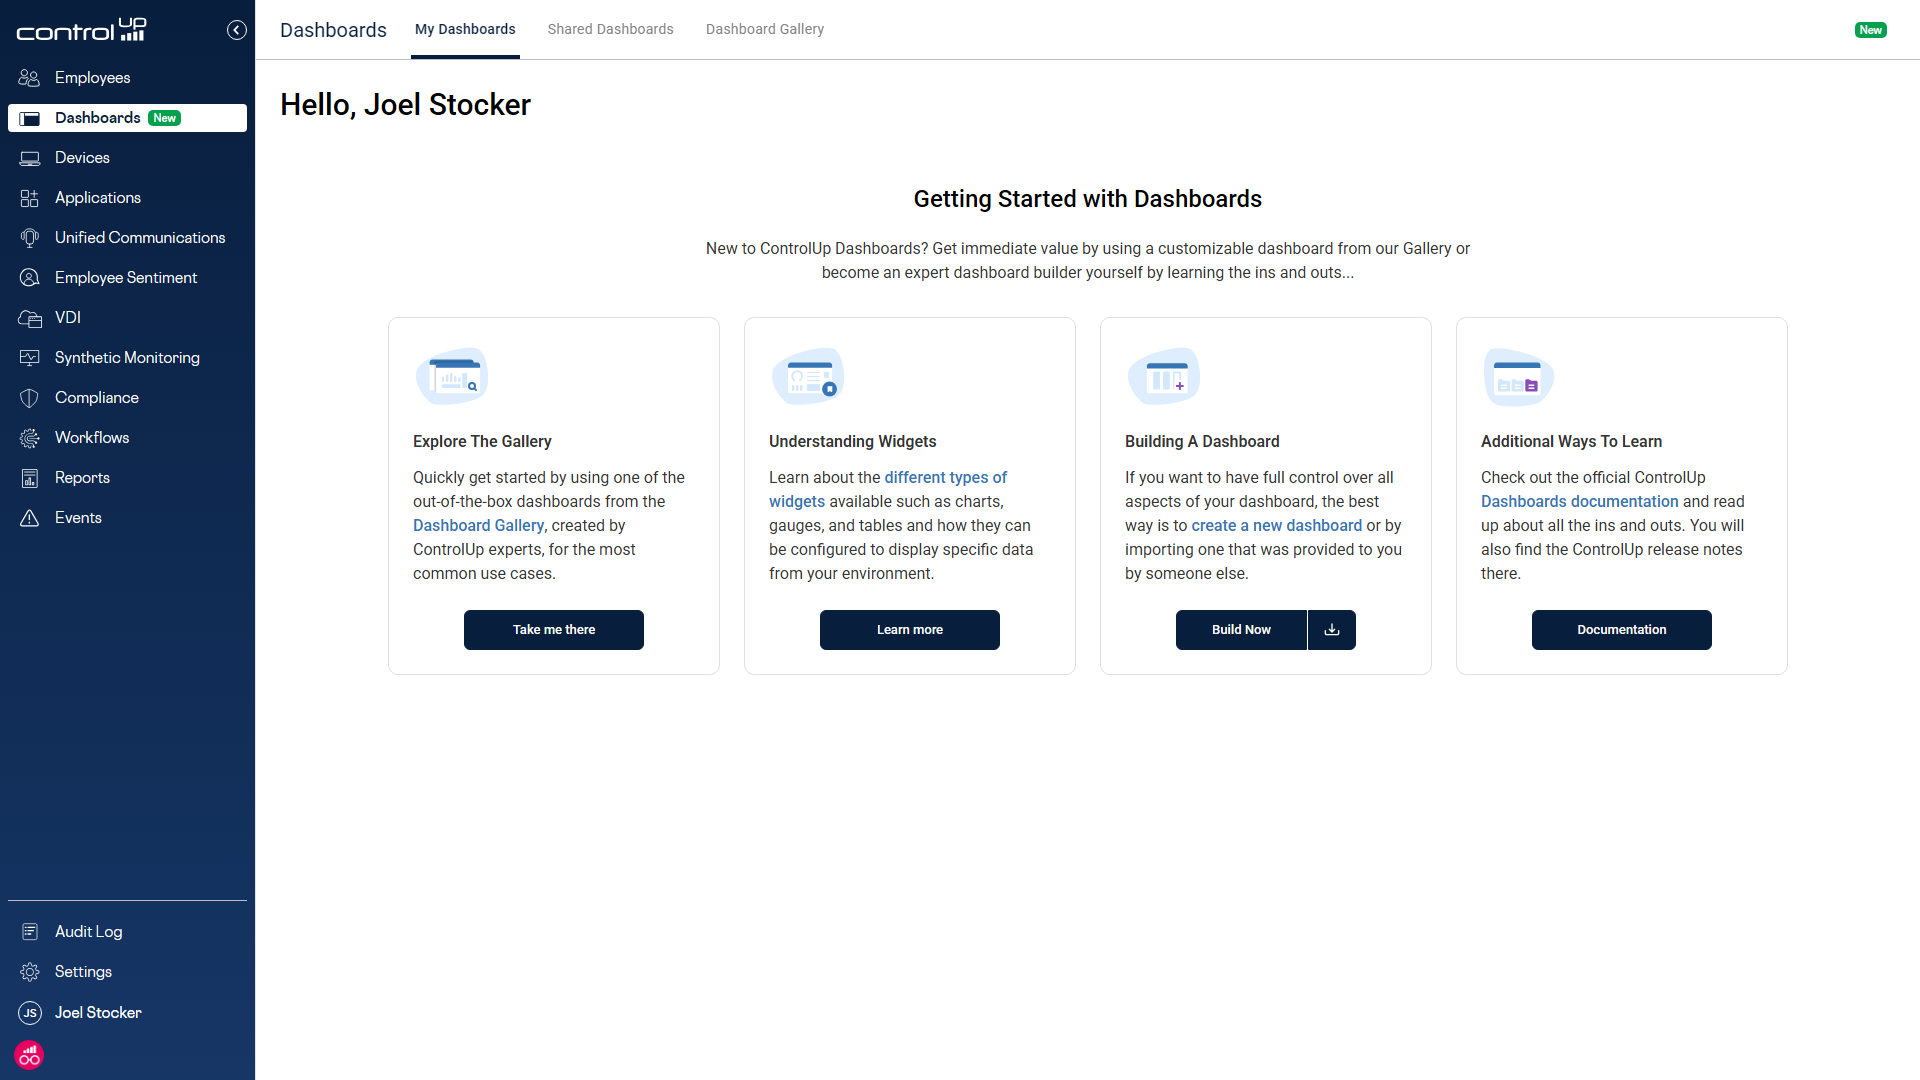
Figure 2 – Getting Started Experience: New users are greeted with clear onboarding guidance directly in the Dashboards view, featuring links to Explore The Gallery, learn about Widgets, and access full Documentation to quickly become experts.
Insights at Your Fingertips, No Matter Your Role
When building ControlUp Dashboards, it was important to ensure that powerful insights were accessible across all levels of the organization, from IT administrators to CIOs. This is why there are several different levels of customization for dashboards.
- Pre-Built Dashboards: You don’t need to start from scratch. We have 14 out-of-the-box views that you can use, including Device Inventory and Microsoft Copilot+ Readiness. These deliver immediate value without configuration and can serve as a foundation for quick onboarding.
- Customize Existing Dashboards: You can also use our existing dashboards as a starting point to duplicate, customize, and share. This allows you to add widgets, arrange layouts, and build views to match your workflows, without starting from scratch.
- Create Your Own: For anyone who wants to create a view that is completed tailored to their use case, you can build dashboards from the ground up. You can build powerful widgets, choose your layout, and create interactive variables.
The Features That Deliver Complete Flexibility
Every environment is different—and now your dashboards can perfectly reflect that. With these robust features, you have the granular control to tailor your views, shape your data, and deliver exactly the right insights to the right people:
- Widget Builder: Shape your data to meet your needs. You can pull data from any ControlUp for Desktops data index to apply aggregations, groupings, filters, and math transformations.
- Choose Your Visualization: ControlUp Dashboards supports simple Stats, Gauges for thresholds, Time Series for trends, or Table, Donut, and Bar charts for comparisons.
- Interactive Variables: Define variables (like device name, OS, or application) and use them as filters across multiple widgets to switch your entire dashboard view with a single dropdown. We event have introduced a filter for variables allowing for NOT, OR and
- RAW Viewer for Transparency: Inspect the data behind every chart, see the underlying query, or export the raw data to CSV for use in external tools like Power BI, Grafana, or Postman.
Innovation Guild Content: Community Power, Fully Integrated
The ControlUp Innovation Guild has been experimenting with new ways to visualize data, producing valuable views like the Big Screen Dashboard for NOCs and help desks, and specialized views for capturing AI use. With broad availability of Dashboards, the best of this community-driven intelligence is now fully supported and integrated directly inside the ControlUp ONE Platform. This means no extra tools, no manual setup, and no additional effort—just open, explore, and instantly deploy proven dashboards.

Adoption is Simple—Start Using ControlUp Dashboards Today
Are you ready to experience the power of custom data visualization?
If you are a current ControlUp for Desktops customer or have an active ControlUp ONE trial, simply log into the interface and click the Dashboards icon to begin building your custom views.
To help you turn data into a clear, actionable picture of your environment, we have you covered:
- Documentation: Find plenty of detailed guides and resources in the Knowledge Center.
- Community: Join the ControlUp Community today for peer support, tips from experts, and to discuss new use cases. And we recently started a video series called “Widget Wednesday” which are short videos that we post each Wednesday in which an expert will go over one of the pre-built widgets or chart types
If you are new to ControlUp, you can request a personalized demo or start a ControlUp ONE trial today!