
ControlUp proactive synthetic monitoring is a cloud-based solution that allows IT teams to identify potential outages and performance hiccups before they degrade the digital employee experience.
When people actively interact with their digital workspaces and applications, ControlUp’s solutions for real-time monitoring, troubleshooting, and remediation can help IT teams improve people’s digital employee experience.
But what if we could prevent performance-related or functional issues before real users encountered them in the first place? Ideally, we use proactive synthetic tests that mimic real user activities and continually measure the quality of selected services for expressly this purpose. ControlUp proactive synthetic monitoring is a cloud-based solution that allows IT teams to identify potential outages and performance hiccups before they degrade the digital employee experience.
In this blog post, you will learn how ControlUp proactive synthetic monitoring works and the four major IT administrator use cases that showcase why you need it.
How ControlUp’s Proactive Synthetic Monitoring Works
Why only test in production when we can also test in staging or when no real users are logged in? A synthetic user process is implemented as a client component or an agent (aka “Scout”) that connects to a remote service or application, runs synthetic tests, and monitors metrics representing availability and health. The tests can be configured to monitor the availability and health of various applications and services The metrics collected during the synthetic test runs are continually transferred to a fully managed cloud application with a web console (= “Scoutbees” dashboard in Solve) where they are processed for visualization, proactive analytics, and alerts. The web interface also provides all options for configuring client locations (aka “Hives”) and test settings.
The ControlUp proactive synthetic monitoring client component gives you maximum flexibility as you can run tests from one or multiple locations that suit your needs in the best way.
- Test from the cloud: Deploy across the globe without the need to provide the necessary infrastructure. Designed for probing external resources. ControlUp-managed cloud infrastructure is available in the Americas, Europa, Australia, East Asia, and India.
- Test from the datacenter: Deploy in your own datacenter, which comes with tighter security. Designed for probing both internal and external resources.
The test target categories supported by ControlUp synthetic testing are EUC environments, network resources, and SaaS and web applications. There are wizards to make complex configuration challenges easy.
Use Case #1: Use a health score generated by periodic simulated user logins to track the quality of your EUC resources
The focus of the End-User Computing (EUC) environment synthetic monitoring category is on testing the availability and health of published EUC resources. Basically, it’s monitoring attempts to complete EUC-specific transactions, such as connecting to a session broker, logging in to a user session, opening an application, and logging out.
Target EUC environments are:
- Citrix DaaS (or its on-prem counterpart, Citrix Virtual Apps and Desktops or “CVAD”), ADC Gateways and Citrix Cloud Gateways
- VMware Horizon, Horizon UAG, Security Servers, and VMware Workspace One
- Microsoft Azure Virtual Desktop
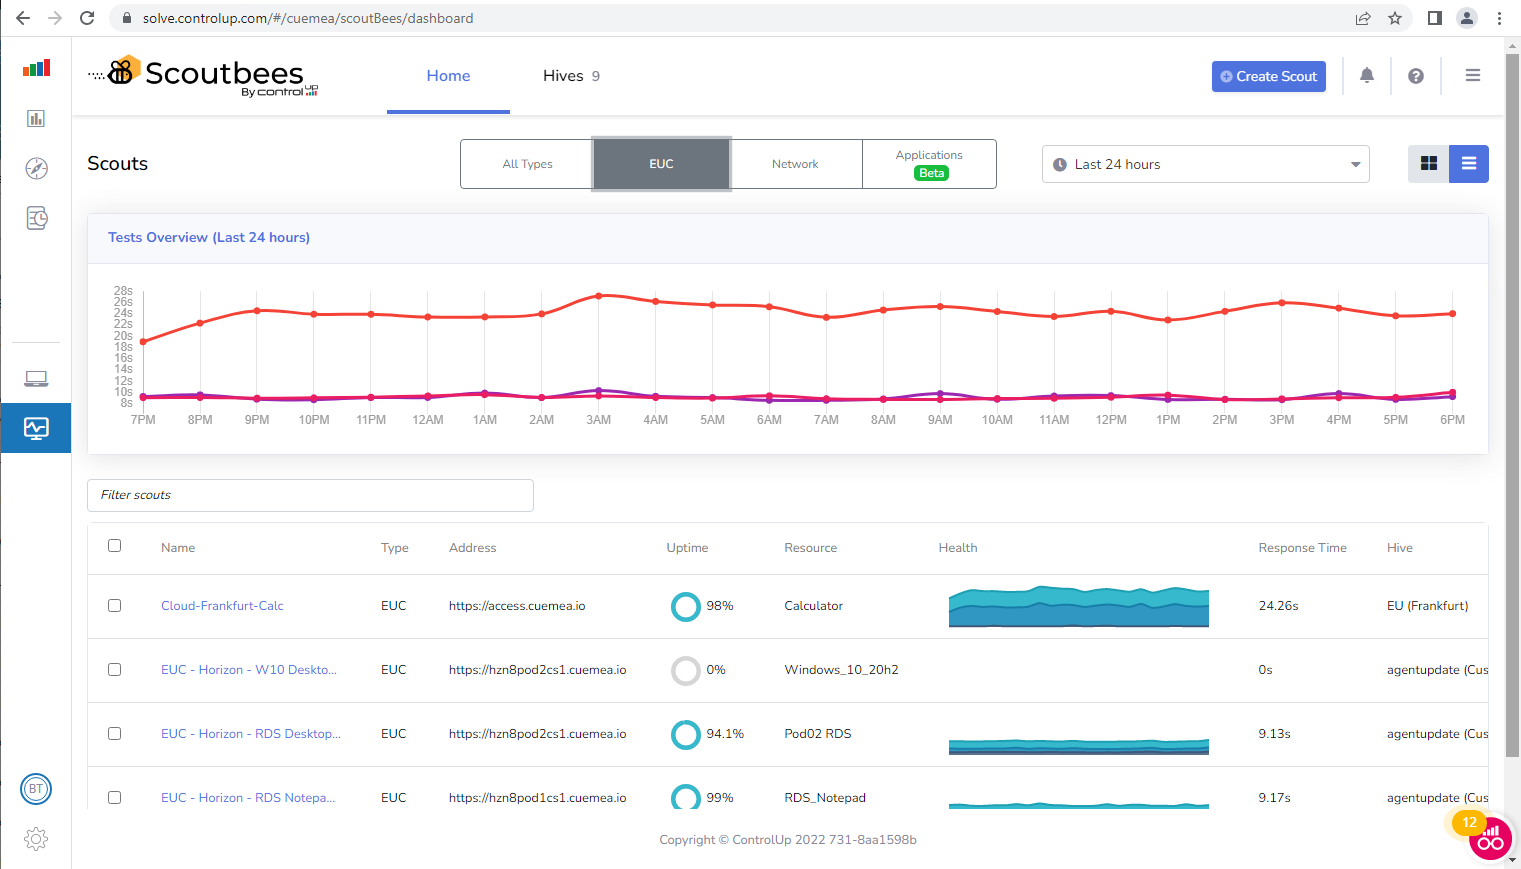
Among the chief benefits IT teams get from the EUC environment test overview dashboard are the insights into the health of multiple remote desktop environments in a single page. The dashboard visualizes the metrics that represent the performance experienced by synthetic users that log on to various types of digital workplaces. Logon cycles are every five, 15, 30 or 60 minutes with a time range of visualized data from the last 12 hours to several days. In addition to the overall health score of each EUC resource, the overview metrics include uptime, time to connect, time to session ready, average response time, and connection success rate.
Drilling down into individual datasets show load time statistics, logon performance metrics, network latency, and network paths. The details dashboard also shows screenshots from all successful and failed tests. You can use the baseline session screenshot feature to compare a screenshot from an EUC session to a known baseline screenshot.
In remote desktop scenarios, user authentication is required for a test run. There are multiple authentication options supported out of the box: SAML Single Sign-On (SSO), LDAP authentication and Multi-Factor Authentication (MFA).
A typical use case is continuously testing the quality of remote desktop connections in site-to-site or HQ-to-subsidiary scenarios, which is exceedingly difficult to do without ControlUp’s proactive synthetic monitoring.
Use Case #2: Ensure your most important infrastructure resources are working properly by probing them continuously and providing performance metrics
For a solid and reliable network infrastructure, IT teams need to ensure their resources are routinely tested. A synthetic network probing mechanism provides information about the quality of the network resources or service under test. The result is an objective, independent view of important network aspects, allowing for proactive risk management, service level agreement monitoring and getting valuable insights into the state of the network.
This test target category performs general network tests:
- Probing availability of network resources, such as gateways, file shares, or print services with Ping and Traceroute
- Check name resolution performance of DNS servers
- Using Get or Post methods to access target websites through HTTP or HTTPS
- Check tenant authentication using Microsoft Azure AD
- Execute shell commands with arguments and capture completion time and exit codes
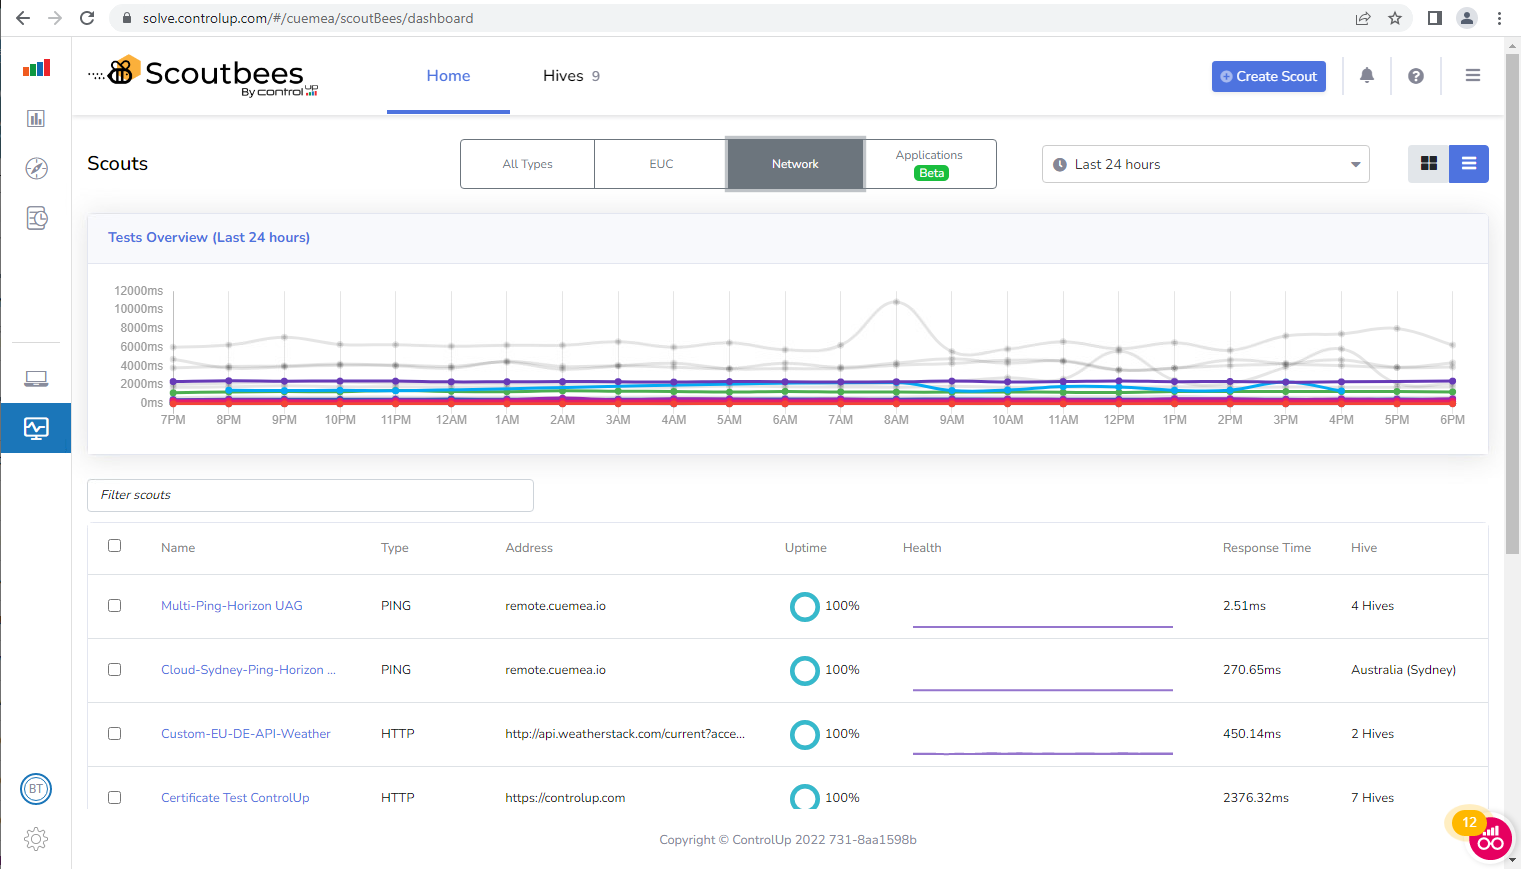
The benefit of the network resources health dashboard is that it shows an overview of uptime, response time, and success/failure rate of multiple network tests in a single pane. In addition, it provides insights into network details, such as availability, average response time, latency by location, average load time, DNS response time, and network paths.
Probing IT infrastructure resources helps IT teams quickly respond to service failures, prevent outages, make it easier to solve problems, manage growing network requirements and identify security threats.
Continuously checking the quality of central internal Exchange or DNS services is a popular use case among ControlUp customers.
Use Case #3: Monitor your SaaS and web application health by sending simulated user requests to the underlying services
The SaaS and web application category in ControlUp’s proactive synthetic monitoring solution regularly tests functionality, response behavior, usability, and performance of selected internet services. The benefit of this category becomes obvious when using templates of popular SaaS and web applications for focused testing without distractions, and detecting broken links as soon as possible.
Test target types of this proactive monitoring category are:
- Test availability of popular SaaS application backends, such as Microsoft Office 365 (Salesforce and Google Mail coming soon)
- Site load test to measure a website’s performance based on configurable content
- Soon, measuring performance of Unified Communication services, such as Teams, Zoom, and WebEx will be added.
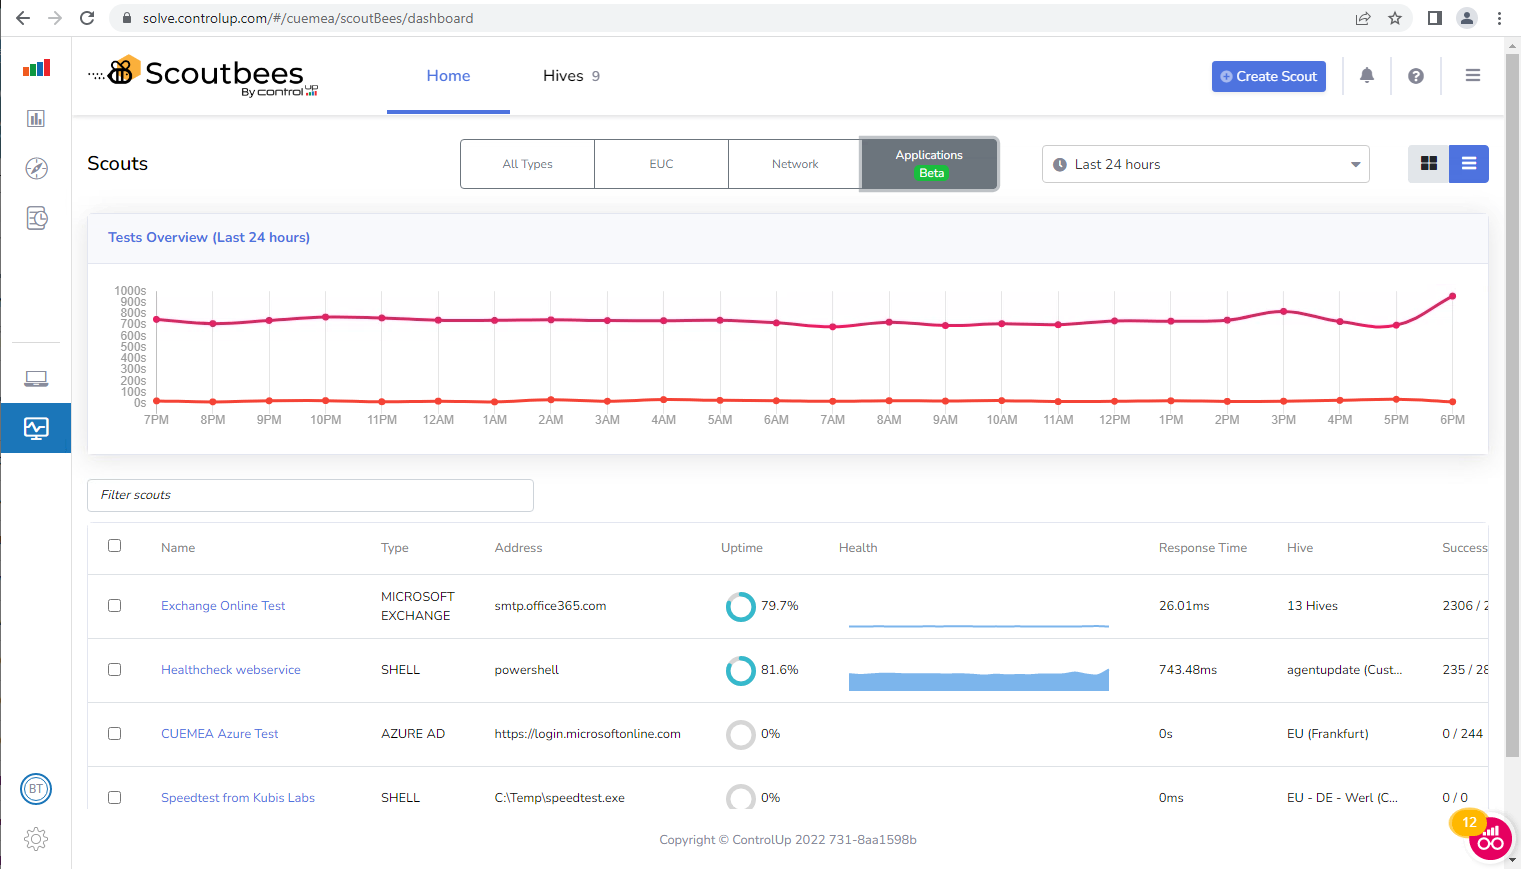
The overview dashboard shows the health of app resources, uptime, and success rates. Application-specific test results may include SMTP, POP, IMAP, Free Busy and Autodiscover average response times.
Use Case #4: Configure an alerting mechanism that notifies IT teams about outages and performance issues before real users are affected
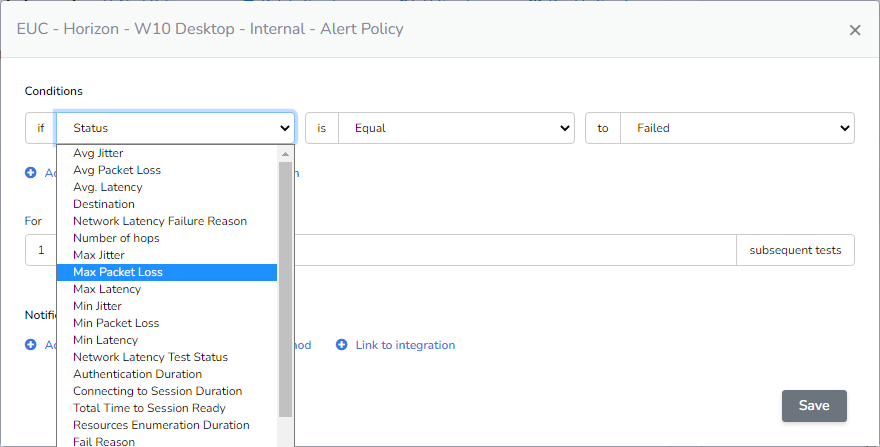
Alerts sent out by the ControlUp proactive synthetic monitoring cloud application drive the IT administrator notification process. Extendable reports allow for further analytics of conditions that existed at the time an alert was produced. The alert policy includes performance thresholds, system events, and configurable logic based on Boolean algebra, static resource strings or destination strings. Thresholds can be based on a spectrum of performance metrics collected throughout each synthetic test run.
- EUC environments: Create alerts based on a range of additional metrics, such as authentication duration, resource enumeration duration, session initialization duration, average response time, group policy processing, network round trip time, latency, packet loss rate, jitter, and number of network hops.
- Network resources: Network driven alerts, using conditions such as connection time, total duration, redirect time, response time and size, handshake time, time to first byte, and certificate expiration date.
- SaaS and web applications: Send alerts on performance degradation or outage duration. Check and alert based on average response time, exit code, fail reason, response and status strings, header values, organization query duration, jitter, and many more.
Notification methods for alert messages include email, webhook and third-party integration methods for ServiceNow or Microsoft Teams. Using such notifications for tracking down a sporadic local outage or even a broader global service outage are typical use cases.
Summary
If you want to know, proactively, how well (or poor) the digital workplaces in your IT environments perform, then ControlUp’s synthetic testing is your ideal companion. By establishing synthetic connections to various types of remote desktops in your EUC environment, probing different network resources and constantly testing the performance of selected internet apps and services, IT teams can learn about quality degradation at a very early stage, which gives them the time to fix problems before they affect real users.
It is important to note that ControlUp proactive synthetic testing does not require any changes in the back end or in the target components. This is a mandatory prerequisite when you want to include public cloud or encapsulated internal IT services into your synthetic testing processes.
For those who want to embed ControlUp proactive synthetic testing into their own QA or SLA processes, there is an open API that allows you to create tests, read results, and integrate with third-party systems.