Traceroute is one of the great unsung tools that system administrators can use to, as the name implies, trace the route of a network packet between two different systems. This information is dead useful for spotting and isolating issues within your internal and external networks, so you can improve physical endpoint and application performance, as well as overall end-user experience. To make it easily accessible, ControlUp for Desktops collects traceroute information from multiple sources and displays it in an easy-to-understand graphical format.
About Traceroute
The internet was designed to be stateless. In other words, the path a packet takes from one system to another is not set; it is up to each router (node) that it passes through to direct it to the next router in order to get to its destination. This process makes a network both more reliable and more scalable: reliable in the sense that if a node goes down, the packet can be rerouted to a different node; scalable in the sense that if a node gets too much traffic and the latency increases—or if too many packets get dropped between nodes—the packets can be re-routed to a different node. While the stateless nature of the internet has proven to be extremely robust, issues do pop up on occasion that we need to be aware of. This is where traceroute shines.
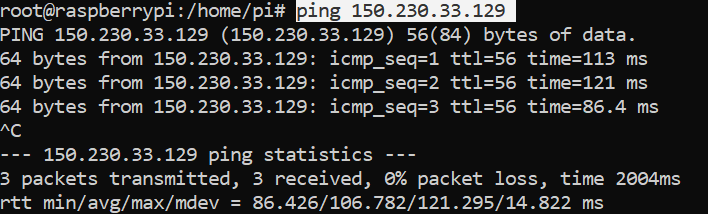
If you use ping to see the latency to a remote host, you can see how long it takes a network packet to get from one system to another.
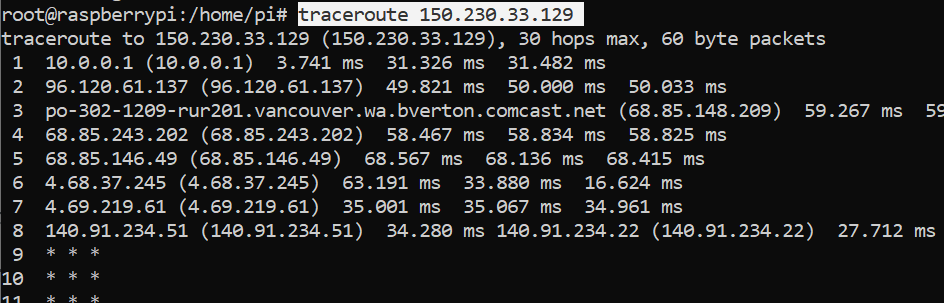
What this doesn’t tell you, however, is how long each “hop” along that path took. Was it the latency between your local system and your Wi-Fi router, or was it one of the other routers along the path? The traceroute command sends three packets to each node along the path from one system to another and reports on how long it takes. For security and other reasons, not all routers will report this information and, in these cases, traceroute will respond with an asterisk (*).
While traceroute information is invaluable for fault isolation, manually running traceroute from each device in your environment is impractical. Fortunately, ControlUp for Desktops automates this for you.
Traceroute with Edge DX
Clicking on the device tab, one of the widgets, or on a location on the map will display devices managed by Edge DX.

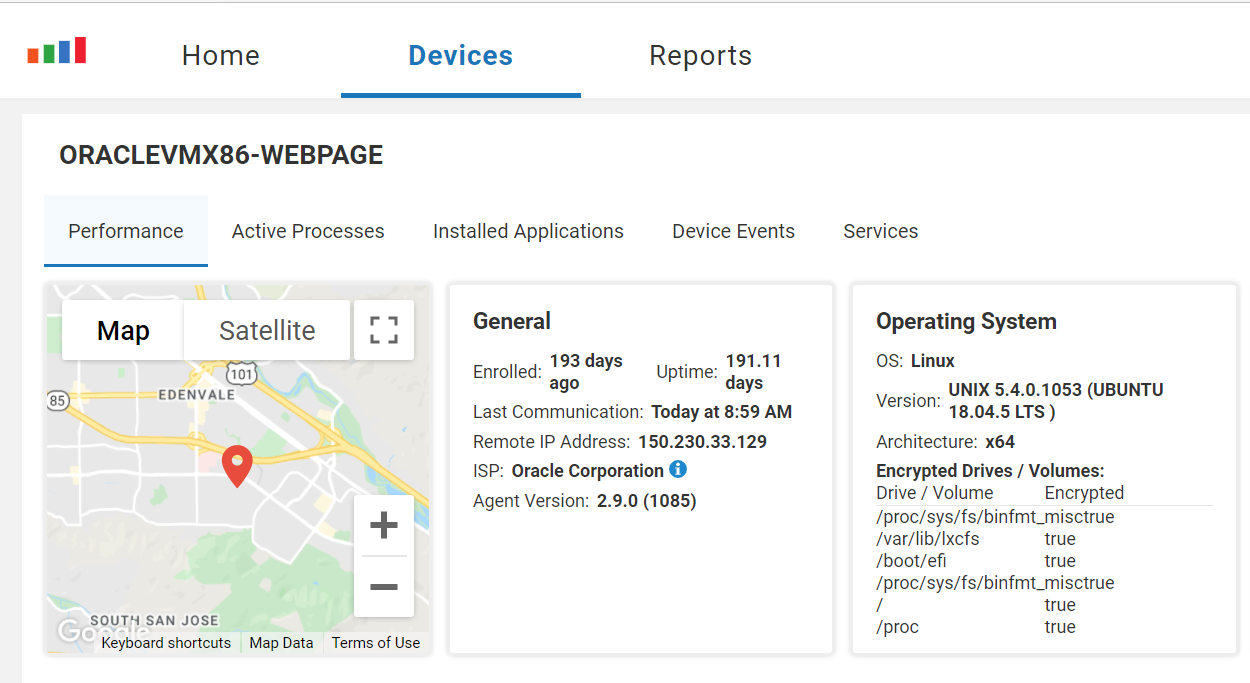
Clicking on a device will bring up more information about it.

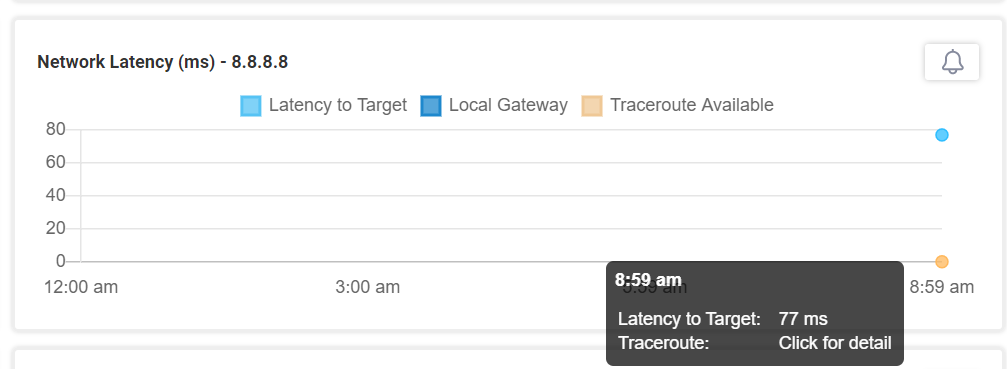
If you scroll down, you’ll see the Network Latency widget.

This widget displays three graphs: Latency to Target, Local Gateway, and Traceroute Available. Clicking an orange dot on the graph will display the traceroute information that was collected at that time.

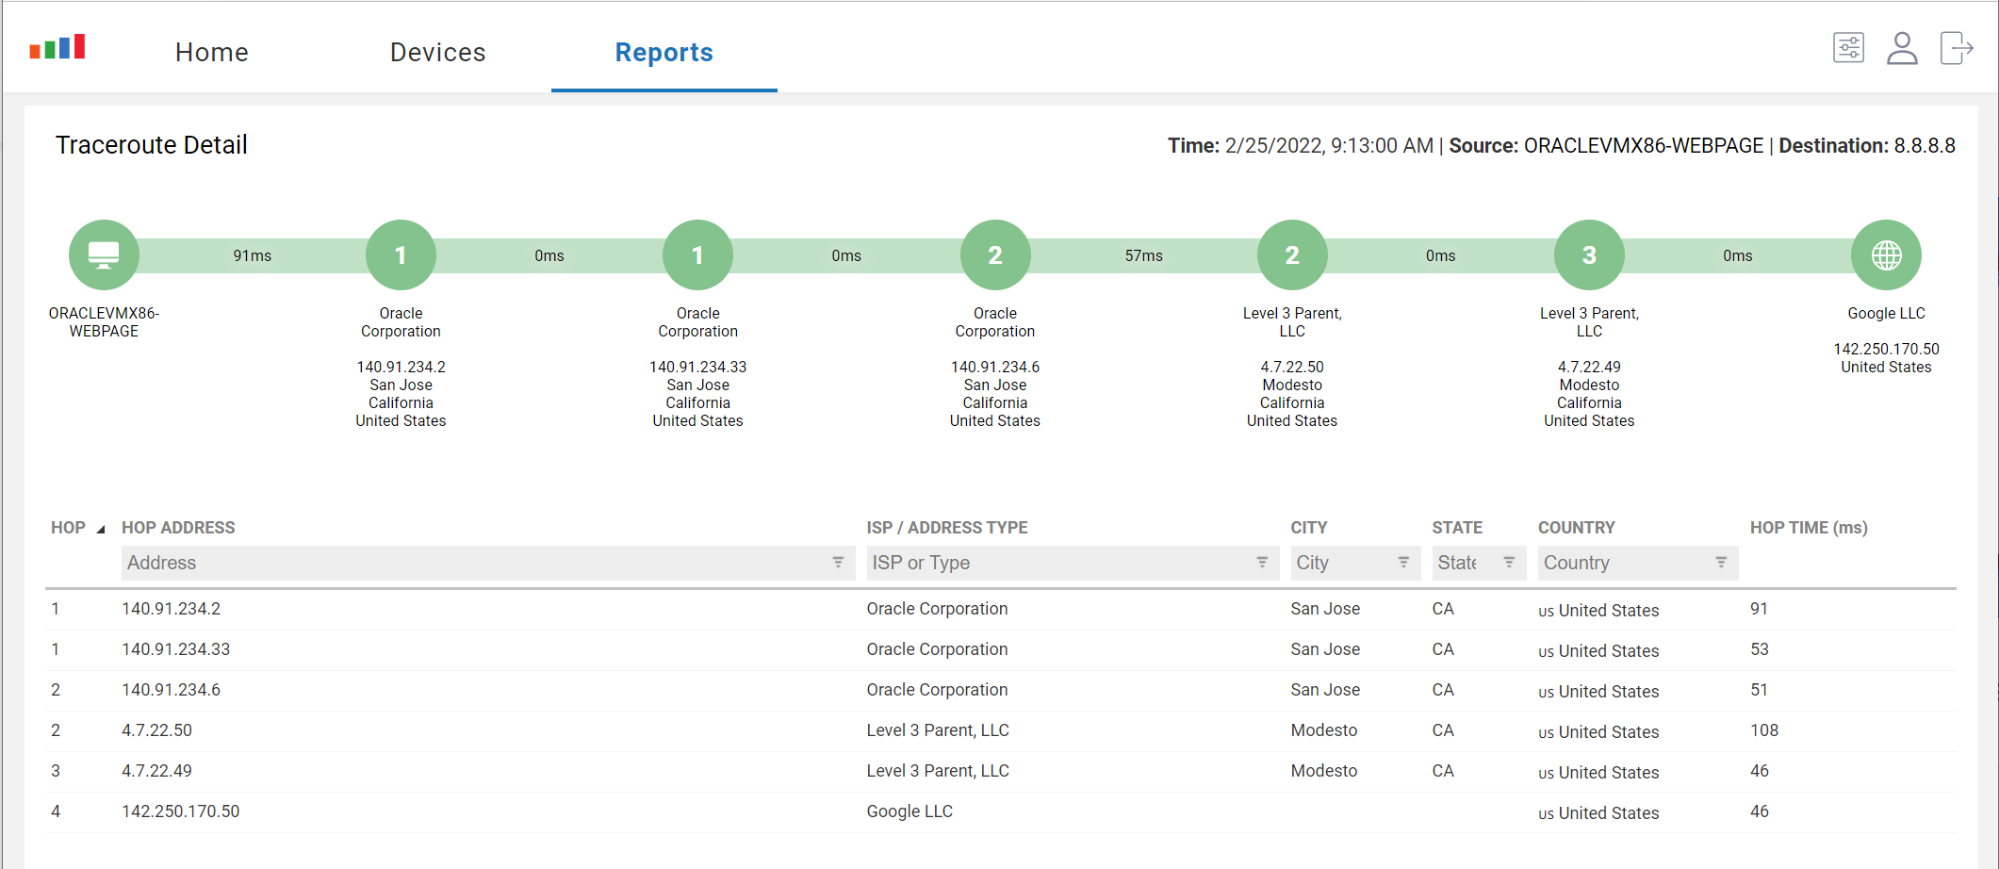
Clicking the display will show you a bubble graph of the hops between the device (printserver01) and the destination system (8.8.8.8)

The graph above shows that the majority of the latency (25ms) was between the device and the first hop (10.0.0.1), which is a local Wi-Fi router.
By default, the destination that Edge DX checks against is 8.8.8.8, but this can be changed and additional destinations added.
Setting up Traceroute
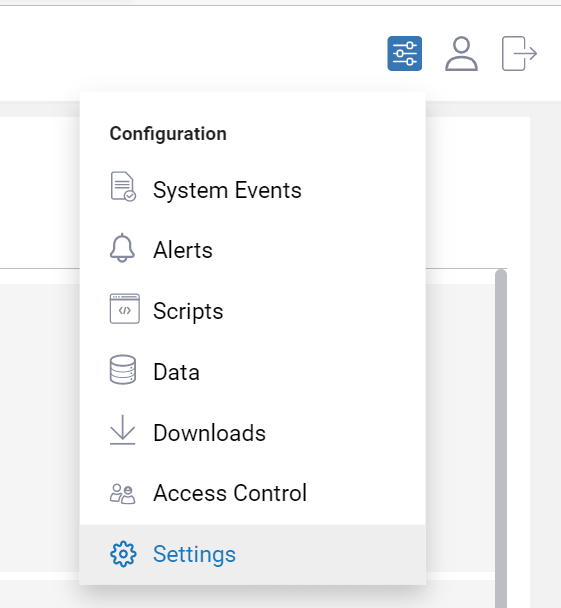
As noted above, Edge DX, by default, only checks one remote location (8.8.8.8). To change this, click the Configuration drop-down menu and select Settings.
From the Settings page, select Network Latency.
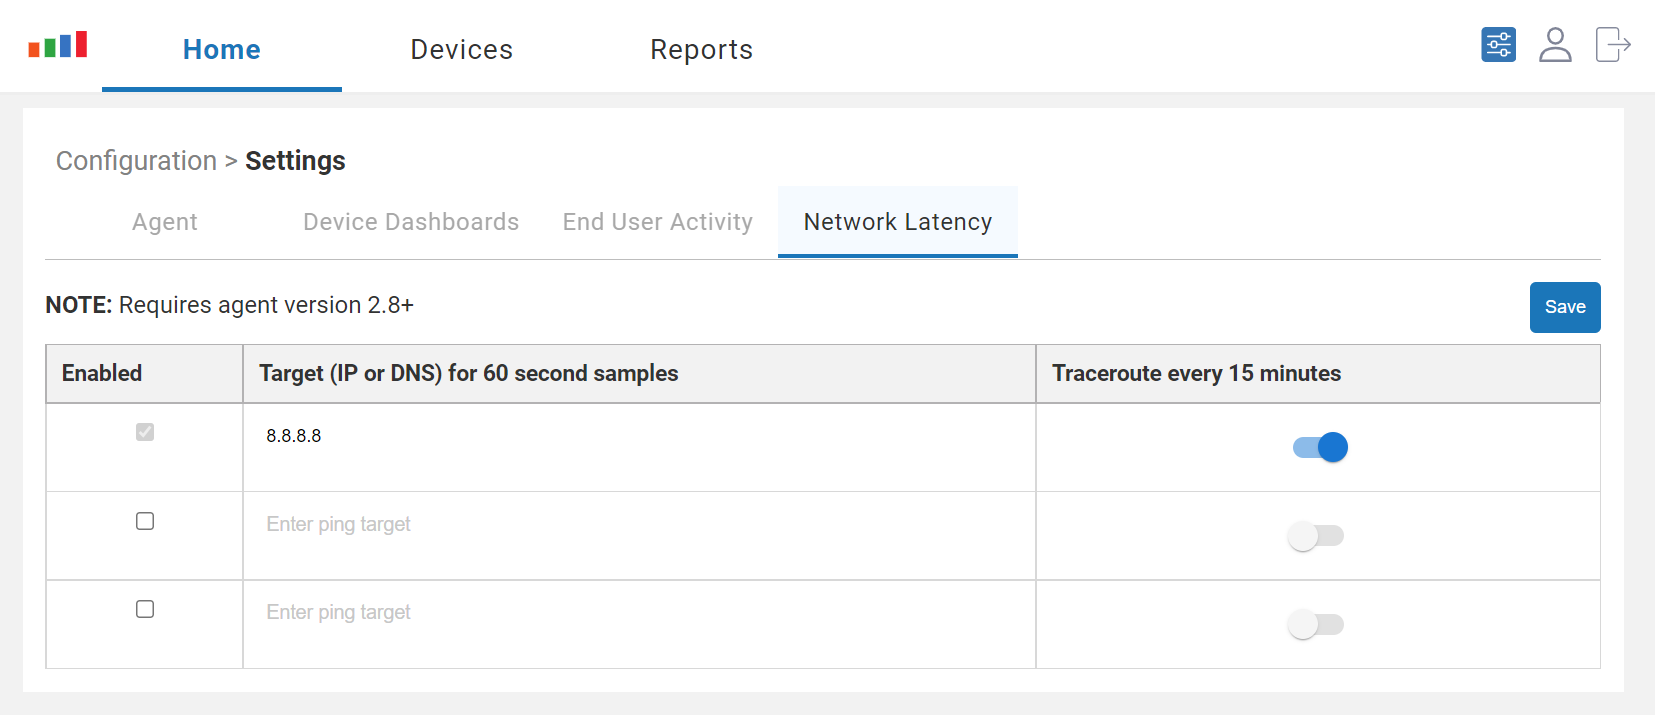
On this page, you can set up additional targets to check against. I wanted to check the route to a SaaS application—Office365 (office.com)—and ControlUp.
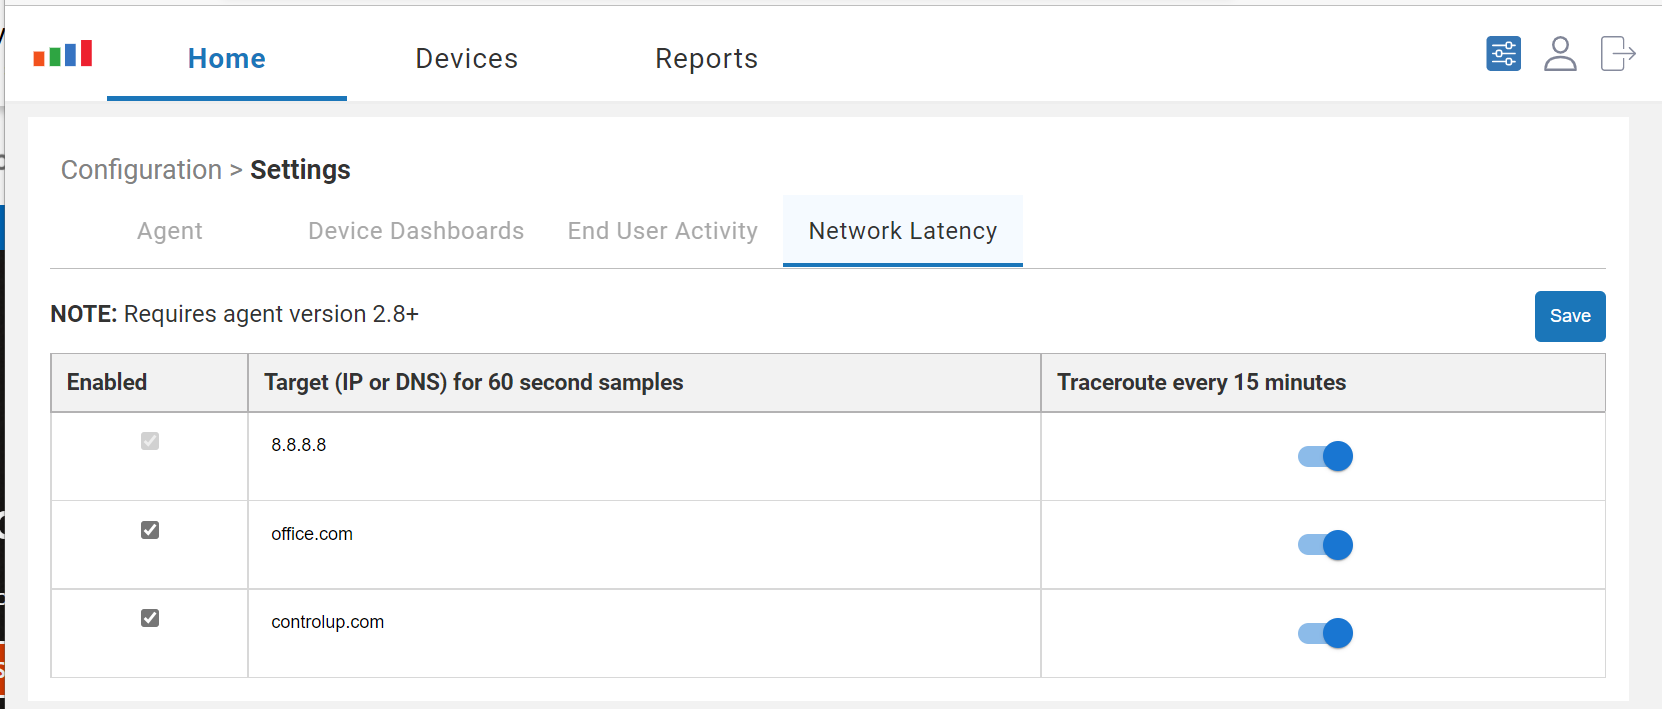
After clicking Save, I waited half an hour (traceroute runs every 15 minutes) and refreshed the web page (Ctrl + F5), then checked and saw all three traceroute sites.

The Database
The easiest way to see traceroute information is with the graph, but this, as well as all other information that Edge DX collects, is stored in a database. You can generate a report from the database for further analysis by taking the following steps.
Select Data from the Configuration drop-down menu.

This will bring up a list of the database indices, whose names should be self-descriptive. In our case, we want the hardware information of the devices to select traceroute.

From the Index Schema list, select the information you want to display. The names that start with an underscore (“_”) were created by Edge DX automatically.
The information that is displayed is highly dense, as it stores each hop as a separate line.

You can use filters to limit the amount of data shown, as well as the sorting command to show relevant information. In the example below, I am only showing the final trace target to office.com and then sorting by the longest hop along its path. Using the time range feature, I limited the search to a single day.

If you want to run this report later, you can click Create Custom Report, give the report a name and description, click the Publish checkbox, and then click Create.

Whenever you want to run the report, you can select it from the Reports tab, and you’ll be able to find the report under Custom Reports.
Issues
One of the devices that I tried to get information from did not have traceroute information on it.

When I looked at the General information widget, I noticed that it was running an older version of the Edge DX agent 2.6.0 (683).

To correct the issue, I upgraded the Edge DX agent using a script. If you need this script, contact ControlUp Support.

Under the Device Events tab, there was a message that the agent had been restarted.

When I looked at the General information widget again, I noticed that the agent had been updated to 2.9.0 (1085).
The Network Latency widget had traceroute information.
Traceroute is a tool that every sysadmin needs to use occasionally. ControlUp for Desktops automatically collects traceroute information from multiple locations every 15 minutes, then displays this information in an easy-to-understand graph for near real-time analytics. If needed, this information can be used to set up alarms to alert you when a threshold has been crossed. Additionally, it stores this data for historical reference and for further problem isolation.
Traceroute is just one of the many ways that Edge DX can improve the digital employee experience of those using physical endpoints. Edge DX can be set up and deployed in minutes and give actionable intelligence within the hour.