
When your internet feels slow, your first move is almost always the same: you open a browser and navigate to your favorite speed test website. You watch the numbers spin, hoping to confirm your suspicion that your connection isn’t living up to its promise.
However, the “speed” you see on that test is just one piece of the puzzle. To truly understand the health of your internet—especially for crucial work tasks—you need to grasp three distinct, critical measurements: speed (or throughput), bandwidth, and latency.
Whether you need to test latency for video calls or check bandwidth for downloads, understanding your internet health starts with knowing what to measure. A latency test reveals network delays, while bandwidth tests show capacity, but these metrics tell different stories about your connection’s performance. This guide explains how to interpret latency testers, throughput measurements, and bandwidth checks to diagnose and fix connectivity issues.
An Analogy: The Internet Superhighway
Think of your internet connection like a highway system transporting data packets (the vehicles) to and from a distant city (the server you’re connecting to).

Bandwidth: The Number of Lanes
- Bandwidth is the maximum capacity of your connection, i.e., the total volume of data that can be transferred per second.
- In our analogy, this is the width of the highway, or the number of lanes. A highway with eight lanes (high bandwidth) can move much more traffic than one with a single lane (low bandwidth) in the same amount of time. It’s measured in Megabits per second (Mbps) or Gigabits per second (Gbps).
When you check bandwidth test results, you’re seeing the maximum capacity available.
Speed (Throughput): The Flow of Traffic
- Speed, or throughput, is the actual amount of data successfully delivered per second at a given moment.
- This is the actual flow of traffic on the highway. Even with eight lanes (high bandwidth), if only a few cars are on the road, your speed is low. If the highway is full and moving quickly, your speed (throughput) is high.
Understanding what throughput is in networking helps explain why your actual speeds may differ from advertised bandwidth.
Latency: The Time Delay
- Latency is the time delay it takes for a single data packet to travel from your device to a server and back, aka the “round-trip time.” It’s measured in milliseconds (ms).
- This is the delay you hit at a toll booth or traffic light along the way. Low latency (a quick green light) is critical for real-time interaction.
Running an internet latency test regularly helps you identify connection issues before they impact productivity.
| Metric | Highway Analogy | Importance for User Experience |
| Bandwidth | Number of lanes on the highway | How much data you can handle simultaneously (e.g., multiple 4K streams). |
| Speed (Throughput) | Actual number of vehicles passing by | How fast files download, or videos start playing. |
| Latency | Delay at a traffic light/toll booth | How quickly your actions get a response (e.g., lag in a video call). |
The Real-Time Killer: Latency and Jitter
While high bandwidth is great for downloading a large file quickly, low latency is the most critical factor for a good digital employee experience. For real-time applications like Microsoft Teams and Zoom, a related metric, jitter, is equally important.
- Latency (Delay): A high, consistent latency (e.g., 250ms) means a predictable delay in your calls—you hear the other person a quarter-second after they speak.
- Jitter (Variability in Delay): This is the variation in latency over time. If your latency bounces between 20ms and 250ms (high jitter), the application struggles to keep the audio stream smooth. Jitter results in the most frustrating experience: choppy audio, frozen video, and dropped calls, as the application has to discard or reorder data packets constantly.
For a great video or voice call experience, you need low latency and low jitter.
Why These Metrics Power Digital Employee Experience (DEX)
In remote and hybrid work environments, the quality of the internet directly dictates the Digital Employee Experience (DEX). Poor network performance can severely disrupt productivity, turning simple tasks into frustrating challenges.
- Real-Time Collaboration (Zoom, Teams): High latency and high jitter are the ultimate killers here. They make conversations feel awkward and lead to constant interruptions and garbled sound, even if your total bandwidth is high.
- Cloud Applications: Many modern business tools are cloud-based. Low speed/throughput means slow page loads, long save times, and general sluggishness. A high latency connection makes every click feel delayed and unresponsive.
- Productivity and Morale: A poor DEX due to a slow internet connection leads to wasted time and increased frustration, directly impacting employee morale and, more importantly, the company’s bottom line.
Regular latency testing and bandwidth monitoring are essential for maintaining optimal DEX in distributed work environments. For optimal DEX, you want high bandwidth/speed and low latency/jitter.
How ControlUp Measures Internet Health for Work
To ensure a high-quality DEX, platforms like ControlUp ONE monitor these internet health metrics from the employee’s perspective, whether they are in the office or working remotely. This visibility enables IT to pinpoint the source of a problem quickly.
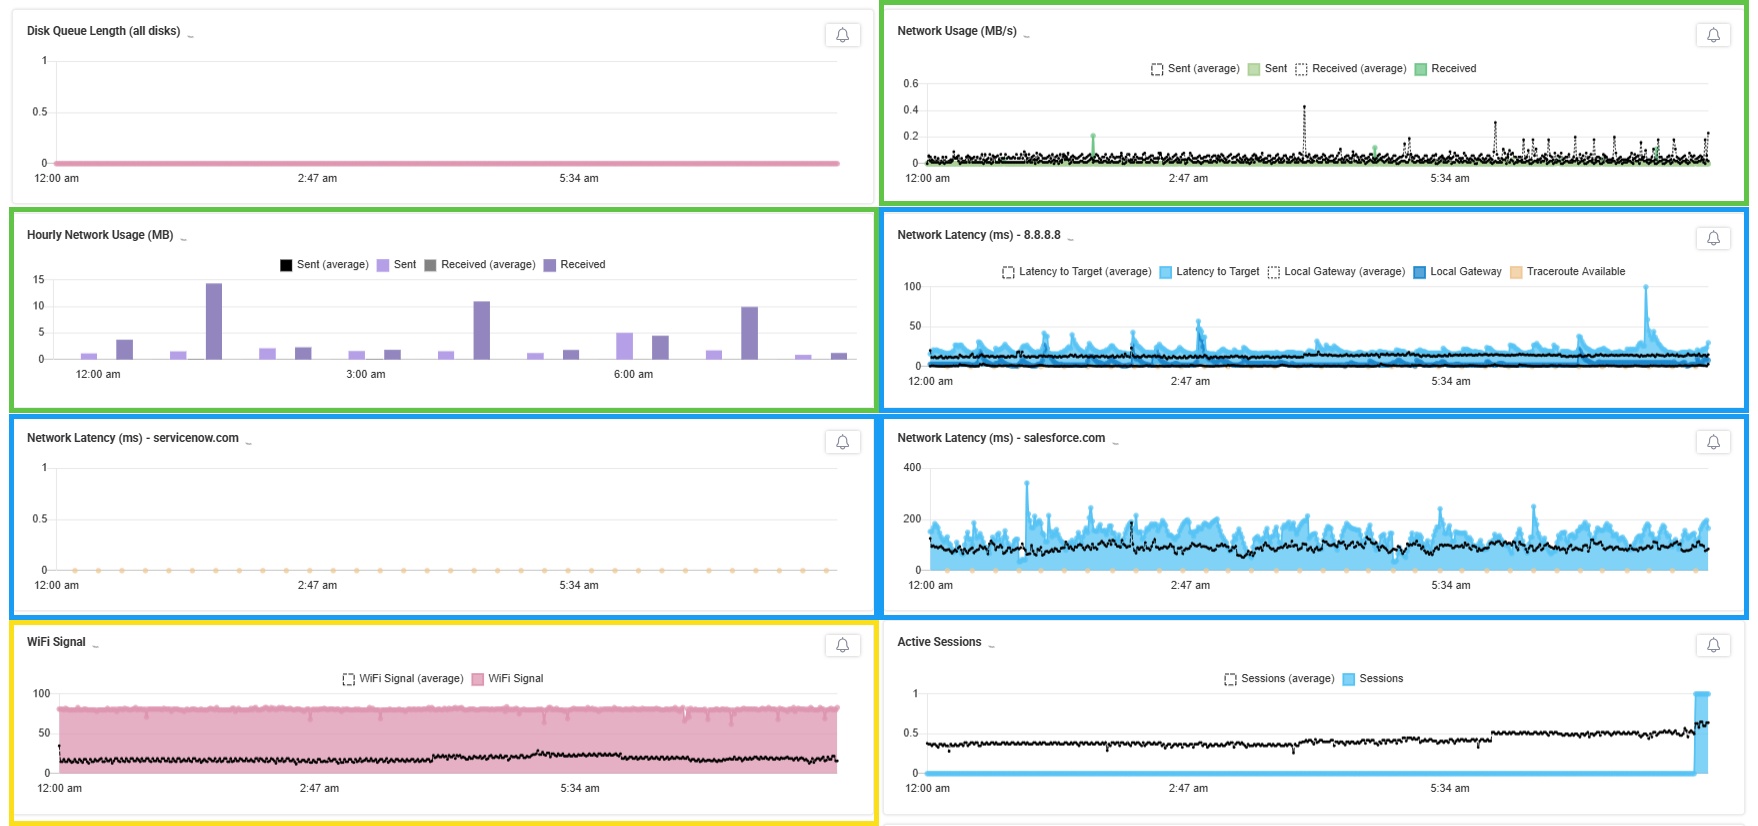
ControlUp, utilizing its Edge DX technology, measures these critical factors:
- Bandwidth/Throughput Measurement (Green boxes below):
- ControlUp tracks the actual network usage (inbound and outbound traffic) on the employee’s device, giving IT a real-time view of their speed (throughput). This helps determine if the user is running out of bandwidth due to a large download, a concurrent application update, or heavy application usage.
- Latency and Path Monitoring (Blue boxes below):
- ControlUp constantly measures the Round-Trip Time (RTT) (latency) from the end-user device to key, customizable network targets (like Google DNS or a corporate server).
- It utilizes Traceroute tests, which map the path a data packet takes across the internet, identifying every “hop” (router) and measuring the delay at each point. This is crucial for isolating whether the latency problem is near the employee’s device, within the ISP’s network, or closer to the application’s server. IT can even see which ISP is performing poorly across an entire region.
- Endpoint and Wi-Fi Health Context (Yellow box below):
- ControlUp ties these network metrics to local factors such as Wi-Fi signal strength, the type of adapter (wired vs. wireless), and even local CPU/memory usage. This holistic view confirms if, for example, high latency is a network issue or if the user’s local hardware is simply overloaded.
Frequently Asked Questions About Internet Latency Tests
How do I run an internet latency test?
Use ping commands or online latency testers to measure round-trip time (RTT) to servers. Most speed test websites include latency measurements alongside bandwidth results.
What is a good latency test result?
For video calls and real-time applications, aim for latency below 50ms. Gaming requires under 20ms latency, while general browsing works fine with up to 100ms.
What’s the difference between a latency test and a bandwidth test?
A latency test measures delay (how quickly data travels), while a bandwidth test measures capacity (how much data can travel). Both are crucial for different aspects of internet performance.
What is throughput in networking?
Throughput is the actual amount of data successfully transferred per second—your real-world speed. It’s often lower than your maximum bandwidth due to network conditions.
Move Beyond Basic Speed Tests: Professional Network Monitoring
Understanding internet health metrics is the first step, but continuous monitoring is what separates reactive troubleshooting from proactive IT management.
ControlUp provides IT teams with real-time, granular data that moves beyond general complaints of “my internet is slow” to specifically diagnosing and fixing network issues. By monitoring latency, bandwidth, and throughput from the employee’s perspective, IT teams can ensure a consistently effective internet experience for all employees, whether they’re in the office or working remotely.
Ready to eliminate connectivity issues before they impact productivity? ControlUp’s comprehensive IT monitoring tools provide the real-time insights you need to create seamless experiences and ensure more productive workdays.