
A few weeks ago I stumbled upon post by Rob Beekmans discussing some important Citrix EdgeSight 5.4 features that seems to be missing in the new Desktop Director / EdgeSight solution in XenDesktop 7.1 and XenApp/XenDesktop 7.5. After reviewing the views and features of Desktop Director in a lab environment (based on a XenDesktop 7.5 installation) I figured it would be a good idea to show how ControlUp can complement the existing Desktop Director offering and bridge some of the gaps mentioned in Rob Beekmans’ blog.
I will use Rob’s list to describe the various features in EdgeSight 5.4 that are missing from the new 7.5 Director / EdgeSight solution and then explain how ControlUp bridges the gaps.
Server Details
The first missing feature is a view of servers. Director 7.5 doesn’t actually include such a view, and the closest screen we have is the Load Evaluator Index screen which shows the Load Evaluator status over time:
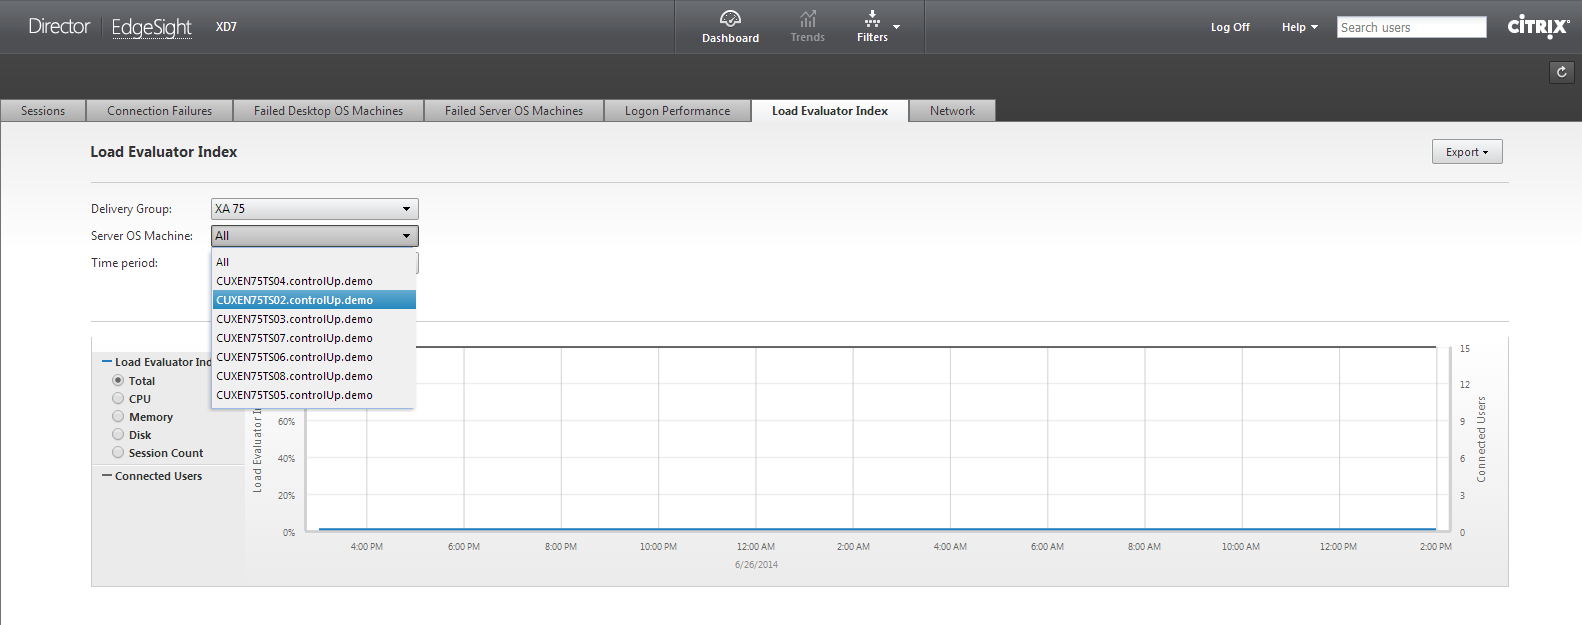
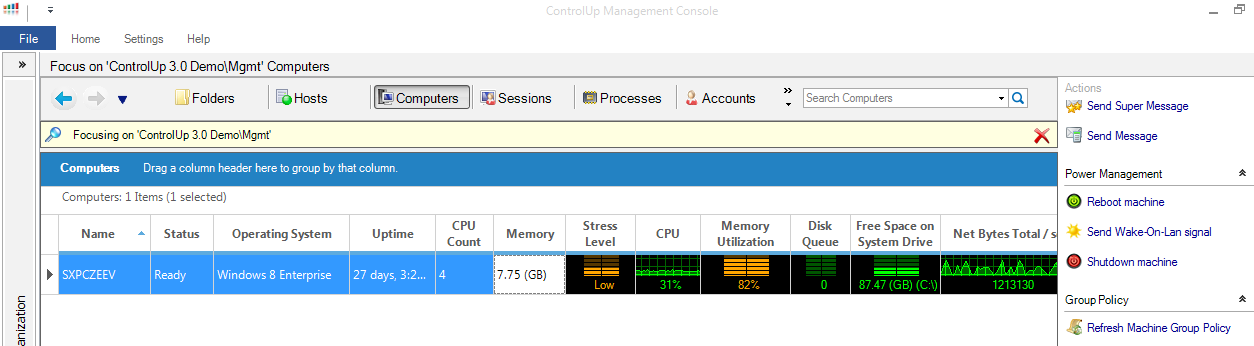
ControlUp comes in handy here with a detailed server view which displays both real-time performance statistics (e.g. CPU, Memory, I/O…) and configuration data such as XenApp Load Evaluator, XenDesktop Group Name, PVS vDisk name, and many more:
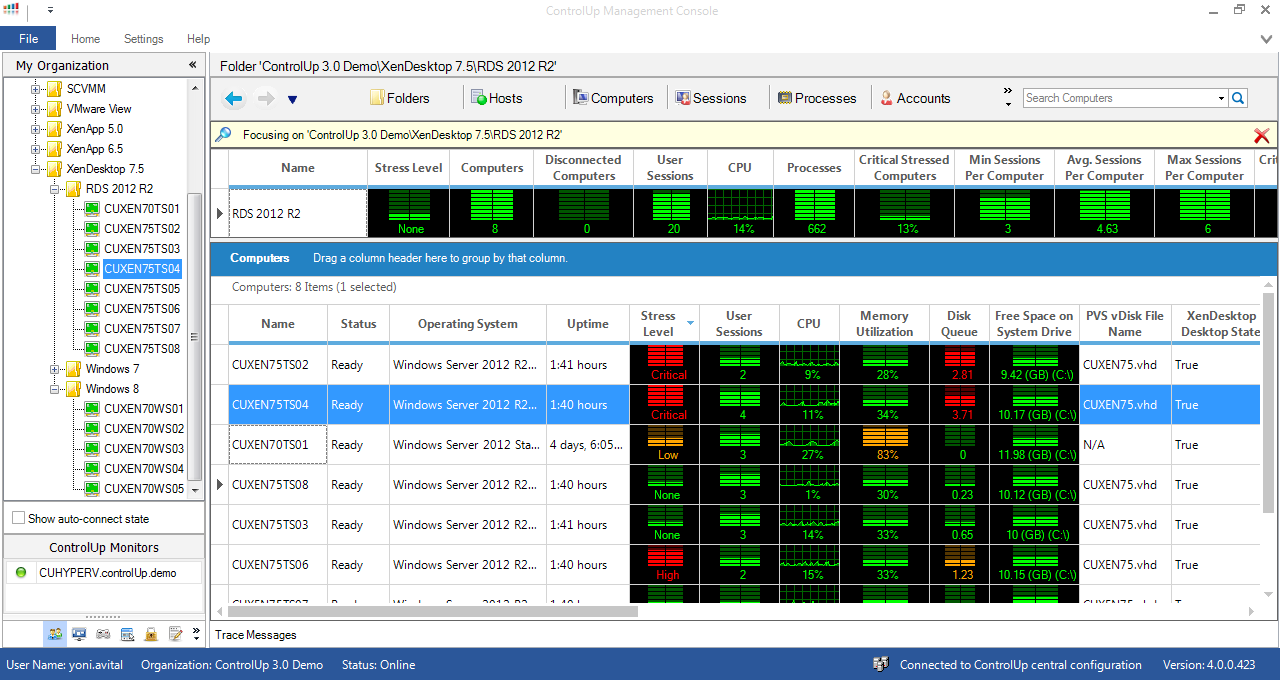
ControlUp Computers View
XenApp Summary – Top private bytes consumers
The old EdgeSight 5.4 report can show the Private Bytes and Working Set metrics for a single XenApp server or for the entire farm. This is important data that can show you which applications consume the highest amounts of memory in the farm.
Director 7.5 takes a different approach and only shows memory usage from a single user’s perspective:
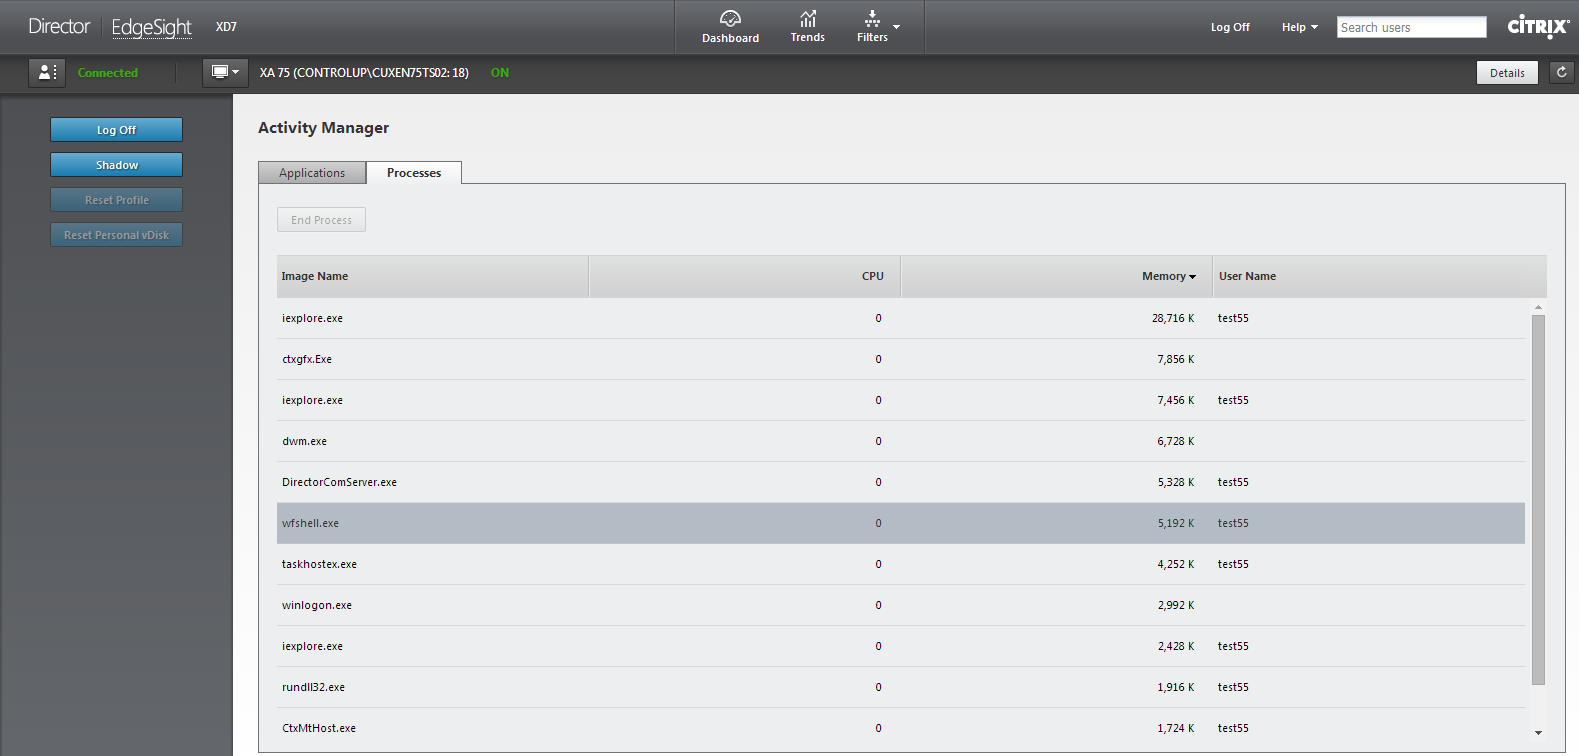
ControlUp’s Processes and Executables views can display the Private Bytes metric for a single server or the entire farm, including the relevant applications data. Simply browse to the Executables view and sort the grid based on the Memory (Private Bytes) column to see the top ranking memory consumers, as shown below:
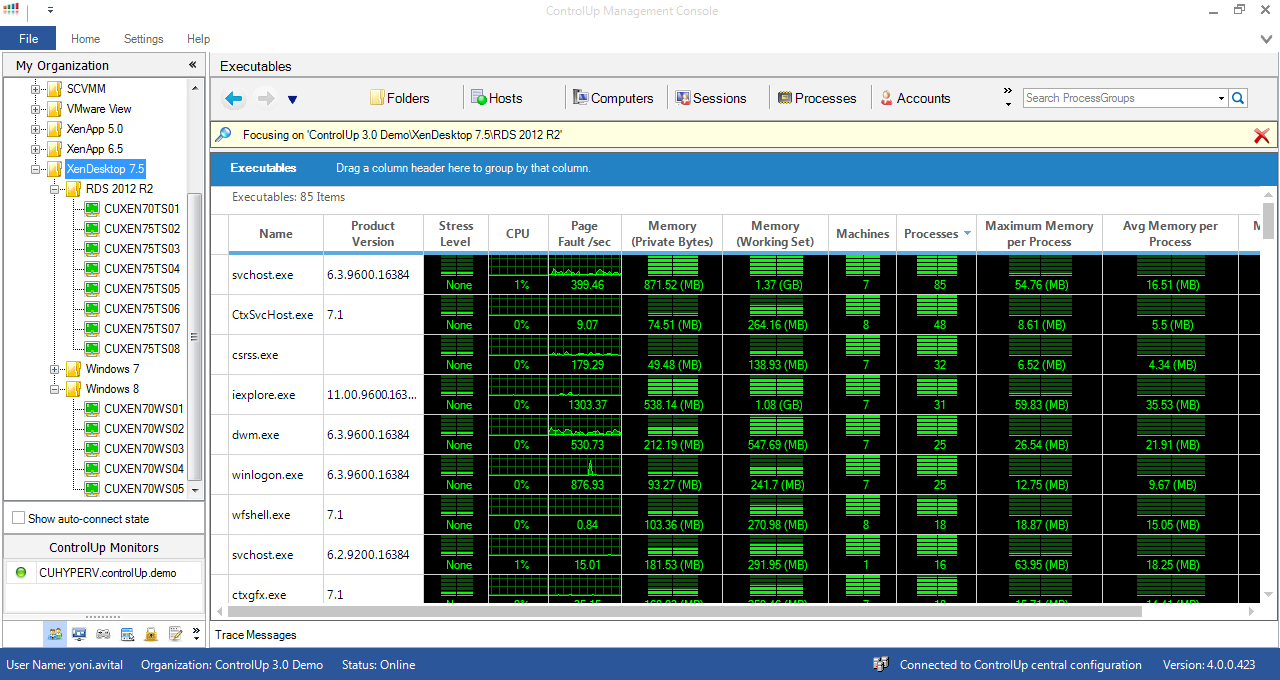
ControlUp Executables View
Alert Reporting
EdgeSight 5.4 included the option to receive e-mail alerts whenever a threshold is breached. Alas, Director 7.5 doesn’t include any alerting capabilities.
ControlUp fully supports alerting via the Incident Triggers feature. ControlUp admins can configure Incident Triggers that will detect specific events such as critical service crashes, performance issues, or Windows events and send a real-time e-mail alert:

ControlUp Incidents Triggers types
Custom Dashboards
EdgeSight 5.4 enabled configuring custom dashboards based on the customer requirements. Director 7.5 offers a clean UI with some useful dashboards, but doesn’t offer any customization options:

ControlUp enables the customer to customize different columns presets, columns order, and folder views based on the requirements and type of the monitored environment. In addition, the built-in security policy and ADMX file can be used to restrict access to specific folders and actions based on AD group membership.

ControlUp Computers columns. Custom columns lists can be created
Active Application Monitoring
A rarely used feature in EdgeSight 5.4, AAM enabled the customer to script a session launch and application transaction and then execute the script from a launcher machine. The launcher reports the script execution time to EdgeSight and enabled the customer to measure how long each run took.
Director 7.5 doesn’t include the AAM feature. HDX Insight can report on ICA and network latency, but that doesn’t cover the actual application transactions times from the end user’s standpoint.
ControlUp doesn’t include a feature similar to AAM. We currently display the ICA session latency for each XenApp / XenDesktop session and are working on adding additional user experience metrics in future ControlUp versions. Stay tuned for the next releases of ControlUp for exciting news regarding active monitoring.
Endpoint Monitoring
EdgeSight 5.4 included the option to monitor the actual physical endpoints using the EdgeSight for Endpoints Agent. The EdgeSight agent used to collect data on performance, resource consumption, application usage, and network utilization and uploaded this data to the central EdgeSight database for display and analysis.
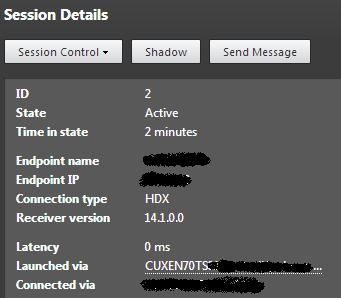
Endpoint monitoring in Director 7.5 relies on the VDA and the SEMS Service which runs on each XenApp and XenDesktop computer, gathering performance data and user experience statistics. You can’t install these components on physical endpoints, so only the XenApp servers and XenDesktop VM’s are directly monitored. The Session Details screen does provide some data on the physical endpoints, such as the client name, IP address, and session latency:
ControlUp includes the option to deploy the ControlUp agent on the physical endpoint assuming the basic prerequisites are met (Windows OS, .NET Framework 3.0 or higher and a single TCP port open between the console computer and the physical endpoint). Once the agent is running on the physical endpoint, a wealth of data is displayed in the main console including full management capabilities:
 Physical endpoint view in ControlUp
Summary
This blog post listed some of the missing features in Citrix Director 7.5 and how ControlUp can help in bridging these gaps and providing a comprehensive monitoring and management experience for Citrix environments.
There are other features missing from the current Citrix Director 7.x offering that I think are properly addressed by ControlUp. Among these are the ability to monitor multiple versions of XenApp and XenDesktop in the same console, as well as full contextual management actions, which I intend to cover in a future post.
In the meantime, I would appreciate your comments regarding other areas where ControlUp might help in completing the existing Desktop Director offering.
Yoni Avital
CTO
Smart-X