
ControlUp's Employee Experience Score is a real-time monitoring solution designed to proactively identify and address hidden IT performance issues affecting employee productivity by aggregating detailed device metrics into a single, actionable score.
The system uses a 0-10 penalty-based score, recalculated every minute, derived from 13 metrics across resource availability, connectivity, responsiveness, and stability.
It tracks crucial indicators such as CPU load, network latency, user input delay, and application crashes, enabling IT to pinpoint specific problems without relying on employee reports.
By providing immediate visibility into employee device health, the score allows IT teams to transition from reactive troubleshooting to proactive problem resolution, enhancing overall user experience and organizational efficiency.
Picture this: it’s 9:15 on a Tuesday morning. Somewhere in your organization, a sales rep named Marcus is on a video call with a prospect he’s been chasing for three months. His laptop fan is screaming. Teams keeps freezing. Every time he shares his screen, there’s a two-second lag before anything moves.
Marcus doesn’t submit a ticket. He suffers through it, closes the call early, and spends the rest of the morning convinced his laptop is dying.
Meanwhile, in your legacy IT console, nothing is on fire. No alerts. No outages. No indication that anything went wrong at all.
This is the gap that the Employee Experience Score is designed to close.
What is the Employee Experience Score?
ControlUp’s Experience Score is a single number, between 0 and 10, that reflects how well each employee’s device is serving them right now. It’s recalculated every sixty seconds, using thirteen real-time measurements across four categories: resource availability, connectivity, responsiveness, and stability.
When Marcus’s score drops to a 3 during that prospect call, you see it. You don’t need him to tell you.
The score doesn’t build up from individual readings. It starts at a perfect 10 and gets reduced whenever a condition in your scoring profile is breached. Think of it as a penalty system: every employee starts each minute with a clean slate, and the system deducts points based on what it actually observes on the device.
Each condition has two inputs: a threshold (the point at which a metric is considered problematic) and a weight (how severely that problem should hurt the score). A marginal Wi-Fi signal with a low weight might shave half a point. A crashed application with a high weight can push the score to zero.
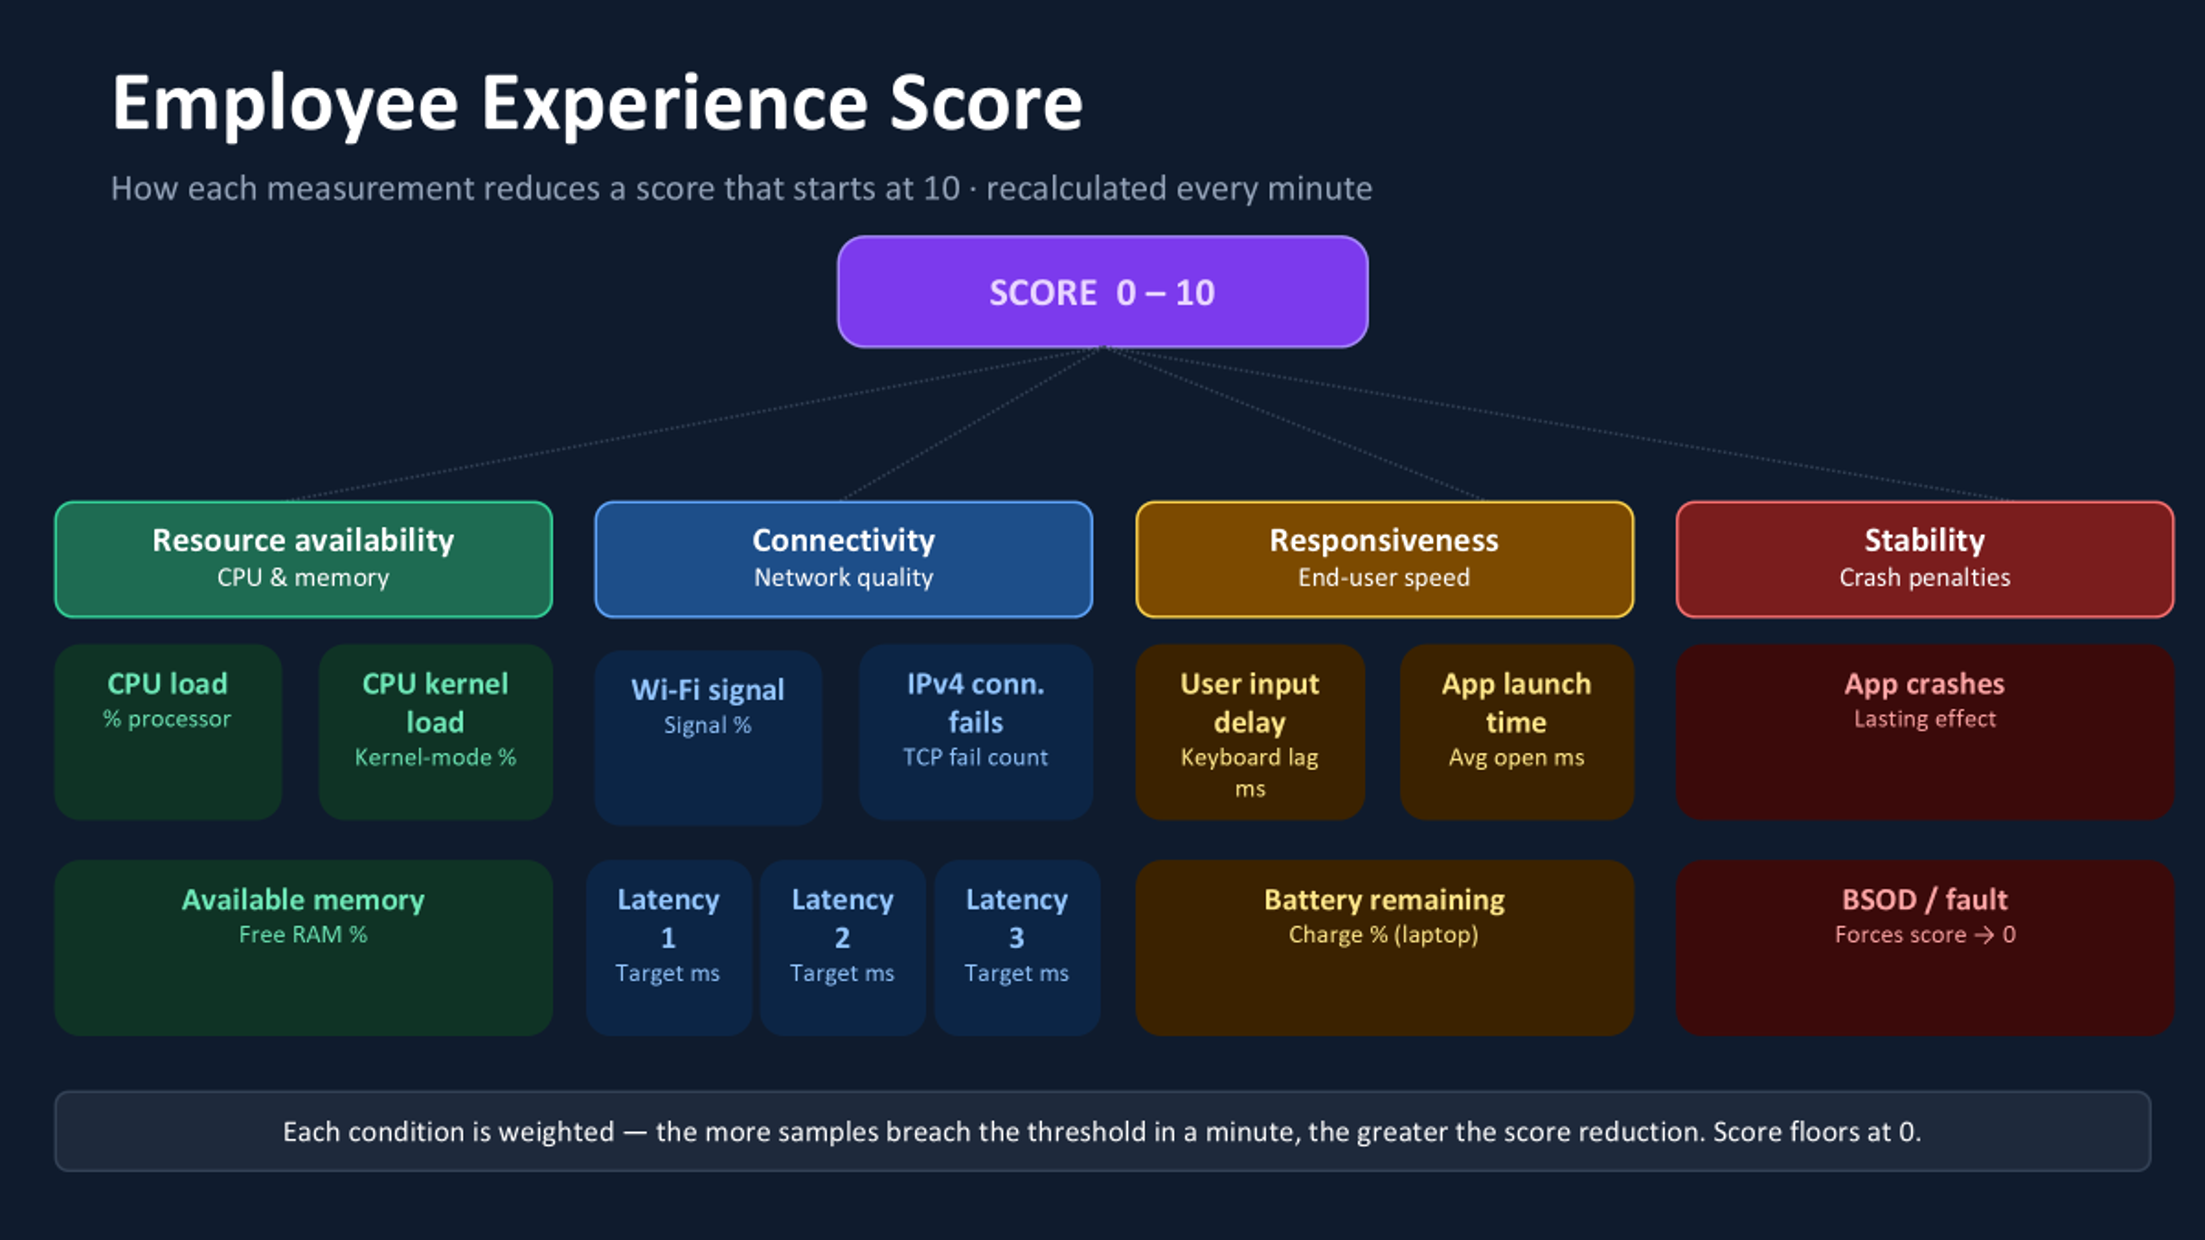
Which metrics make up the Employee Experience Score?
Is the machine keeping up?
The first set of measurements covers the most basic question in endpoint performance: does this device have enough horsepower for what’s being asked of it?
- CPU load tracks total processor utilization. When Marcus has five browser tabs open, a Teams call running, and a heavy CRM page loading, this metric tells you exactly why his fan is spinning.
- CPU kernel load goes a layer deeper, isolating processing that happens in kernel mode. It’s particularly useful for catching driver issues and OS-level bottlenecks that don’t always surface in the headline CPU number.
- Available memory tracks free RAM as a percentage. Devices that are perpetually memory-constrained push the OS into paging, which cascades into slow tab switching, sluggish application behavior, and the general sense that everything takes just a moment longer than it should. That sensation is death by a thousand cuts for someone on a long customer call.
Can the machine reach what it needs?
Modern work is entirely network-dependent. A healthy, powerful device with a poor connection delivers a poor experience, and “the network was slow” is one of the most frustrating complaints to triage because it can mean ten different things.
ControlUp tracks four connectivity signals to help you tell them apart.
- Wi-Fi signal strength is the most visible and the most complained about. Users feel this one in their bones. Capturing it as a continuous measurement means you can flag degradation before it becomes a ticket, or before someone moves to a worse desk because they don’t know their current one is the problem.
- Network latency tests 1, 2, and 3 measure round-trip time to up to three configurable targets you define: your data center, a critical SaaS app, a cloud region. These run every minute. Having three independent targets is what lets you distinguish “Marcus’s home internet is slow” from “the Salesforce endpoint is struggling this morning.” That distinction changes everything about who you call and what you fix.
- IPv4 connection failures count TCP attempts that simply don’t get through. A handful per minute is background noise. A spike is a sign something upstream has broken, and you want to know before the support calls start.
Does it feel fast?
Here’s a problem that trips up a lot of monitoring setups: a device can look perfectly healthy on CPU and memory and still feel awful to use.
Responsiveness is about how quickly the device reacts to the person sitting in front of it, and that’s a different question from how busy the device is.
- User input delay captures the lag between a keyboard stroke or mouse click and the system’s response. Delays even in the tens of milliseconds are perceptible. Users can’t name this metric, but they feel it every time they type a sentence and watch the cursor catch up. It’s one of the purest signals of subjective performance available.
- App launch time average measures how long applications take to open across the session. Employees rarely report this as a complaint on its own; they just call the machine “slow.” But a week of trending data on app launch times tells you whether an endpoint is genuinely degrading, or whether a specific app is the culprit.
- Battery charge remaining matters specifically for laptop users. A device on critically low battery will often throttle its own performance to extend runtime, which means that the sluggishness your employee is experiencing at 4pm might not be a hardware problem at all. It’s a power problem.
Has something already gone wrong?
The final category doesn’t measure conditions that might become problems. It measures things that have already happened.
- App crashes trigger a score penalty when a monitored application terminates unexpectedly. What makes this measurement particularly thoughtful is the “lasting effect” option: rather than snapping the score back to 10 the moment the crash is logged, the penalty can be configured to fade gradually over several minutes. A device that crashed five minutes ago isn’t fully recovered. The score reflects that.
- BSOD and critical system faults are in a different category entirely. When ControlUp detects a Blue Screen of Death or equivalent critical failure, it overrides every other measurement and forces the score to zero immediately. There is no weight, no threshold, no gradual deduction. A device that just experienced a critical fault is always a zero, and it’s always a priority.
Why one score is never enough: the case for thirteen measurements
If Marcus’s score is a 3, you need to know why. Is his Wi-Fi marginal? Is his memory exhausted? Did his CRM crash six minutes ago and it hasn’t recovered? Is his battery on four percent?
The answer changes whether you call his ISP, add him to the hardware refresh list, push a patch, or just send him a message that says “plug in your laptop.”
The score gets you to the right person at the right time. The thirteen measurements get you to the right conversation.
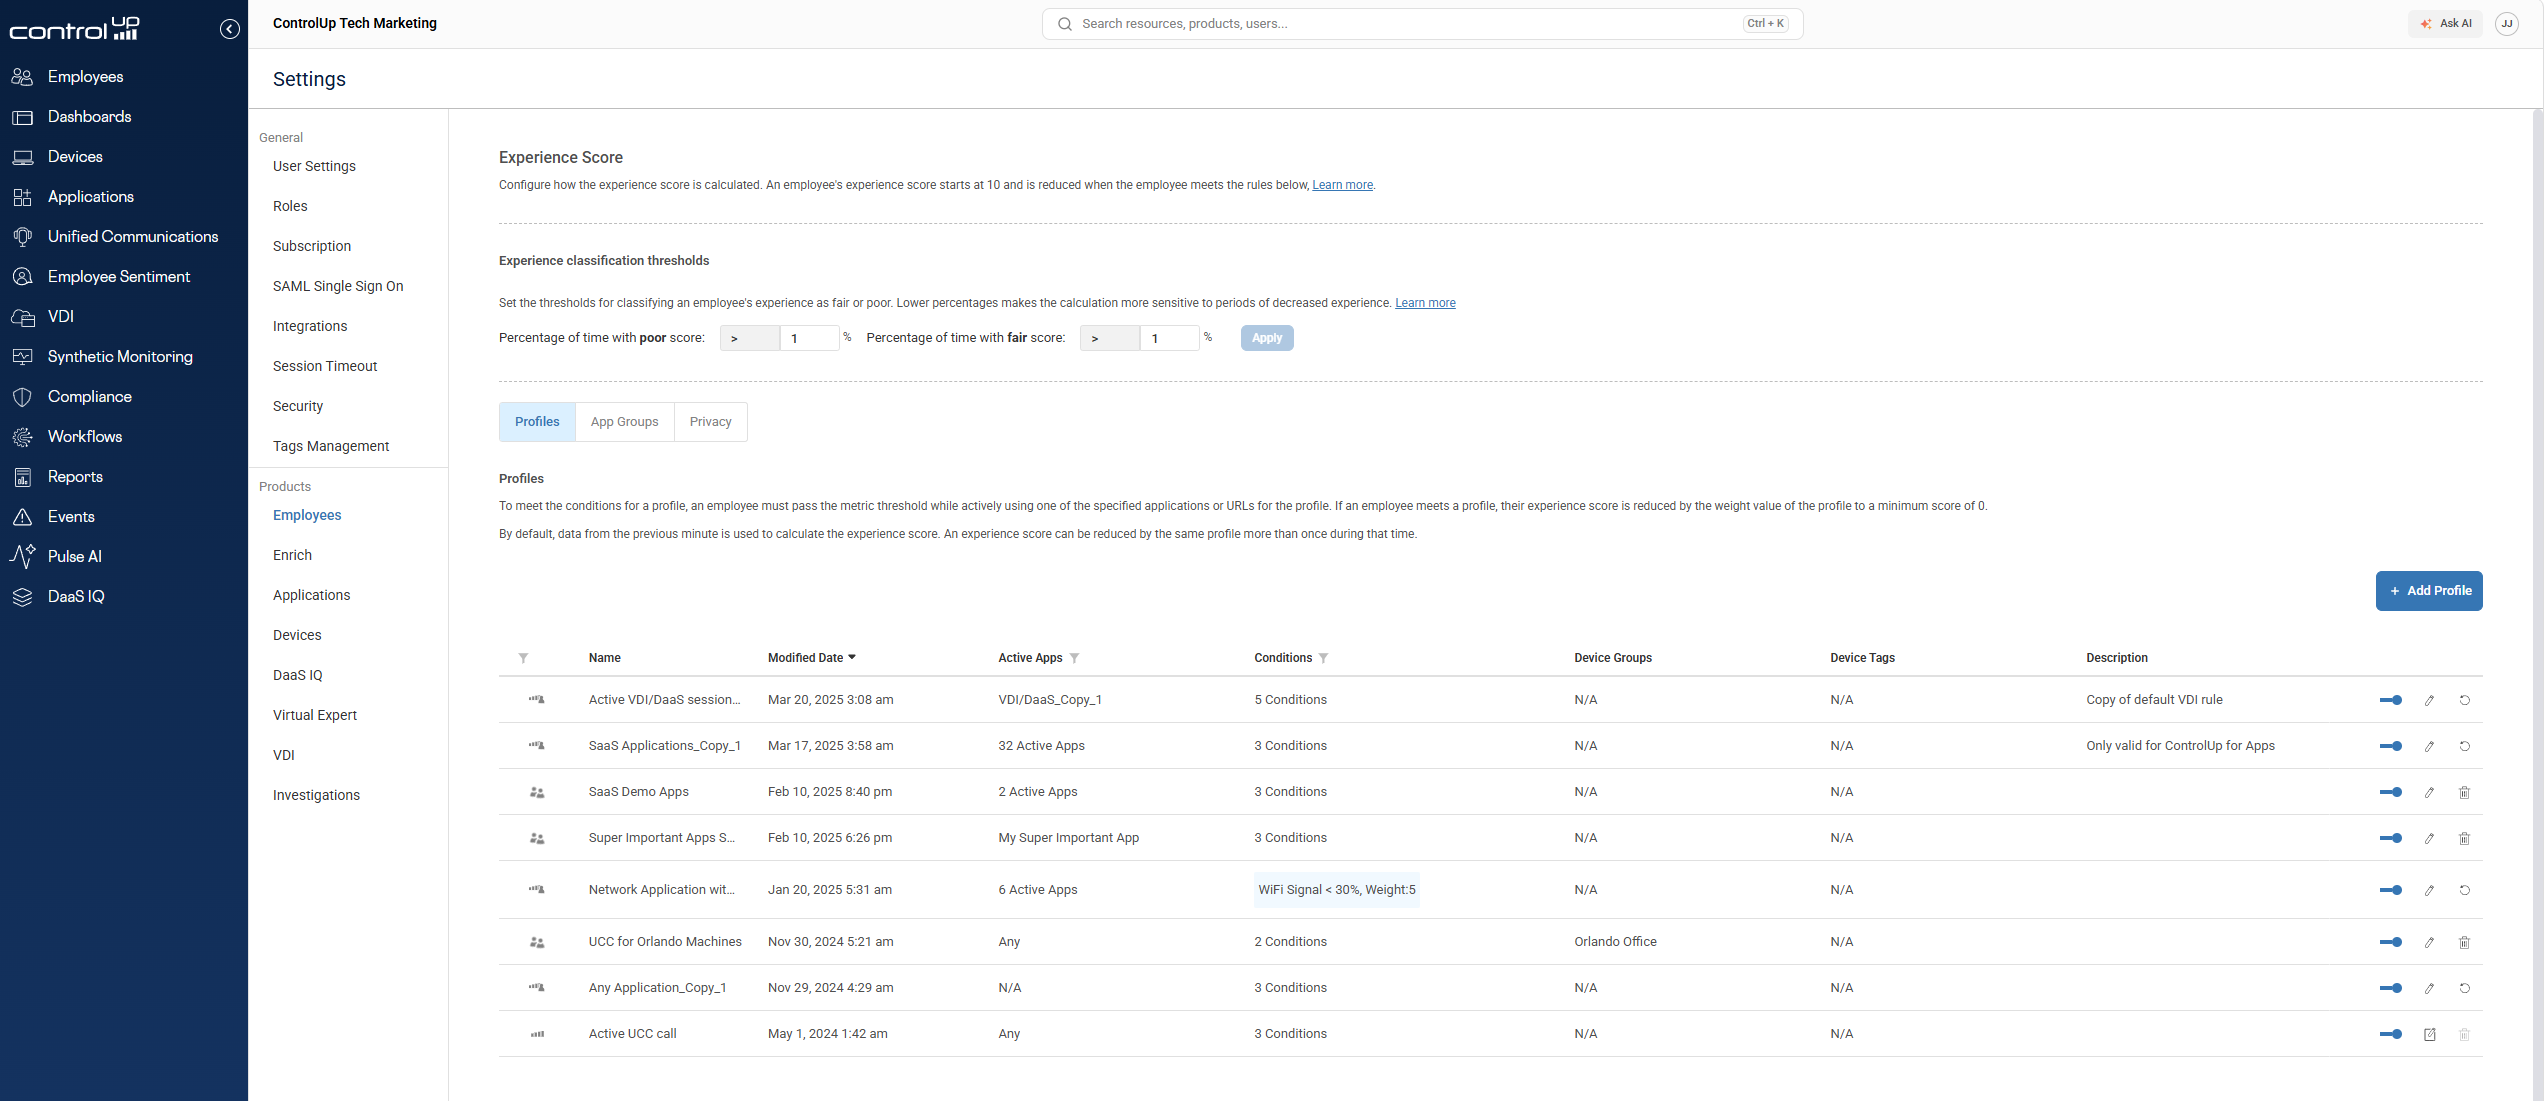
How to configure the Employee Experience Score for your environment
Every measurement only becomes useful when it’s tuned to your environment. A latency threshold that’s perfectly acceptable for a back-office team might be catastrophic for a trading floor. A battery condition that matters for field workers is irrelevant for engineers who never leave their desks.
Scoring profiles let you define which measurements apply, what thresholds trigger a penalty, how much each condition is weighted, and even which applications need to be actively running for certain rules to fire at all. You can target profiles at specific device groups and test them on a subset of endpoints before rolling them out.
The defaults are a starting point. The configuration is where the score becomes genuinely yours.
How to stop waiting for employees to report IT problems
The reason Marcus never files that ticket isn’t laziness. It’s that he doesn’t think it rises to the level of a problem worth reporting. He just puts up with it, assumes it’ll sort itself out, and moves on.
Across an organization of thousands of people, that silent suffering adds up. It shows up in productivity loss, in deals that don’t close cleanly, in employees who quietly start blaming their tools.
The Experience Score doesn’t wait for Marcus to tell you something went wrong. It already knows. And it’s already been known for sixty seconds.
Ready to see what your employees are actually experiencing? Explore ControlUp’s scoring profiles →