
ControlUp offers a suite of dashboards and reporting tools to help IT teams monitor, understand, and manage enterprise AI adoption and usage trends across devices and applications.
The AI Report Dashboards provide insights into overall AI app/website usage, tool-specific comparisons (e.g., Copilot, ChatGPT), and active time spent, enabling data-driven IT decisions.
Global filters allow for granular analysis of AI usage by department, location, or device type, while a separate Copilot+ Readiness dashboard identifies hardware compatibility for next-generation AI experiences.
The new AI Tools feature in ControlUp for Apps (beta) offers deeper insights into prompt-level activity, potential PII, and AI model usage, further empowering organizations to optimize their AI strategy.
Explore AI adoption, compare the tools employees use, and investigate trends by device, department, or location with ControlUp’s Dashboards.
AI tools are rapidly becoming part of everyday work. From Microsoft Copilot and ChatGPT to Gemini, Claude, and AI coding assistants, employees have more ways than ever to put AI to work. But how do you know which tools people are using, how often they use them, and where adoption is taking off?
ControlUp ONE, an AI platform built on leading digital employee experience (DEX) capabilities, helps IT teams understand what happens across managed devices and applications. Its AI Report dashboards turn AI app and website activity into practical insights, available directly in the ControlUp Dashboard Gallery.
Why Monitor Enterprise AI Usage?
AI is no longer a future possibility—it is already part of many employees’ daily routines. That creates new opportunities for productivity, but it also raises questions for IT: Are employees embracing approved AI platforms? Are teams getting value from their tools? And which applications are growing in popularity without anyone noticing?
With ControlUp’s AI reporting dashboards, organizations can:
- Measure AI adoption: Understand how many users and devices engage with AI apps and websites.
- Compare app and web usage: See whether employees are working in installed AI applications or browser-based tools.
- Track time spent: Learn how much active time is dedicated to AI and how engagement shifts over time.
- Guide IT decisions: Use adoption data to inform training, license planning, security conversations, and policies.
What Can You Track with the AI Report Dashboard?
The Dashboard Gallery includes two complementary AI reporting views. Together, they show both the overall picture and the details behind individual tools.
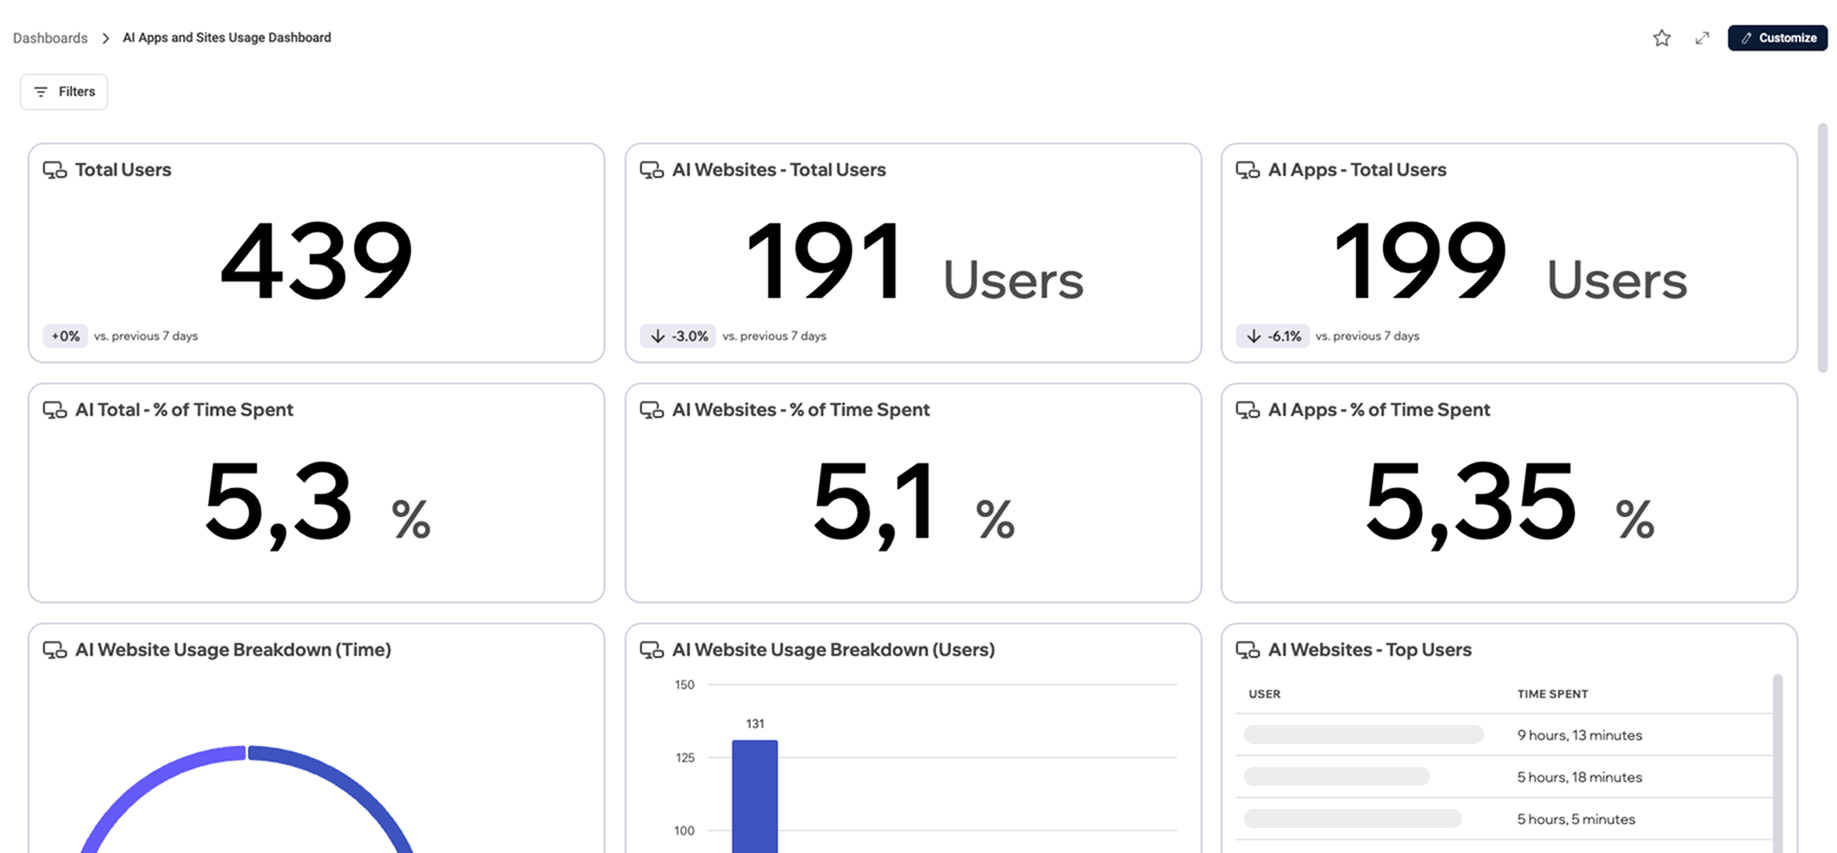
AI Apps and Sites Usage Dashboard
This view provides an organization-wide summary of AI activity, including the devices and users accessing AI applications and websites, the split between app-based and web-based usage, and the time spent using AI. It helps answer a simple question: How widely has AI become part of the digital workplace?
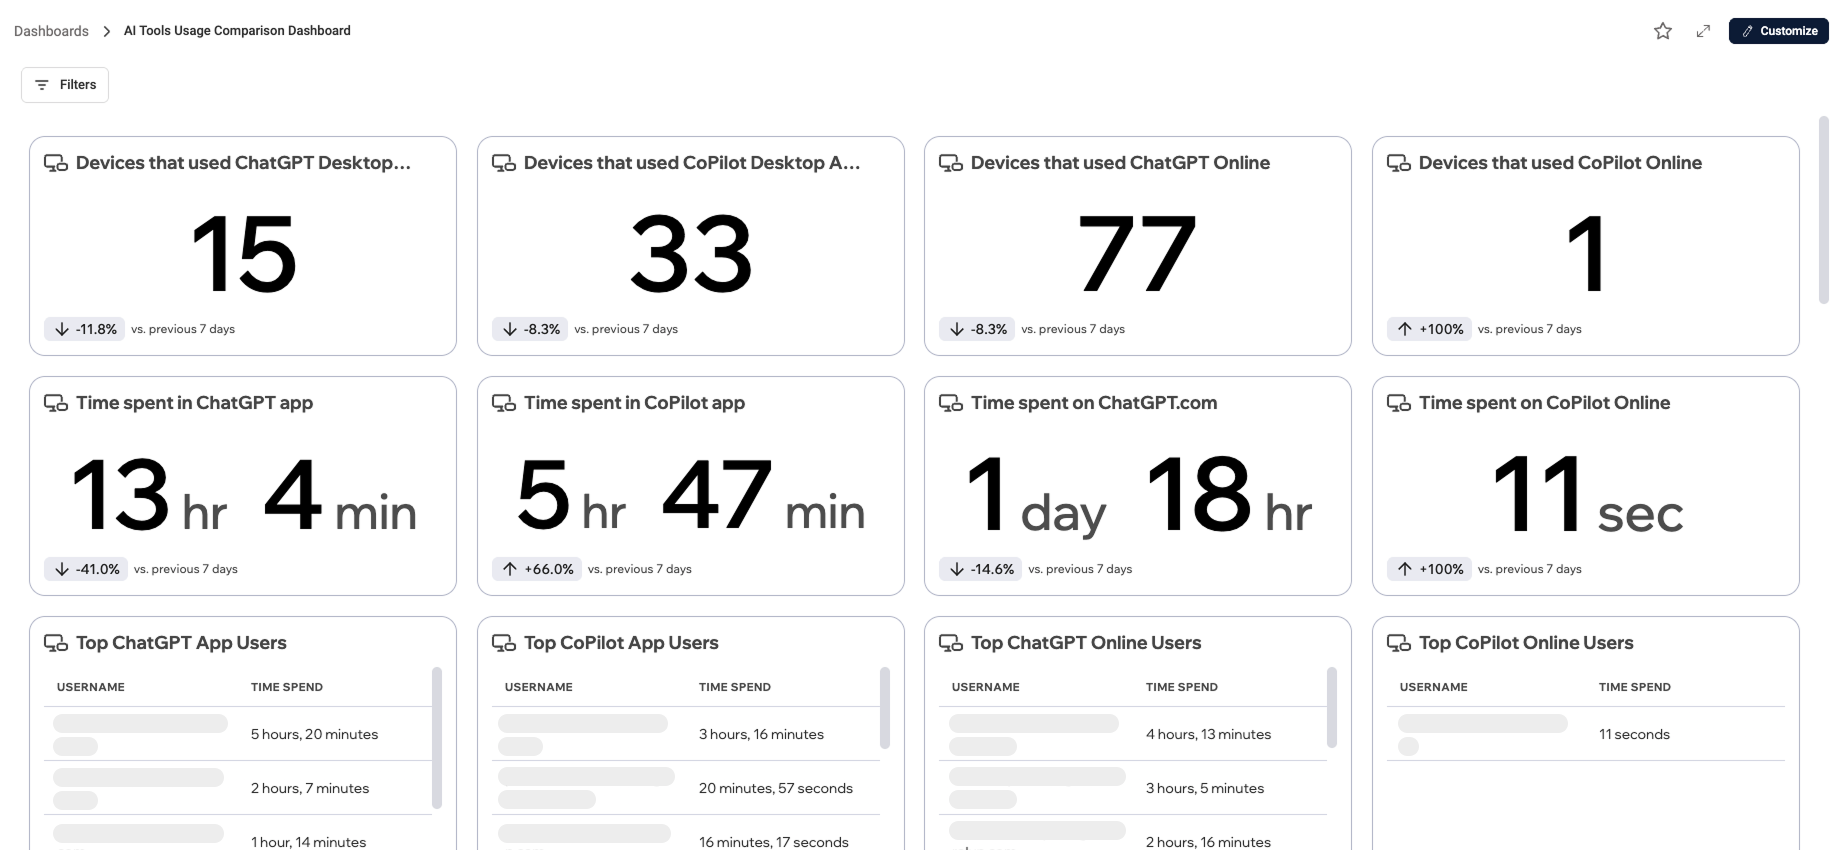
AI Tools Usage Comparison Dashboard
This dashboard takes a closer look at specific services such as Copilot, Gemini, ChatGPT, and Claude. Compare the number of devices accessing each tool, the time users spend in it, and the top devices or users behind that activity. These comparisons make it easier to see which AI products are finding an audience inside your business.
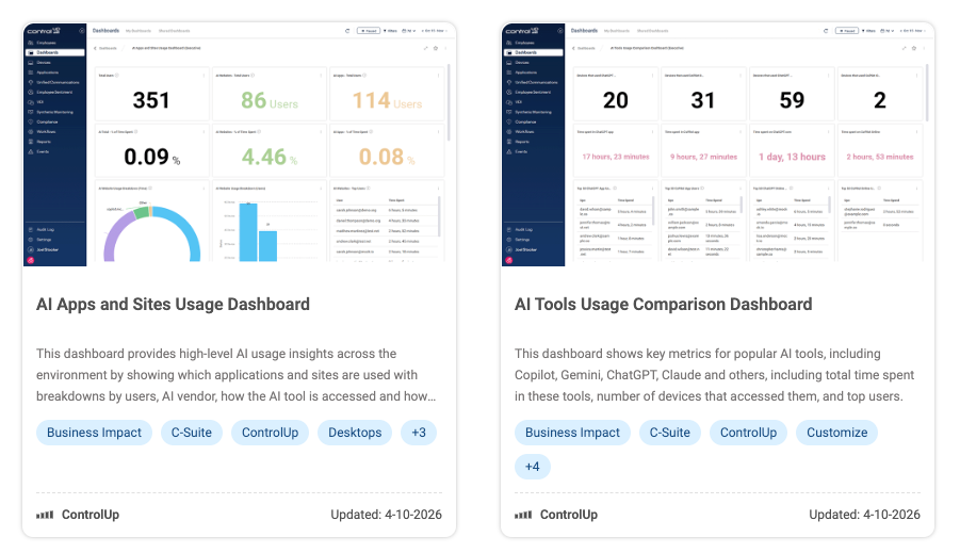
Depending on the view, key metrics include AI users and devices, overall adoption, the share of time spent in AI, tool-by-tool comparisons, and top-device activity. Looking at these measurements over time can reveal changes in adoption rather than just a snapshot of what is popular today.
Go Further with Global Dashboard Filters
A company-wide statistic is a good starting point. But the more interesting questions are often much more specific. Since the AI reporting views are built into ControlUp’s Dashboards, they can use global filters to narrow the scope of the data by device groups, locations, hardware manufacturers, device models, and other available device attributes.
For example, imagine asking: Which MacBook devices in the Finance group in New York are using AI, and which tools do they prefer?
| Apply these global filters: Finance (device group) · New York (location) · Apple (manufacturer) · MacBook (device model).
The dashboard then focuses on that device population so you can investigate its AI usage and tool preferences. |
The same approach makes it possible to compare departments, evaluate usage in different offices, or investigate which hardware populations are using a particular AI platform. Rather than guessing from an average, IT can examine the devices and teams behind the numbers.
Prepare for the Future of AI Devices—Track Copilot+ Readiness
AI in the workplace is not only about software. Microsoft Copilot+ PCs bring AI processing closer to the endpoint, using dedicated neural processing units (NPUs) to support on-device experiences. That makes hardware readiness another important part of an AI strategy.
A qualifying Copilot+ PC requires compatible Windows 11 hardware, including at least 16 GB of RAM, 256 GB of storage, and an NPU capable of 40 or more trillion operations per second (TOPS), along with the applicable Windows version and other Microsoft requirements.
ControlUp also offers a separate Copilot+ Readiness dashboard in the Dashboard Gallery. It helps IT teams identify compatible devices, understand which systems fall short, and plan upgrades or replacement cycles based on the actual endpoint estate.
How Can Copilot+ Readiness Reporting Help?
- Identify ready endpoints: See which existing devices meet the relevant requirements.
- Prioritize refreshes: Discover where an NPU or another hardware limitation prevents readiness.
- Inform rollout planning: Give IT and procurement teams evidence for pilots and wider deployments.
Together, AI usage reporting and hardware readiness insights help organizations understand both how employees use AI today and how well their device fleet can support the next generation of AI experiences.
Built into ControlUp, Ready to Explore
The AI Report views are available as prebuilt dashboards in the ControlUp Dashboard Gallery. There is no separate reporting environment to install or maintain: open the Gallery, choose a dashboard, and explore the insights using the same filtering capabilities as other ControlUp Dashboards.
Organizations can also create customized copies of gallery dashboards, adjust widgets, and tailor the visualizations to their own reporting needs. That flexibility makes AI reporting useful for IT operations, digital workplace teams, security stakeholders, and business leaders alike.
Going Deeper: AI Tools Beta in ControlUp for Apps
Knowing which AI tool someone opens is valuable. Understanding how people interact with those tools can reveal even more. That is the direction of the AI Tools Beta in ControlUp for Apps, which is bringing deeper reporting to supported AI interactions.
- Prompts: Gain insight into how AI is being used through prompt-level activity and patterns.
- PII: Identify potential personally identifiable information in AI interactions to help teams recognize data-handling risks.
- Model usage: Understand which AI models are in use, not just the application or website employees visit.
These beta capabilities complement the adoption and device-level insights available through the Dashboard Gallery. Coverage and access depend on the beta and supported experiences; organizations should consider applicable privacy and access policies when using more sensitive reporting.
Start Monitoring Your AI Landscape Today
You do not have to guess which AI tools are finding a place in your organization. With ControlUp, you can measure adoption, spot trends, compare popular platforms, and focus on the locations, teams, and devices that matter most.
Visit the ControlUp Dashboard Gallery to explore the AI Apps and Sites Usage Dashboard and AI Tools Usage Comparison Dashboard. Pair those insights with Copilot+ readiness reporting and the growing AI visibility offered by ControlUp for Apps to make better-informed AI decisions.