Getting accurate measurements in healthcare environments is essential. It is the only way to understand what is actually happening, how the environment is performing, how efficient users can be, and where the time is bleeding out.
Tap-to-app is a perfect example. A physician taps their badge on a terminal and expects their desktop or apps to show up. Simple in theory. In practice, that tap triggers a whole chain. The endpoint and badge reader have to register identity, Imprivata has to do its credential magic, and then your EUC stack such as Citrix, Horizon, or AVD has to reconnect or launch what they need. Any one of those steps can stall, and when it stalls, the physician feels it immediately.
And here is where it gets messy. Physicians will tell IT it is slow, and IT will say some version of “it is fine” or “it is working as designed.” So the physician does the only thing they can do to be believed. They time it. I have literally seen clinicians pull out a stopwatch and start measuring tap-to-app just to prove their experience is real to IT.
IT has, traditionally, only been able to measure parts of the story. With ControlUp on the VDI side, IT can measure logon phases, reconnects, and app launch timing. But tap-to-app does not start in VDI. It starts at the endpoint, at the badge tap.
Now, with ControlUp and IGEL, we can measure both sides.
With ControlUp for Desktops and IGEL on the endpoints, we can capture the tap event and what happens immediately after it, and correlate that with what ControlUp sees in the VDI session. That gives you the full tap-to-app timeline end to end, with proof.
No stopwatch required.
Let’s get into how.

Operation
The Tap-to-App measurement works by collecting data from two sources, an IGEL device with Imprivata and the VDA. When the user logs on to the VDA an automation will run to gather the data for the VDA side and store that in your ControlUp for Desktops tenant data index. The automation will then tell ControlUp for Desktops to run the data collection on the IGEL device. On the IGEL device data will then be collected and stored in the ControlUp for Desktops tenant. Lastly, the data will be merged.
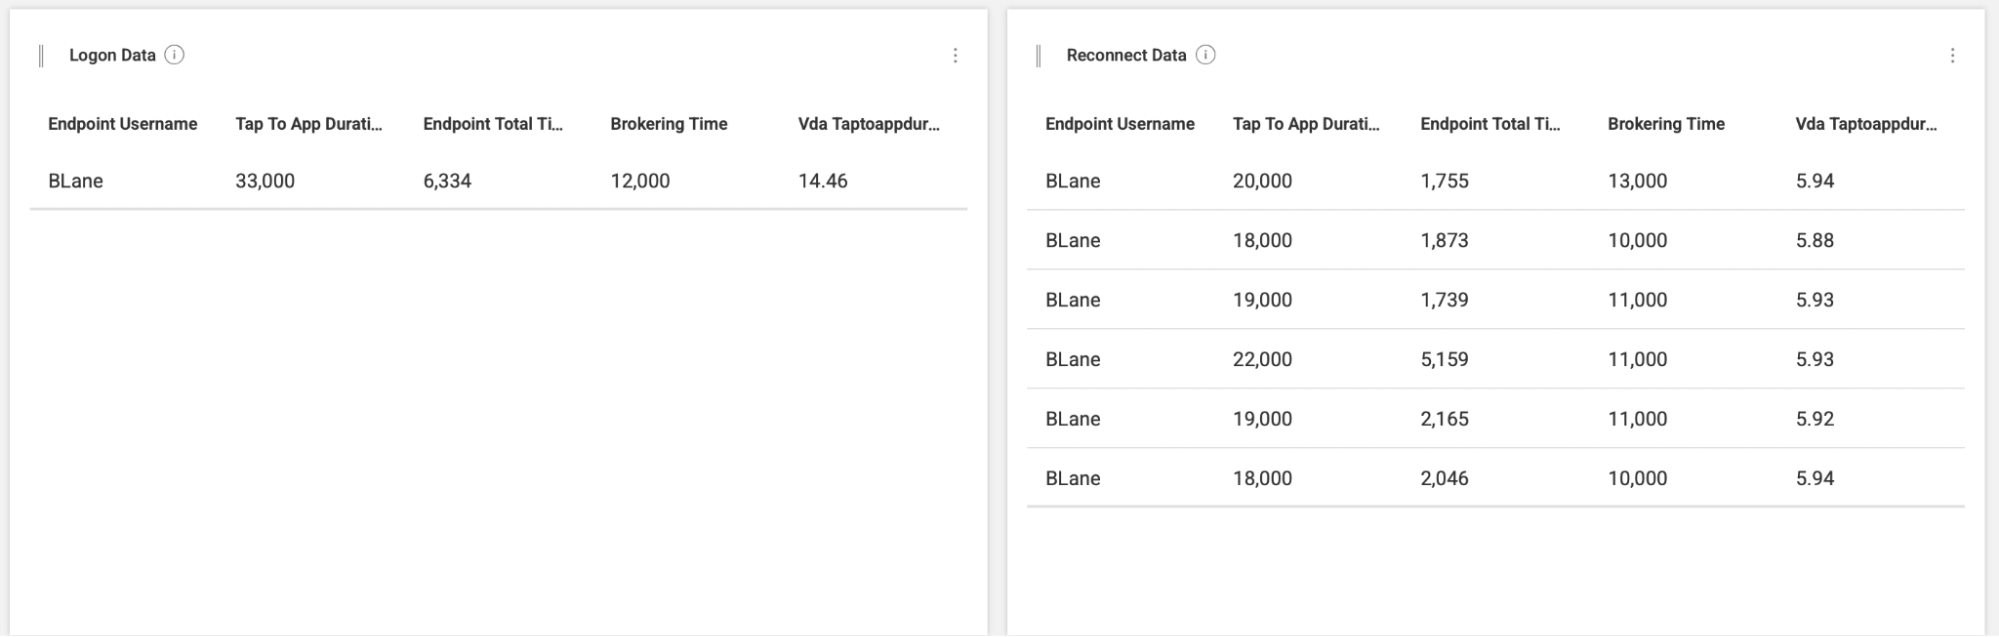
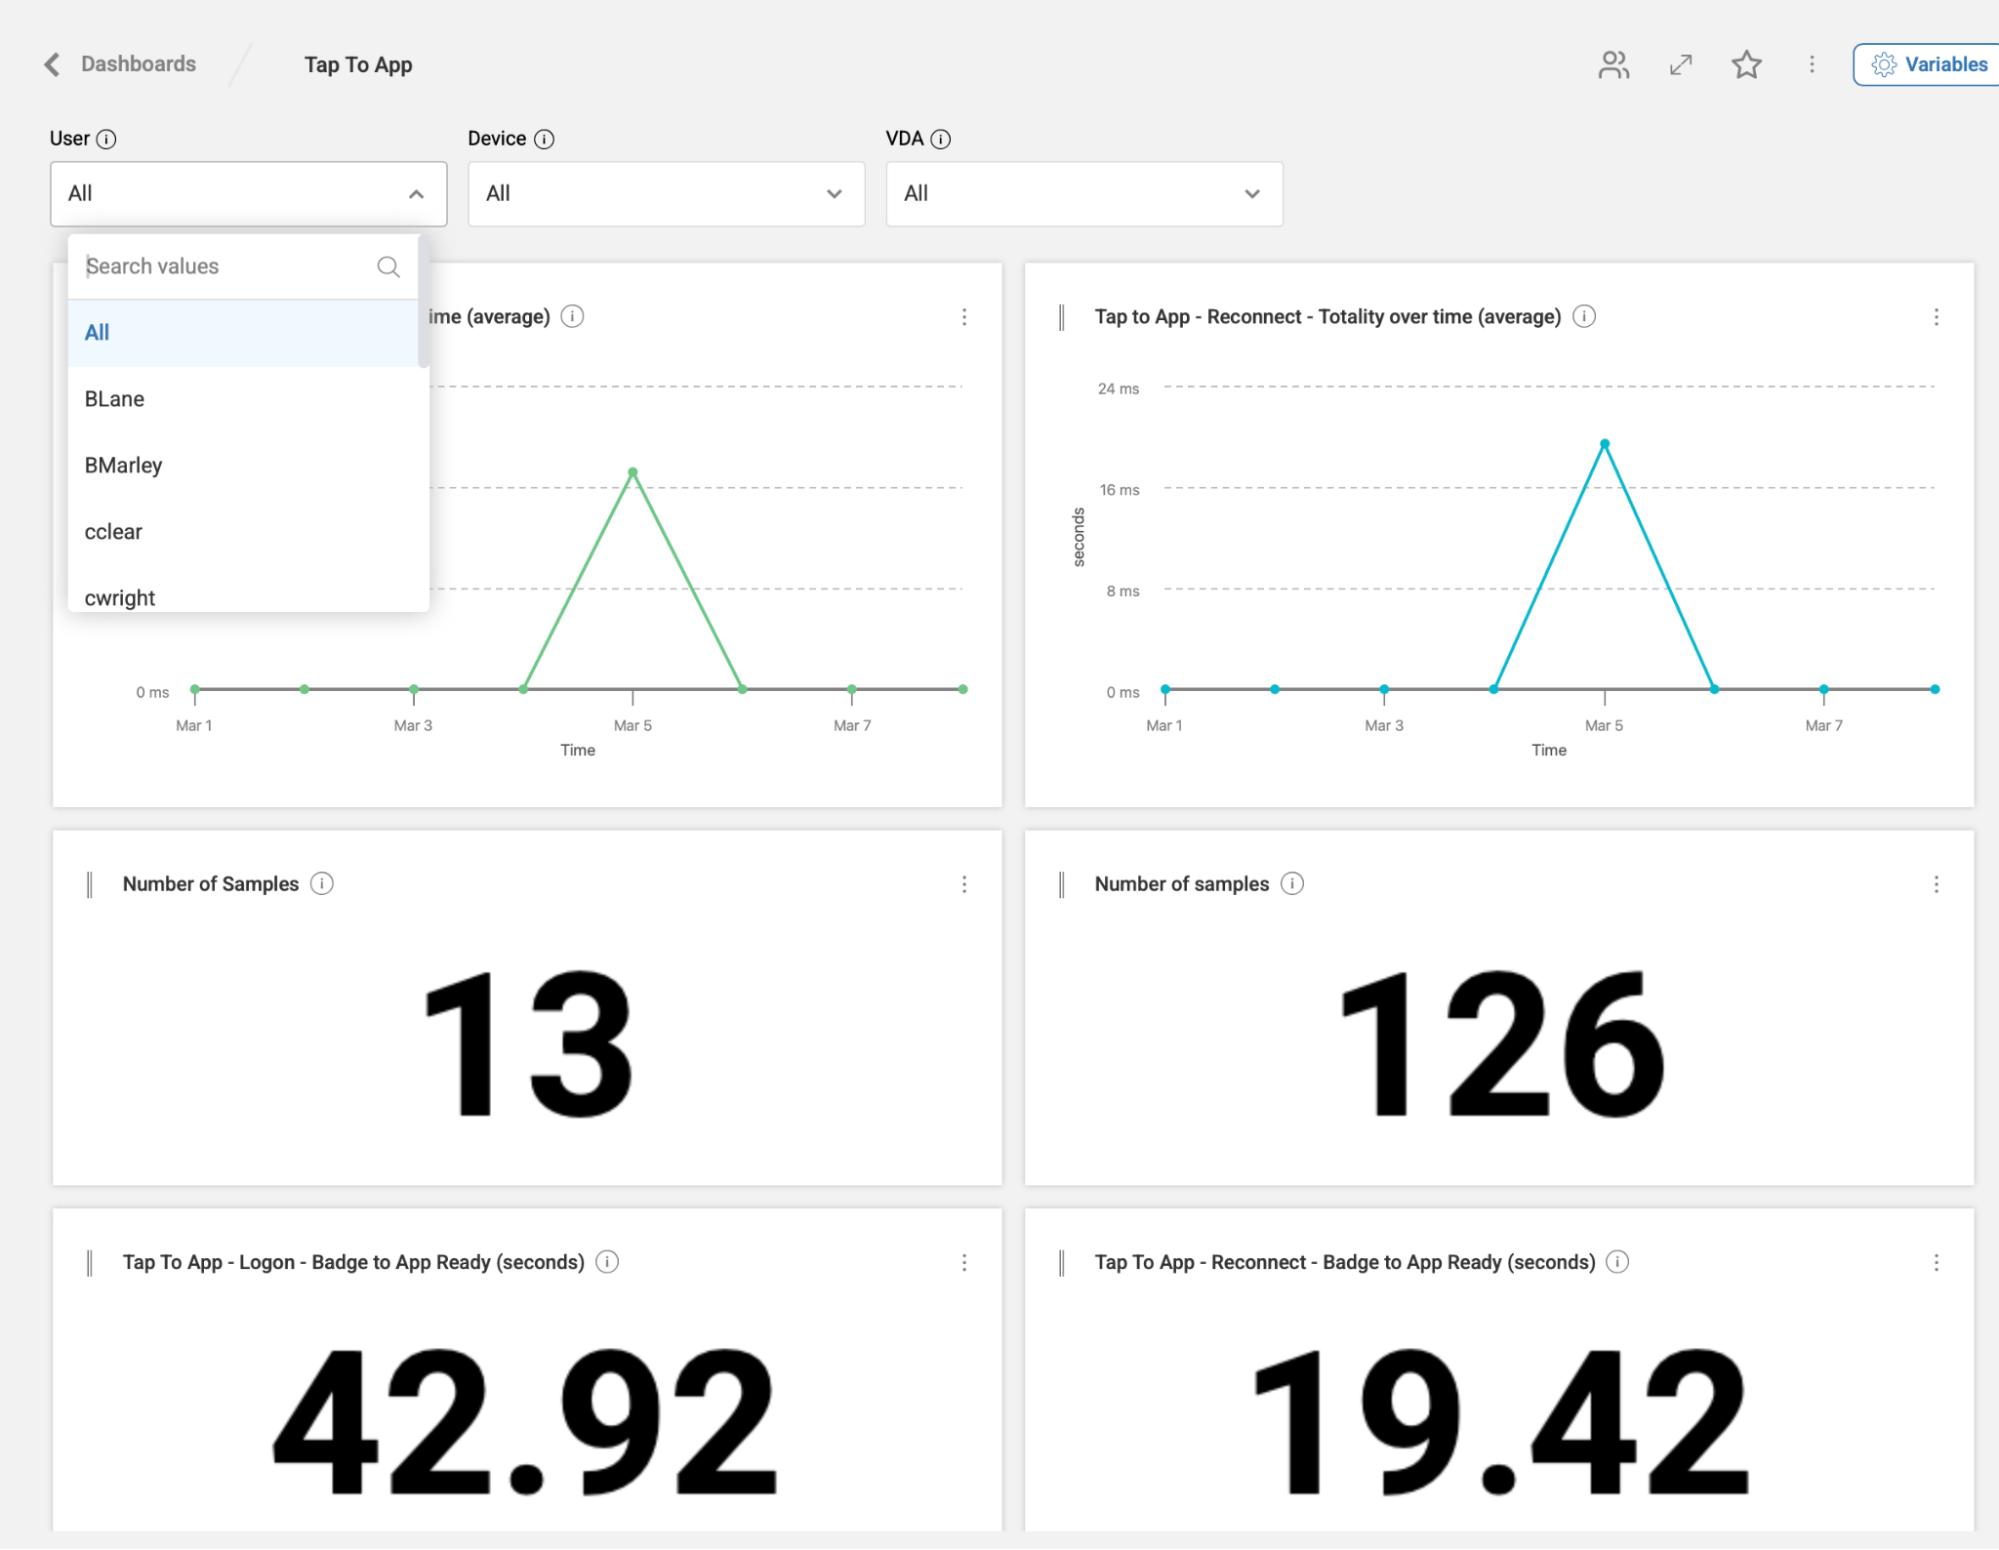
With Dashboards the data will be presented and you can filter on a user, device, the VDA or some combination of those properties

Filtering for a user can show you their tap to app journey’s throughout the course of a day, week or month. The left side shows their logon events with the right side showing their reconnects
Pre-requisities
IGEL
On the IGEL side ControlUp for Remote Clients needs to be enabled, the IGEL device needs to be enrolled in your ControlUp tenant and IAFI debug logging needs to be turned on.
VDA
On the VDA side there needs to be some settings enabled so the data required is captured. These are the following group policy settings:
- Windows Settings > Security Settings > Security Options > Advanced Audit Configuration > Audit Process Creation and Audit Process Termination (both set to Success)
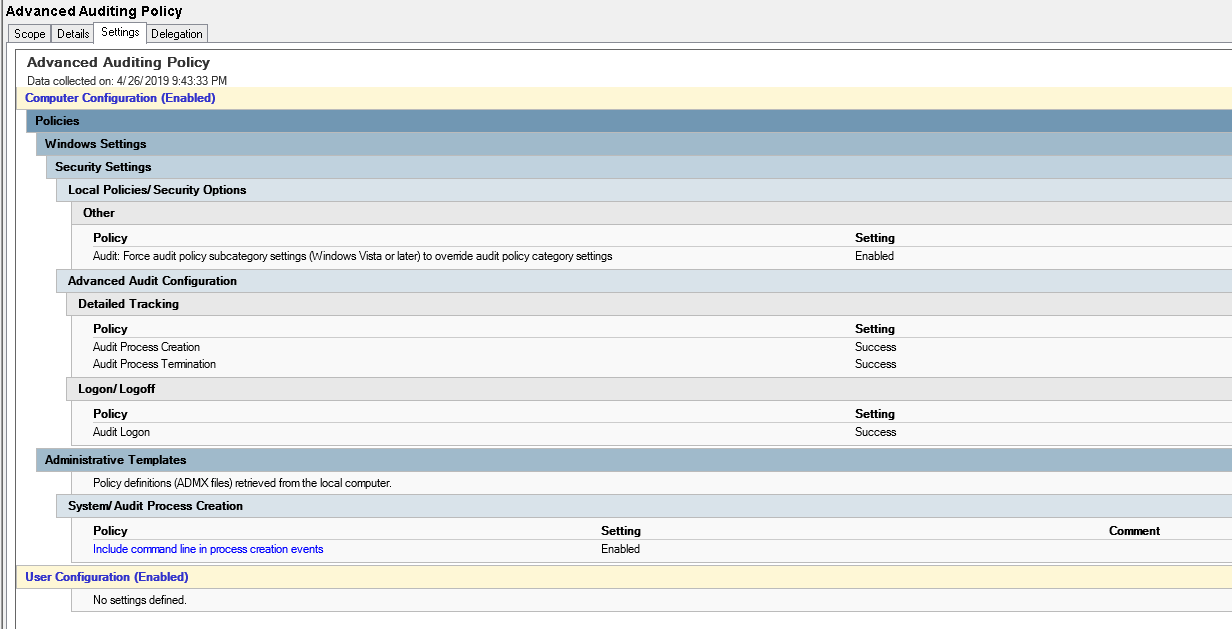
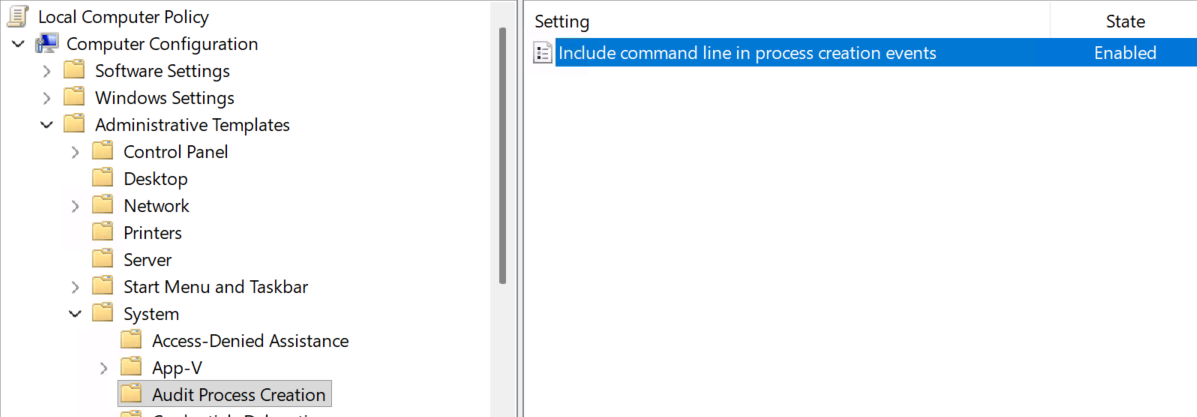
- Computer Configuration > Administrative Templates > System > Audit Process Creation > Include command line in process creation events > Enabled
ControlUp for VDI Configuration
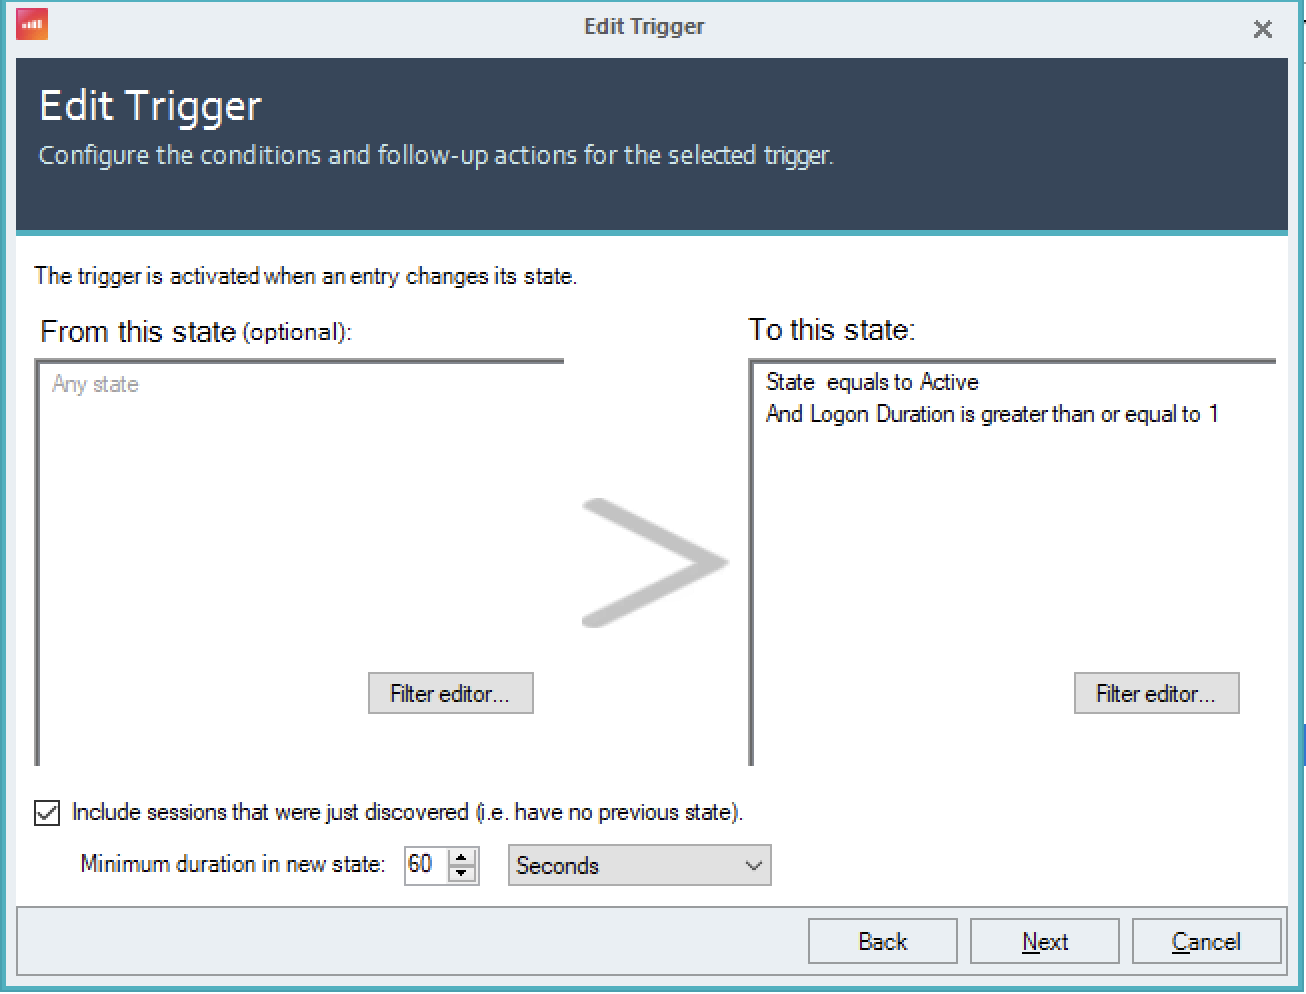
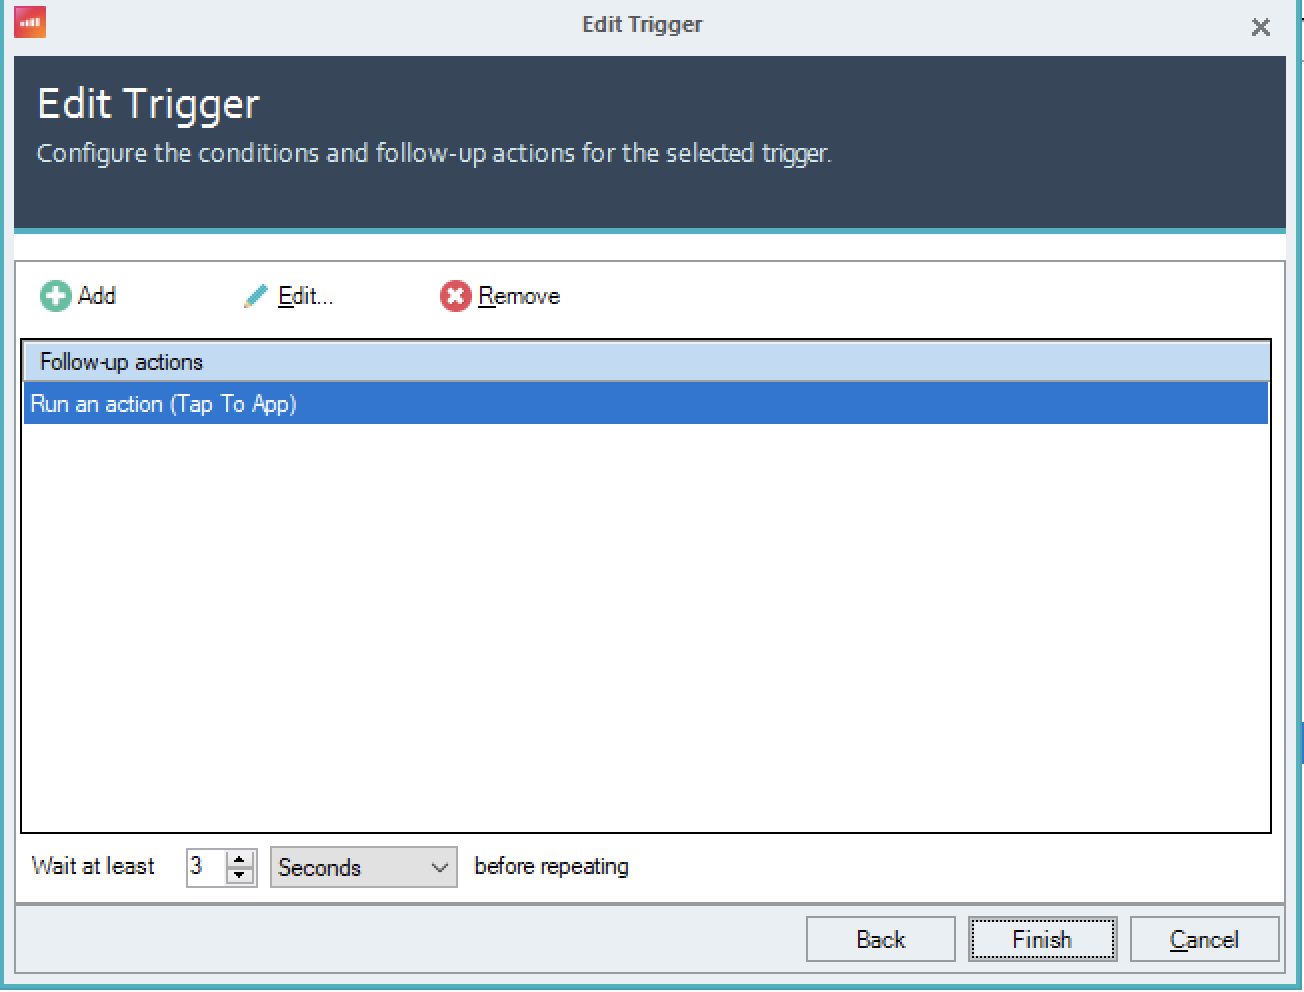
On ControlUp for VDI a trigger will need to be created that will capture when a user logs on or reconnects to a session. The trigger will run the automation that gathers all the data from the VDA then start the data collection process for the IGEL endpoint.
ControlUp for Desktops
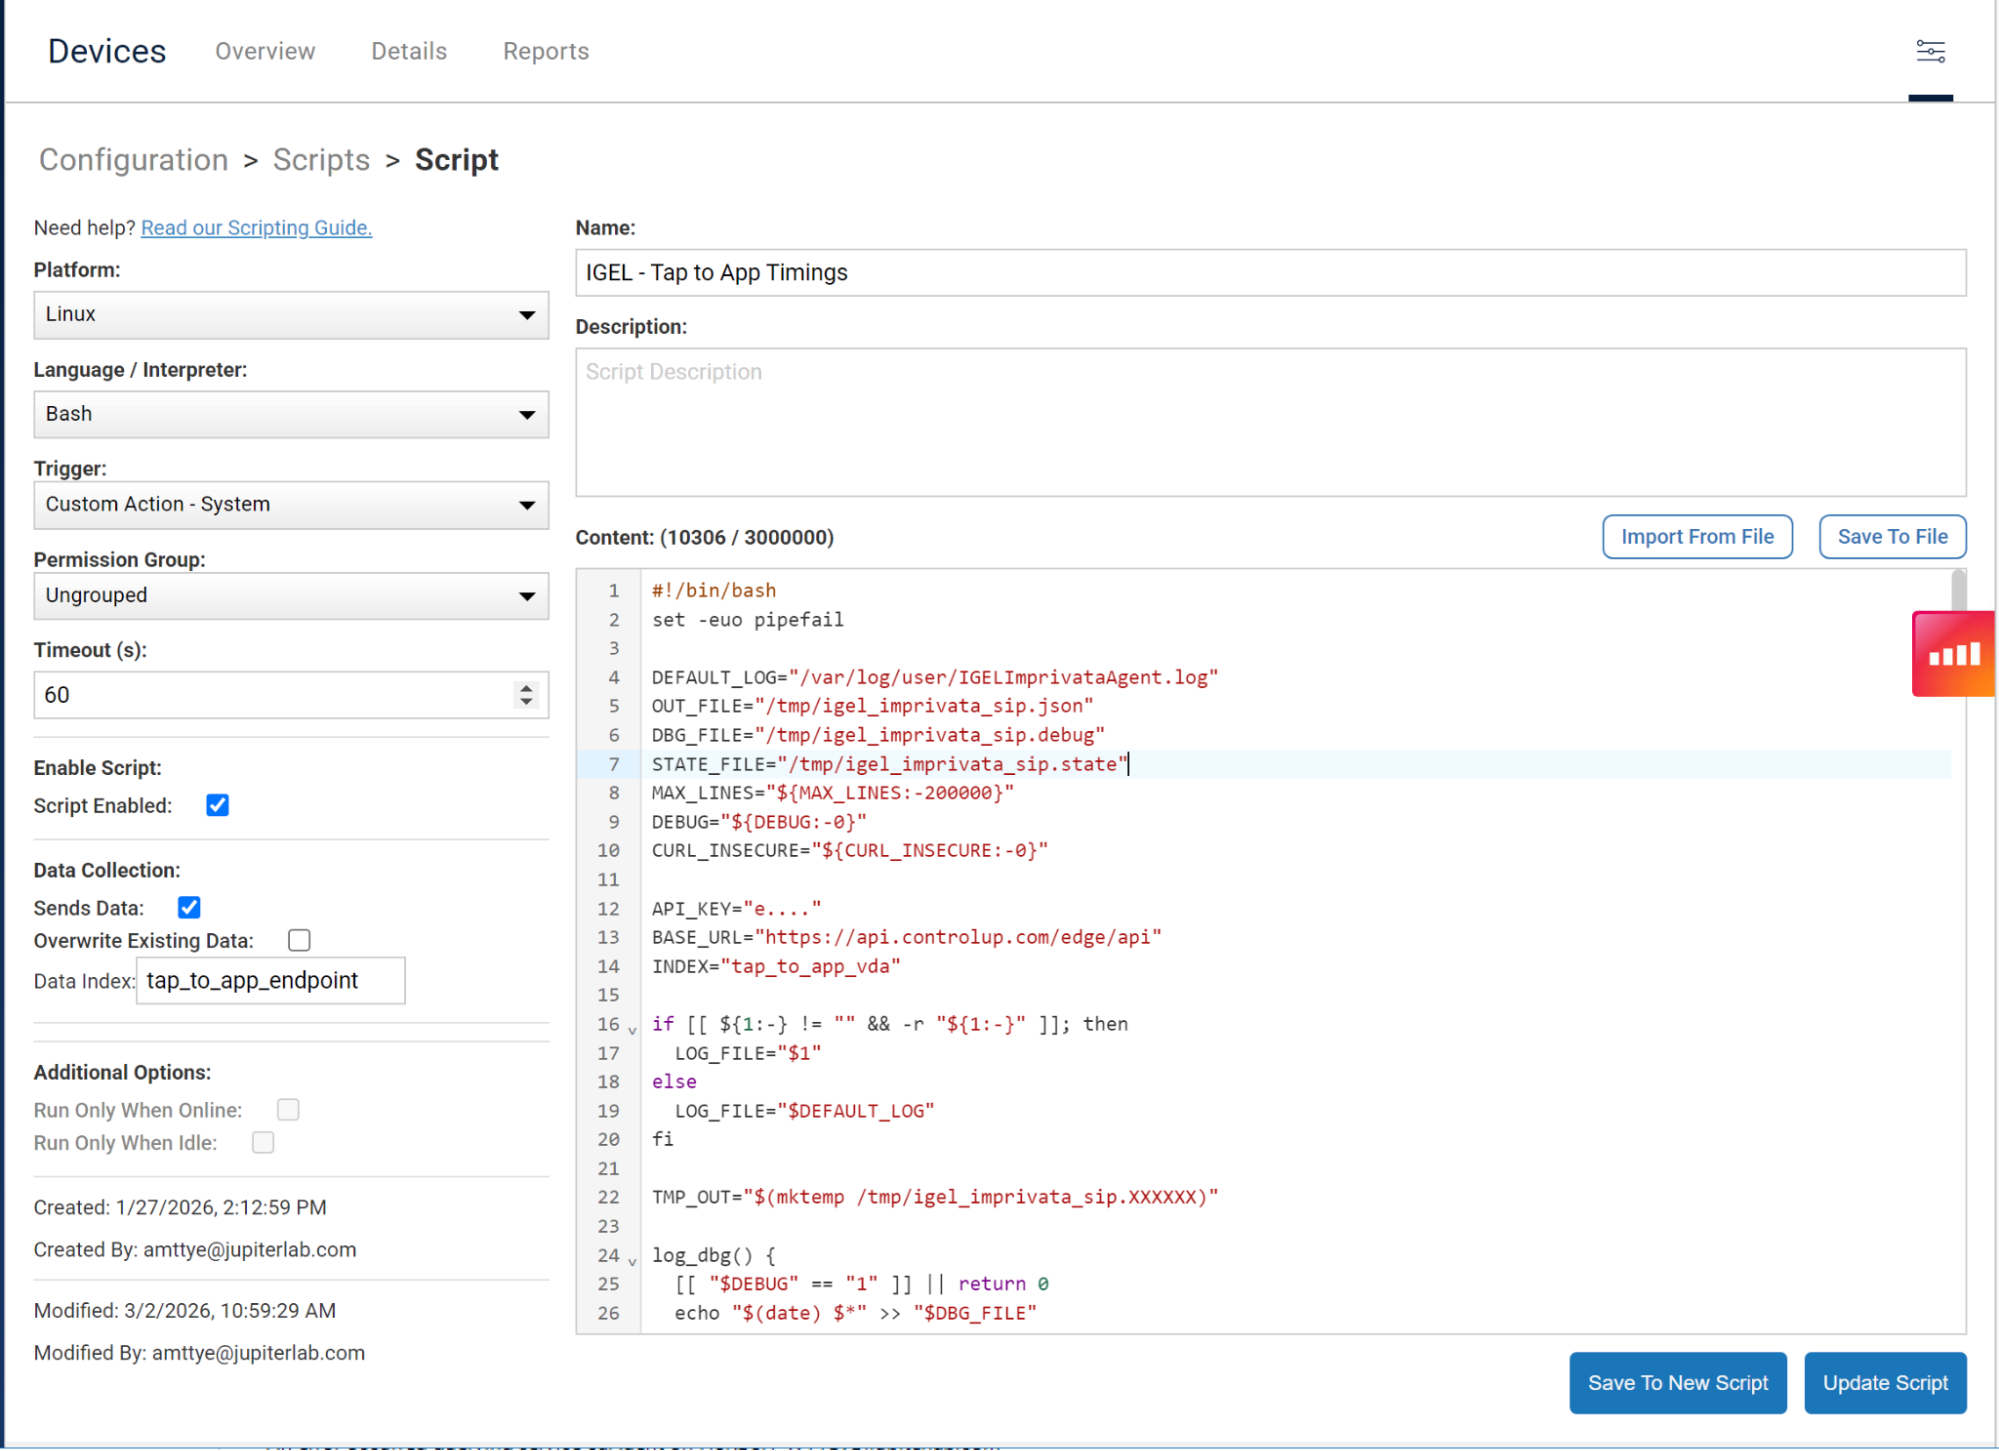
On the ControlUp for Desktops side, a script will need to be added that will collect the data from the IGEL endpoint
Dashboards
With the automations in place, a final script will need to be run periodically to aggregate the data for presentation in the ControlUp Dashboards feature.
Tap-to-App is too important to leave to guesswork, partial metrics, or stopwatch testing. With ControlUp, you can capture the endpoint event, correlate it to the VDI logon or reconnect, and surface the full workflow in a way that is measurable, repeatable, and actionable. If you are ready to instrument Tap-to-App in your environment and see exactly where time is being lost, contact your ControlUp account representative to get the solution deployed