
In case you missed it, ControlUp for VDI v8.6.5 is now generally available! In addition to improved Citrix Provisioning Services (PVS) metrics, there are updates to our logon duration analysis, trigger and script enhancements PowerShell CMDLETs, new integrations for vROps, a wide array of updates to our third-party integrations, and more. It’s the most advanced version of ControlUp ever.
https://www.controlup.com/blog/entry/controlup-announces-real-time-dx-v8-6-5-for-vdi-daas-environments/
Citrix PVS Troubleshooting
Citrix Provisioning Services (PVS), one of the coolest on-prem (and now cloud) technologies to ever exist, allows you to boot multiple machines from a single VHDX file. The benefits of PVS when deploying at scale are massive and include increased consistency and reduction in support across endpoint devices.
At ControlUp, we place our customers’ needs first and want you to fully benefit from this technology. That’s why we are excited to announce, with ControlUp for VDI v8.6.5, we fully support metrics directly from your PVS environment!
Over time, Citrix has improved PVS to ensure users’ target devices get the best performance and reliability. For example, they’ve introduced features like “Cache on device RAM with overflow on hard disk,” which made PVS a must-have for any on-premises Citrix deployment.
But while PVS has numerous benefits, there is still a lot of complexity in its architecture in understanding the limits within your environment. Some common questions you may be asked when troubleshooting PVS:
- Is your storage able to service a VHDX file being read by hundreds of devices?
- Are your host’s CPU and network capable of translating hundreds of hard disk IOPS into network traffic and back?
- Do you suffer from boot storms?
- Are all your target devices configured to boot from the correct image?
- Across hundreds or thousands of PVS target devices, are you running out of space on your write cache devices?
Wouldn’t it be great to have this information available in a grid view where you could see it at a glance? Where outliers stick out like a sore, red thumb? We’ve got some great news for you because in Real-Time DX v8.6.5, you can do exactly this (and a whole lot more).
So, tell me all about Citrix PVS troubleshooting metrics in Real-Time DX!
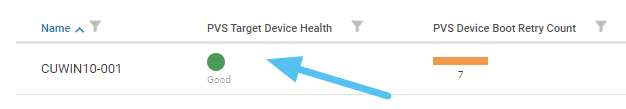
Let’s start with our PVS master column “PVS Target Device Health,” which works for you to aggregate the most critical PVS device columns together, making some calculations based on Citrix Best Practices + ControlUp Experts’ recommendations to generate an accurate “health” status of your PVS Device.
READ all about our integration with CVAD (now Citrix DaaS), including columns and grids.
Click the “Health” column to discover a full PVS Drill-Down View, which contains multiple new PVS Device metrics. This awesome column is now available in your VDA Machines view.
We have collected the most valuable metrics that are relevant to any PVS Target Device, to give you better visibility of what’s going on in your environment:
How do all these metrics help you in your environment? Let’s take a real example we see in the ControlUp lab:
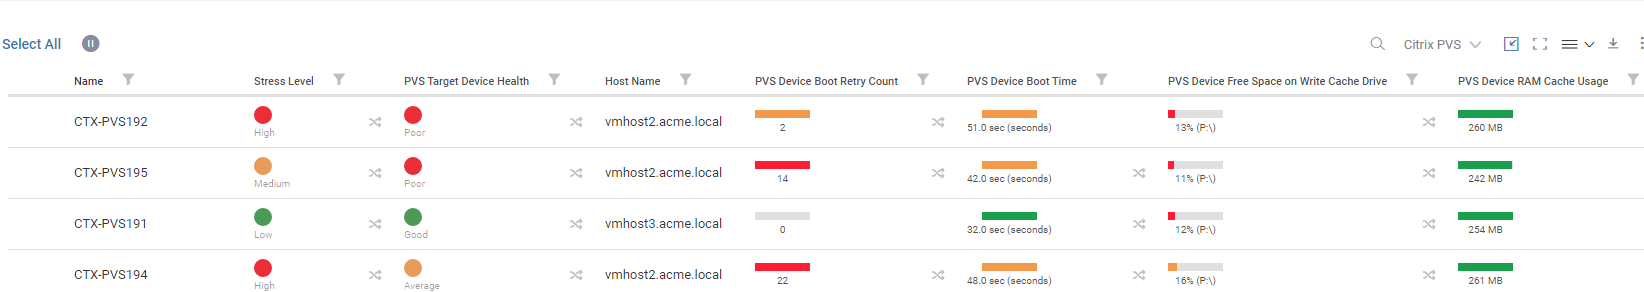
Out of these three PVS target devices, which one is healthy and which ones are not?
We can immediately and easily identify that we have target devices spread across two hosts: vmhost2 and vmhost3. Vmhost2 has a healthy target device with no retried packets for either the boot process or afterward. However, target devices on vmhost3 have had packet retries in both the boot process and in-use retry counts. Since each retry is an IOP that had to be requested, a couple of hundred packets getting retried over the week or so isn’t really a big deal. But we can easily identify an optimization opportunity here. In this case, we should ask ourselves:
- Why is vmhost2 performing so much better?
- Is it because it has less load on its CPU than it can service these packets?
- Is the PVS image local to that host and not the other?
With answers to these questions, we can begin our investigation with some evidence that something is different between these hosts!
Without ControlUp, correlating this information is a fairly laborious task. The effort to gather everything and review it is manual and time-consuming. But with ControlUp, you can view everything from one simple console!
Another awesome thing about ControlUp is that it shows you the PVS RAM Cache Usage. Different PVS images have different cache values applied. Our PVS images have a cache value of 256MB, which we can easily see has been consumed entirely and, thus, overflow to disk is occurring. We can tie this into ControlUp Automate if we want and do cool things like set the machine into maintenance mode if the “Free Space on Write Cache Drive” drops below X%. Then we can have the machine automatically reboot once the last user logs off and make the machine available again. With ControlUp, you can do all of that automatically!
Upgrade to ControlUp Real-time DX v8.6.5 and gain increased visibility into your infrastructure! If you haven’t tried ControlUp yet, why not? Start a free trial today (the first three weeks are on the house)!
Learn more about the amazing new features included in Real-Time DX v8.6.5.
Register below for our webinar on June 8, 2022 and watch live demos on some of the latest features in Real-Time DX v8.6.5: