
Businesses buy computers to run applications that allow users to complete tasks quickly and efficiently. To help meet businesses’ needs, IT teams play a significant role in tracking important information, such as where applications are deployed, how often they are used, and when they, or the devices on which they run, crash. ControlUp for Desktops has tools and reports that can assist us in effectively analyzing these areas. In this article, I will look at a few available tools to help you answer the questions above.
Application Information
Applications are the lifeblood of any organization; however, they can be expensive, and like any asset, wise usage is a must. We need to know where applications are running and by whom so we can recover licenses if they are not required.
To gain an understanding of the application usage within your organization, Edge DX has pre-defined reports available to use. To access these reports, select the Reports tab from the home dashboard.

To see the most frequently used Windows applications in your organization, select Application Usage Statistics under Windows Apps & Processes. Then sort by the Users column to see how many users are running a specific application.
NOTE: If a system has multiple user accounts, you may see multiple users of that application on the device.
To get a list of the first 10 devices using the current version of an application, click the “<” icon in the Expand column. You also have the option to export the entire list of devices to your local system by exporting it as a CSV file.

When running reports, specify the time range from the time selector in the upper right.

This report breaks down applications by version number. To see the usage of a specific application by version, enter the application name in the Application name filter text box.
The screen capture below shows that multiple versions of Microsoft Teams are in use. Expanding the row of any given application version lists the devices in use.
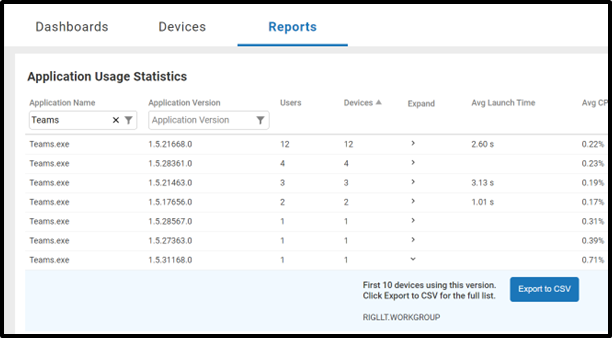
The Application Usage Statistics report shows applications that were used, different from what applications have been installed on the system.
The Installed Applications and Installed Applications by Version reports will show what applications were installed on the devices. You can limit the information that you are viewing by using filters. For example, you can filter for a device name to see which applications are installed. This report lists the applications installed on Windows, macOS, and Linux-based devices.

Specific device information is also available on the device’s dashboard by selecting the Installed Applications tab.

Under All Devices is the Top Installed Applications report displaying data in a graphic format.

Using the time range and export feature in conjunction with these reports, I created an Excel graph showing the usage of some of our licensed applications over time and identifying instances where some of our more expensive applications were no longer being used. In these cases, licensing costs are recoverable.
Application Crashes
Applications will occasionally crash. When this happens, we not only need to be notified, but we also need a historical reference of problematic applications. You can use the Top Processes by Application Crash report to identify them.

From this list, you can identify and investigate the applications that are having issues.
Having historical information is essential, but being alerted immediately when an application has issues can assist users in recovering from the crash and allow you to proactively address the problems in real-time. Windows logs the error code and directory to the executable file of an application when it crashes. We can capitalize on the Windows Event ID 1000 code which indicates that the application has terminated unexpectedly for an unknown reason or cannot run.
Edge DX’s trigger feature notifies us when a Windows application crashes. Application crashes are captured and contained in Edge DX’s win_event_log data index. To be alerted to these events, you can create a trigger that has the following attributes:
- Device Platform = Windows
- Time Window <= 60
- Number of Hits = 1
- Retrigger = 30
- Event ID = 1000
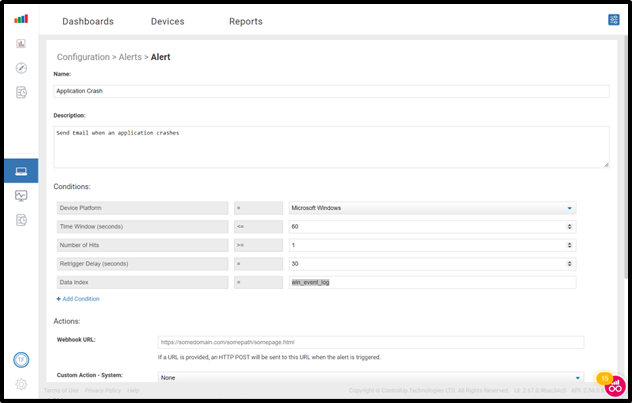
Windows Event Logs are captured and sent to Edge DX every 60 seconds, so the time window is 60. “Retrigger” refers to how long before the alert fires again; I set this to 30 seconds in case multiple events are sent. You can read more about alerts and triggers here.
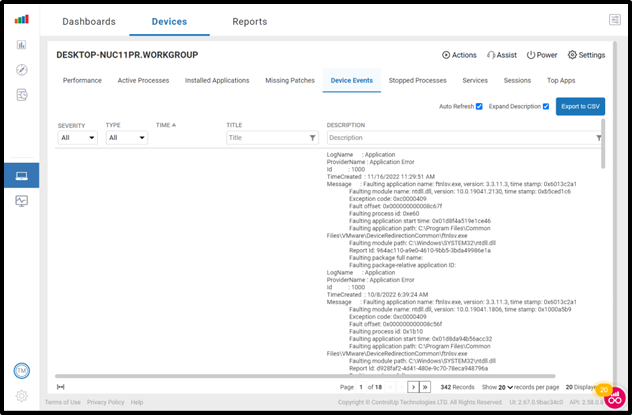
Once an alert is sent, you can use the event viewer on the device to gather more information about the event. To do this, navigate to Windows Logs > Application, and then find the latest event with “Error” in the Level column and “Application Error” in the Source column.

You can then select the event and see more information about it.

While using Event Viewer and going through the logs is a powerful tool to get more information about application crashes, Edge DX is all about simplification, automation, and dealing with devices at scale. As such, below is a script action that I could run against a Windows device to display the last three application crashes. Below is the code and a screenshot of the output:
[Console]::OutputEncoding = [System.Text.Encoding]::UTF8 # This line is added automatically to help with Unicode characters. Please add your code below

[array]$arrEventInfo = @()


#Events criteria

$Filter = @{

    LogName      = 'Application'

    ProviderName = 'Application Error'

    ID           = 1000

}


$arrEventInfo = Get-WinEvent $Filter -MaxEvents 3 | select LogName,ProviderName,ID,TimeCreated, Message


Write-Output $arrEventInfo | Format-List


Write-Output("### SIP EVENT BEGINS ###")

Write-Output $arrEventInfo | Format-List

Write-Output("### SIP EVENT ENDS ###")
System Crashes
An application that occasionally crashes can be a nuisance, but when an entire system crashes, it can take much longer to recover with possible data loss. The User Experience dashboard has widgets labeled Devices with Most Reboots and Devices with Top Blue Screen Events

This information can identify problematic devices. Clicking a device in the widget will take you to a report with this information. This report is also accessible from the Reports dashboard.

You can export the data from here or click one of the devices. This will bring you to that device’s dashboard page, where you can see more information about it, including historical resource utilization, the OS version, and hardware information that may be useful when getting to the root cause of the crash.

Patching the OS is often a solution for preventing crashes. The Missing Patches tab highlights the available patches for the machine.

Seeing the OS patches missing on a single system is beneficial when diagnosing an issue with a single device, but proactively identifying unpatched devices in an organization is better. To assist with this, Edge DX has a Top Missing Patches report.

Scripts are available for mass patching or updating multiple devices in your environment. Some of the scripts that I have in my script library to assist me with this are:
- Get MS Windows 11 Hardware Readiness
- List Windows Updates
- Apply Windows Updates
- Check Windows License Activation
- Check If a Windows Update Is Installed
- Display All Windows 1000 Events
- Create Windows Log Event
Applications make us efficient at completing our tasks, and we need to ensure that they are both healthy (i.e., not crashing) and being used wisely. To meet these requirements, Edge DX has reports and tools to help monitor and address issues. Reports can assess the health of your applications and devices and identify devices and applications with problems. But the real power of Edge DX is its ability to automate and correct errors at scale through built-in tools such as its powerful automation engine and script actions.
Get Started
For those of you interested in checking out ControlUp, either take us for a test drive – a sandbox-style platform where you can experience ControlUp firsthand, download a free trial, or schedule a demo to learn more!