ControlUp VDI and DaaS provide robust monitoring and remediation capabilities, especially in environments like Azure Virtual Desktop. By identifying issues and troubleshooting them, ControlUp can manage the performance of your entire IT infrastructure. This article calls out just some of the performance metrics included with ControlUp that allow IT Administrators to maximize end-user support for remote work environments and deliver the best digital employee experience.
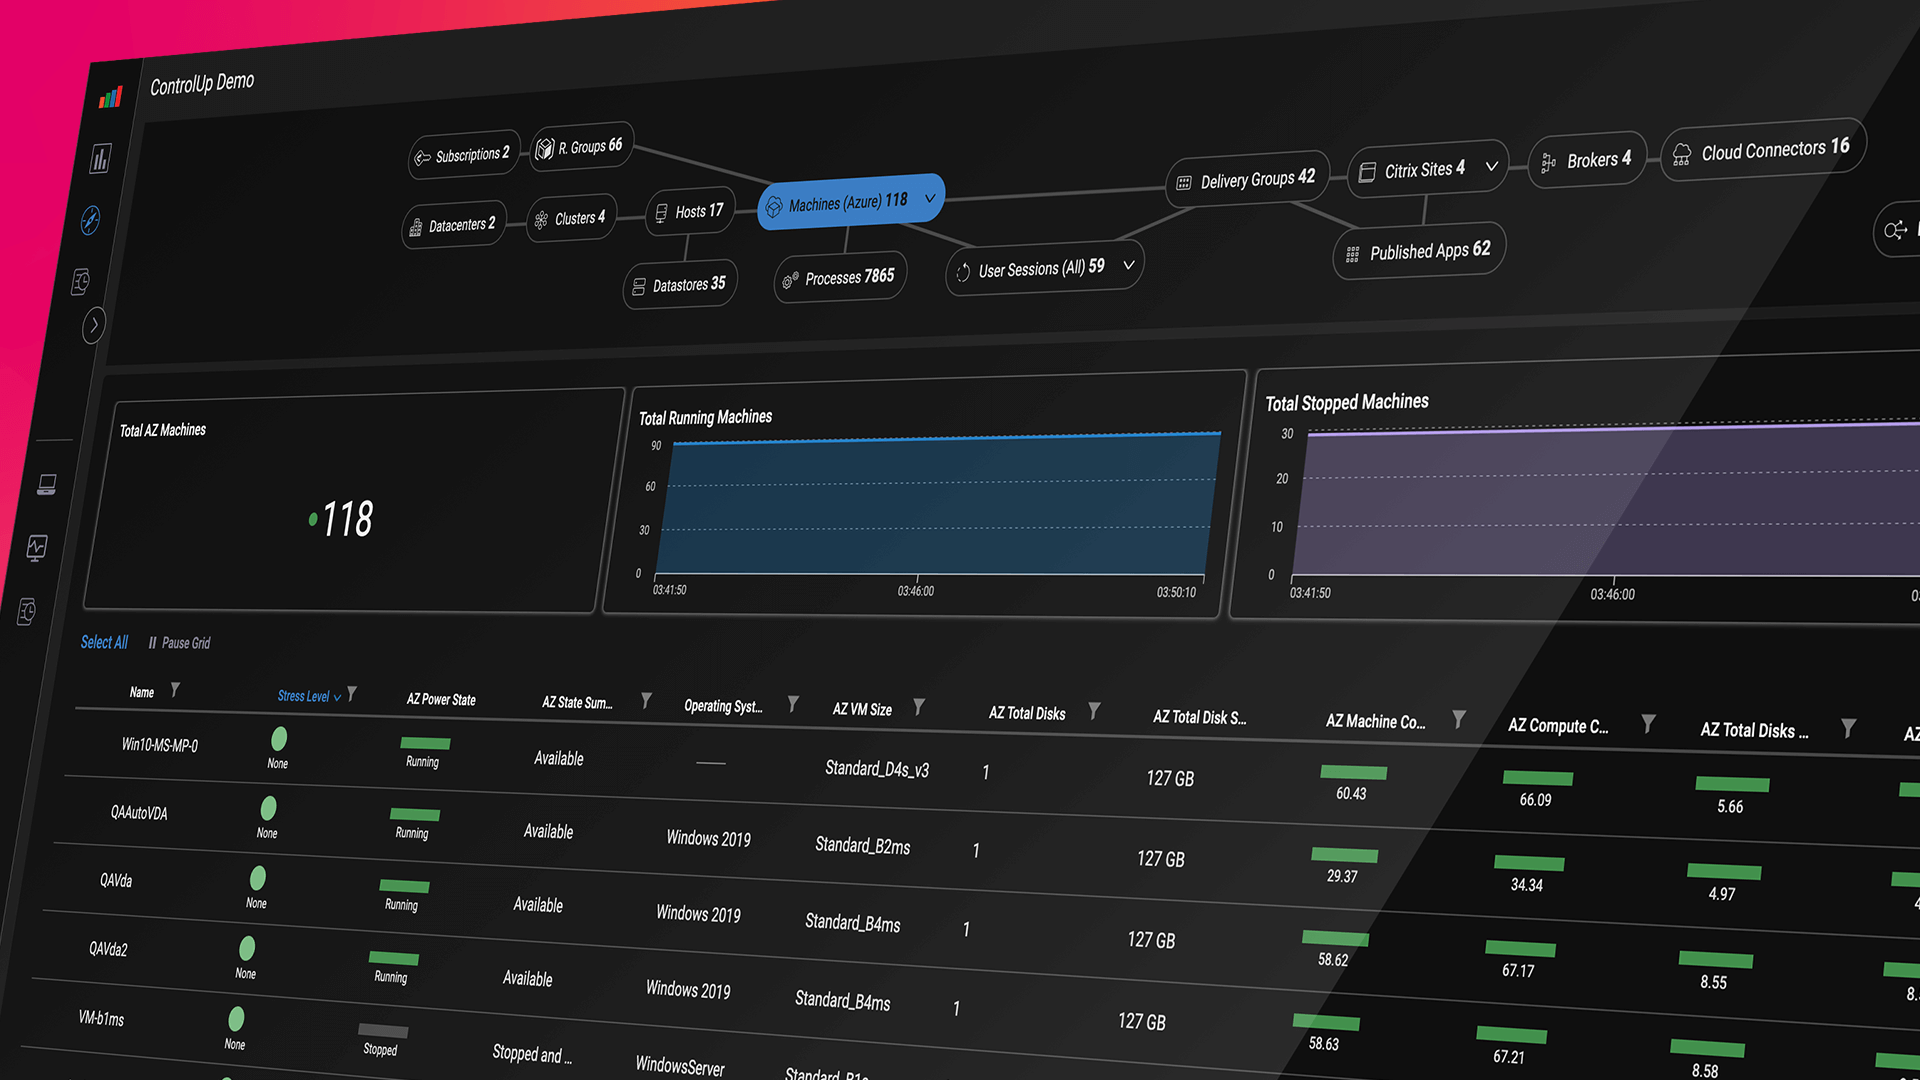
ControlUp displays thousands of metrics in real-time. Real-time means that the data is being collected and reported on at that moment. ControlUp pulls this information from multiple sources, whether it’s from the machine, the cloud, or EUC providers like Citrix, VMware, or Microsoft. With this data from ControlUp, you get a snapshot of the performance of your environment and you can execute an action or automate remediation tasks based on specific metrics – so that common issues are addressed right away.
Watch a brief video highlighting the advanced performance metrics for troubleshooting Azure Virtual Desktop sessions provided by ControlUp VDI & DaaS below.
Regarding Azure Virtual Desktop sessions, Microsoft has a set of performance counters that ControlUp monitors. These performance counters are unique to Azure Virtual Desktop or Remote Desktop Protocol (RDP) sessions and can help troubleshoot your environment’s issues. I will review these performance counters and describe what you might see in your environment and how to interpret them.
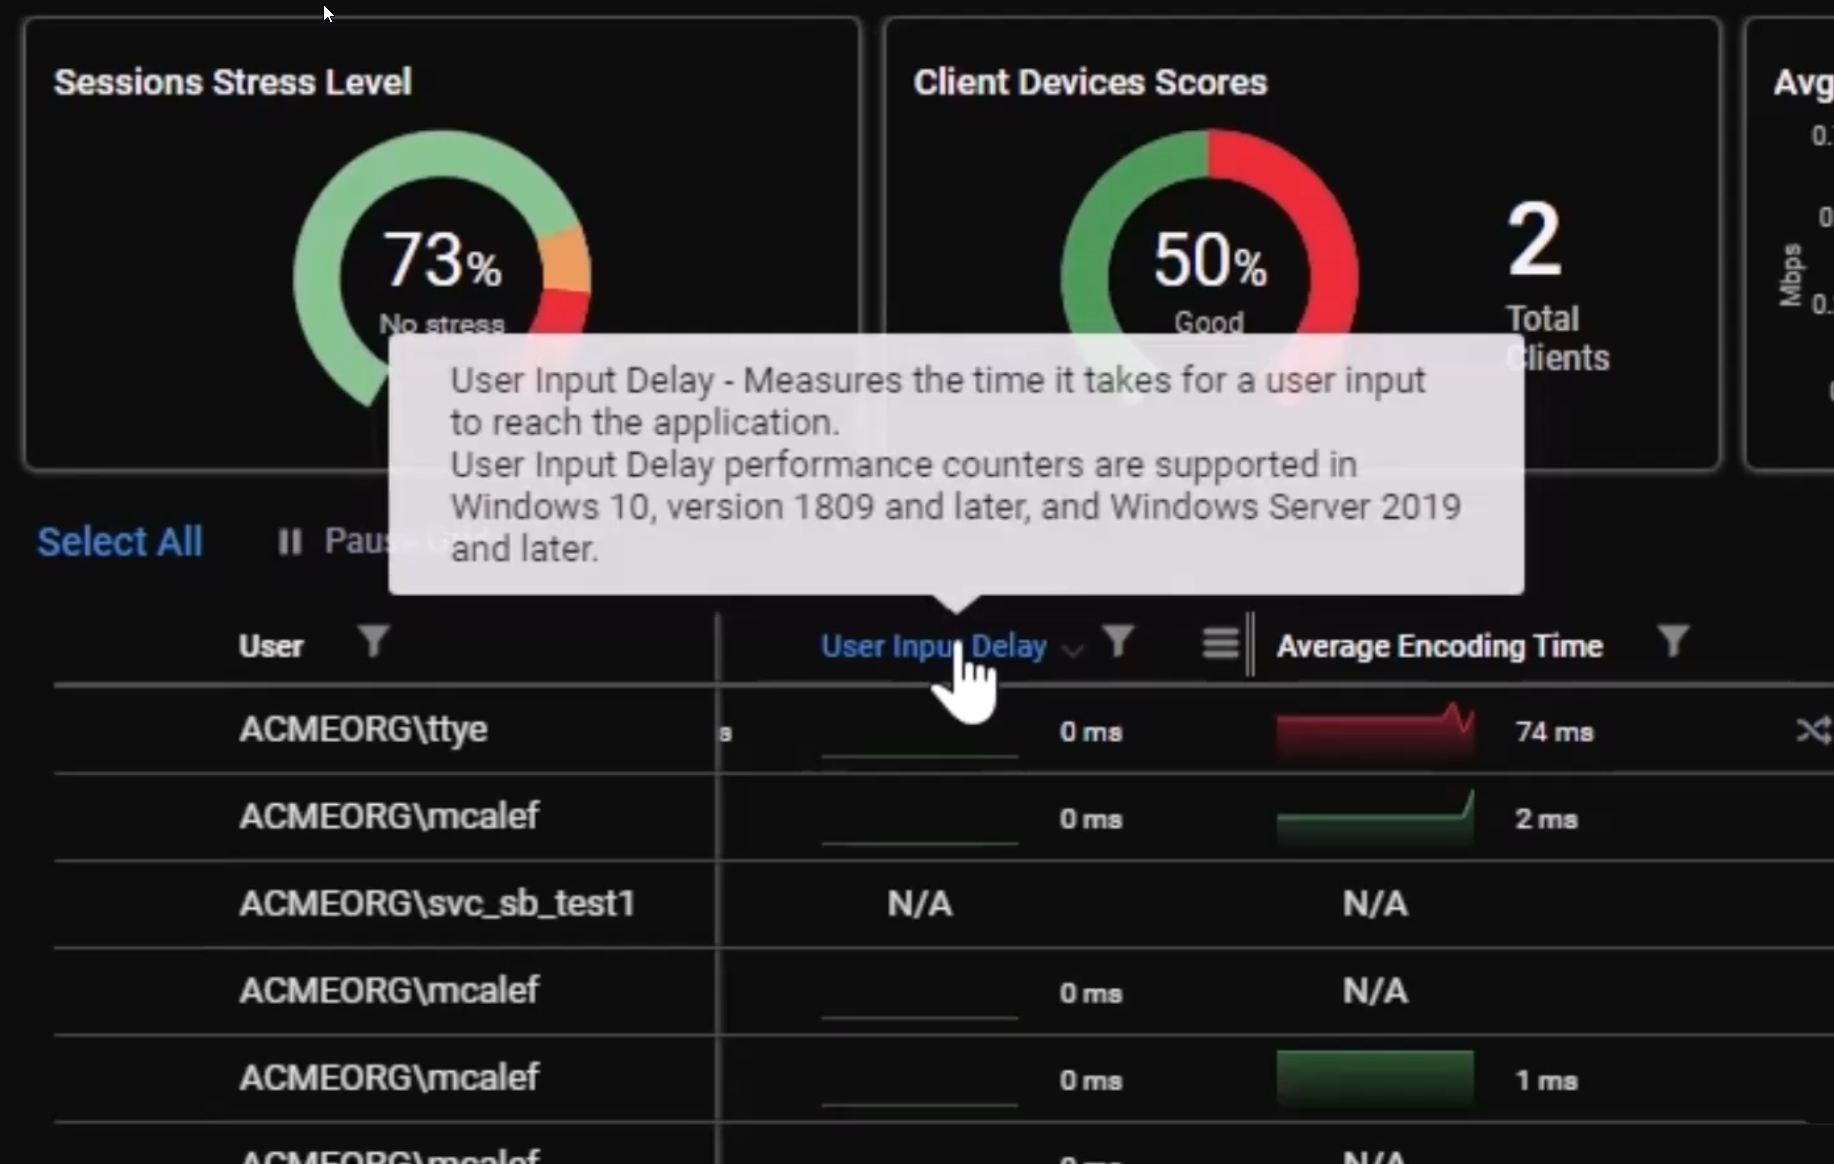
User Input Delay
User Input Delay is the first performance counter visible in ControlUp VDI & DaaS. This metric reports on the interactivity of the foreground application. The higher the value, the more likely the application’s user interface (UI) was locked and unresponsive for that period of time in milliseconds. Microsoft has a great article on how user input delay operates, should you want to learn more. Additionally, I’ve written an article explaining how user input delay differs from Citrix Response Trip Time (RTT). Lower values for user input delay ensure your applications operate at peak efficiency, saving time and money and helping keep the users happy because they are not waiting.
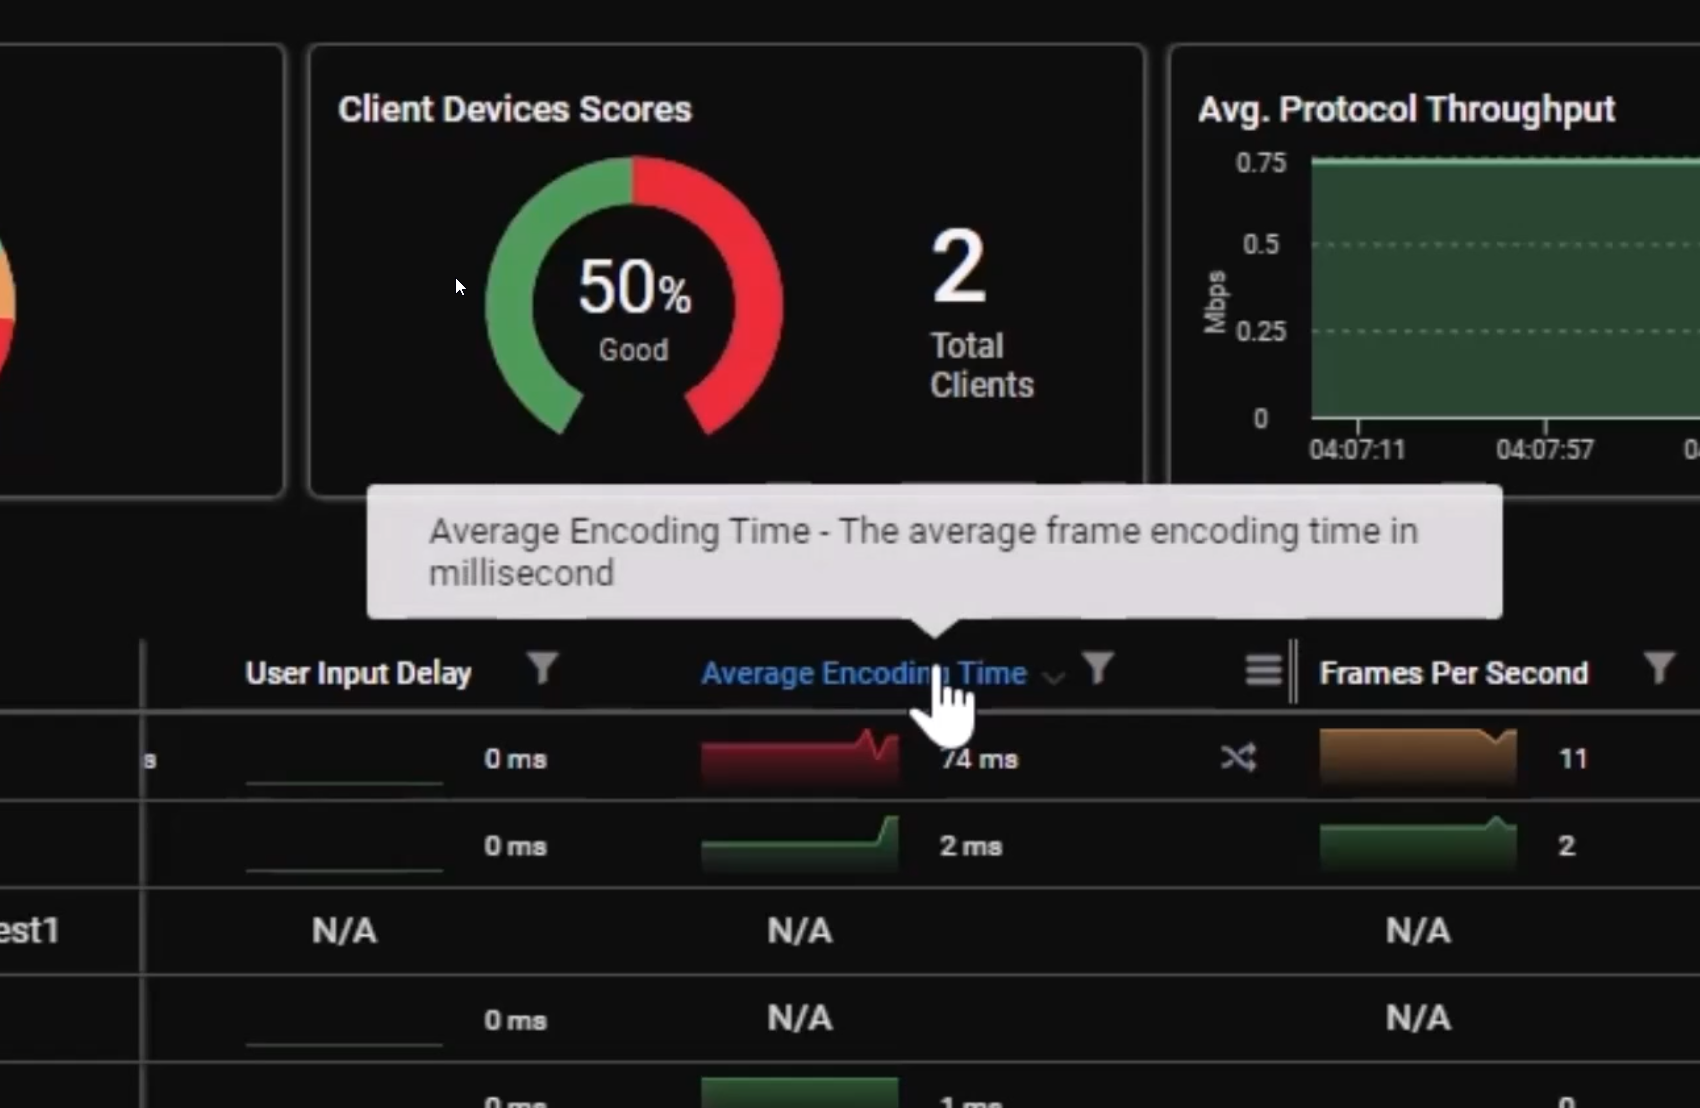
Average Encoding Time
The next performance counter is Average Encoding Time reporting the average time (in milliseconds) it took the Remote Desktop Service to capture a frame over the last second. Microsoft recommends that the Average Encoding Time should be under 33 ms; a higher value means the server struggles to capture the frames. Alternatively, suppose the Average Encoding Time is under 33 ms, but you are still experiencing performance issues. In that case, there may be an issue with the application or the operating system, and you can troubleshoot accordingly.
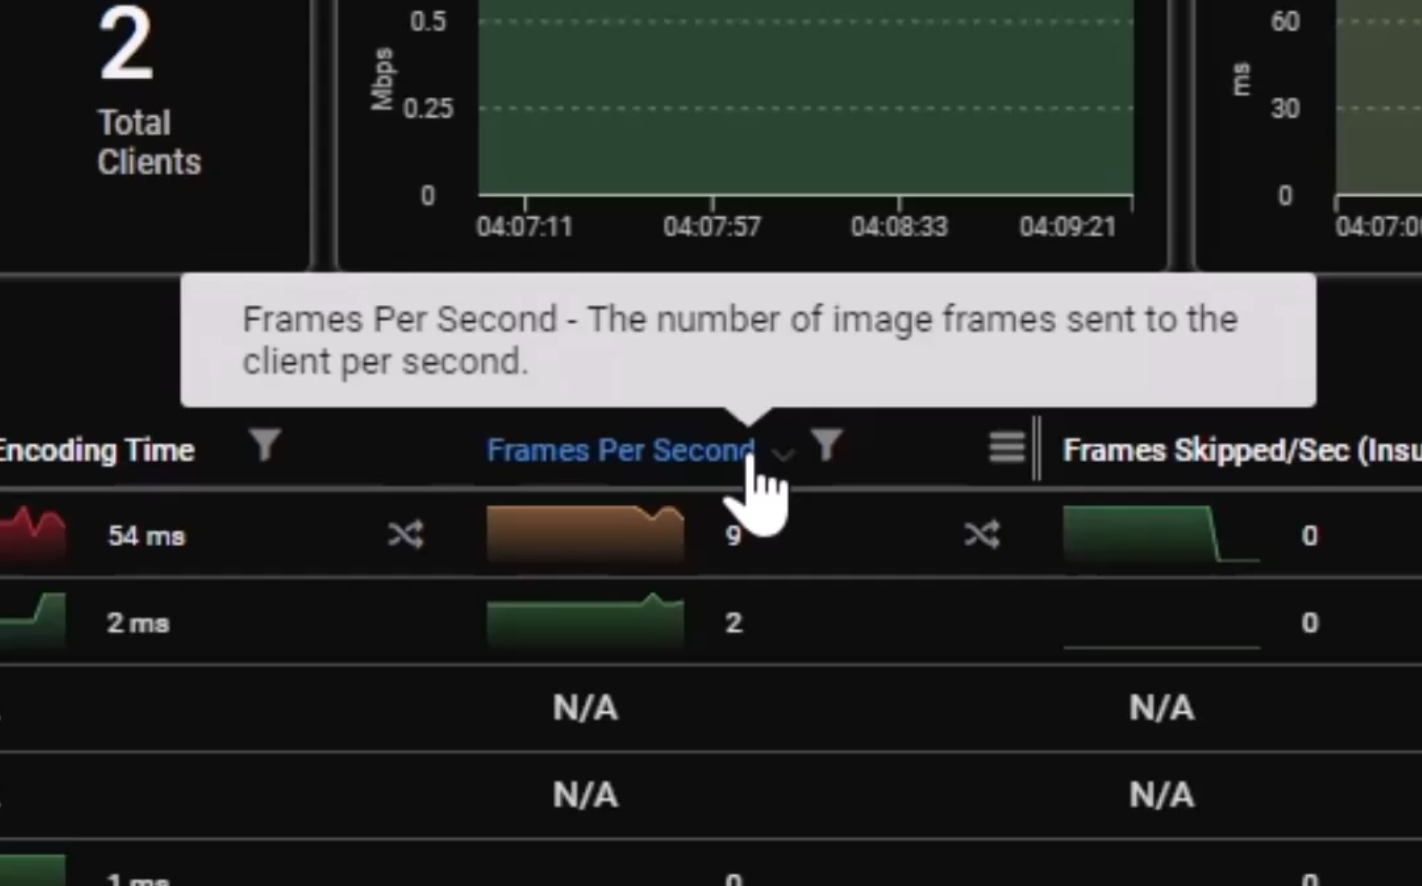
Frames Per Second
Next is Frames Per Second(known as ‘frame rate’). This metric tells how often the local image is captured and sent to the user per second. This metric is dynamic based on the content on the screen. Fast-changing content will require a higher frame rate as more image data is captured to ensure a fluid or pleasant experience. If the content is static, then the frame rate will be lower, reducing the load on the encoder and saving bandwidth. If you have a low frame rate, but the content is fast changing, then you may be experiencing issues and will need to troubleshoot further. Your session host or VDI may lack sufficient processing power with a low frame rate with fast-changing content.
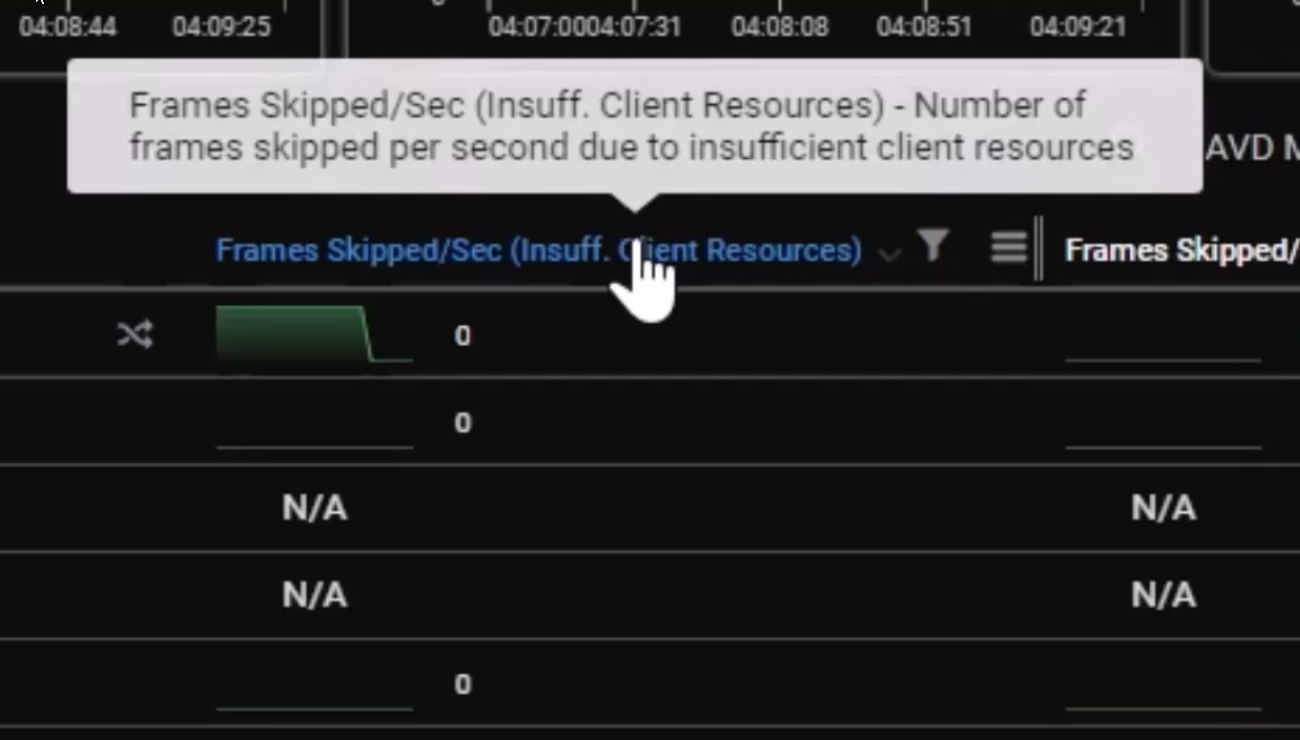
Frames Skipped/Sec
The last performance counters include Frames Skipped/Sec, which occurs when the encoder is overloaded, likely due to high CPU use. To drill-down into what could be causing this issue, we have three types of Frames Skipped/Sec metrics. They include:
- Insuff. Client Resources: This attempts to detect whether the client dropped the frames sent by the server, which can occur if the client is overloaded because of insufficient processing power.
- Insuff. Network Resources: This proves that the network is at fault by disproving that neither the client nor the server dropped the frames.
- Insuff. Server Resources: This detects whether the Azure Virtual Desktop session host has skipped encoding the frame.
To learn more about these performance counters, look at Microsoft’s documentation on diagnosing graphics performance issues in remote desktops. ControlUp allows you to automatically set automated alerts based on these values to notify you of potential performance issues in your environment or to execute a remediation activity.
Get Started
ControlUp was built with the end user in mind. We are excited to bring you the features and capabilities that can save your business’s operating time and costs and deliver the best digital employee experience. For those interested in checking out ControlUp to see how it can benefit your Azure Virtual Desktop or DaaS environment today, either take us for a test drive, download us for free, or schedule a demo to learn more!