
Group Policy can be a tricky beast, even in the best of cases.
When I worked in Healthcare, logon duration was a critical topic. An aggressive idle and disconnect policy meant we had tens of thousands of logons per day. When you have this many logon events, saving a single second per logon can add up to hours of productivity saved each day. To that end, I spent a lot of time investigating what goes into a logon, from measuring third-party components to spending huge amounts of time investigating how Group Policy operates.
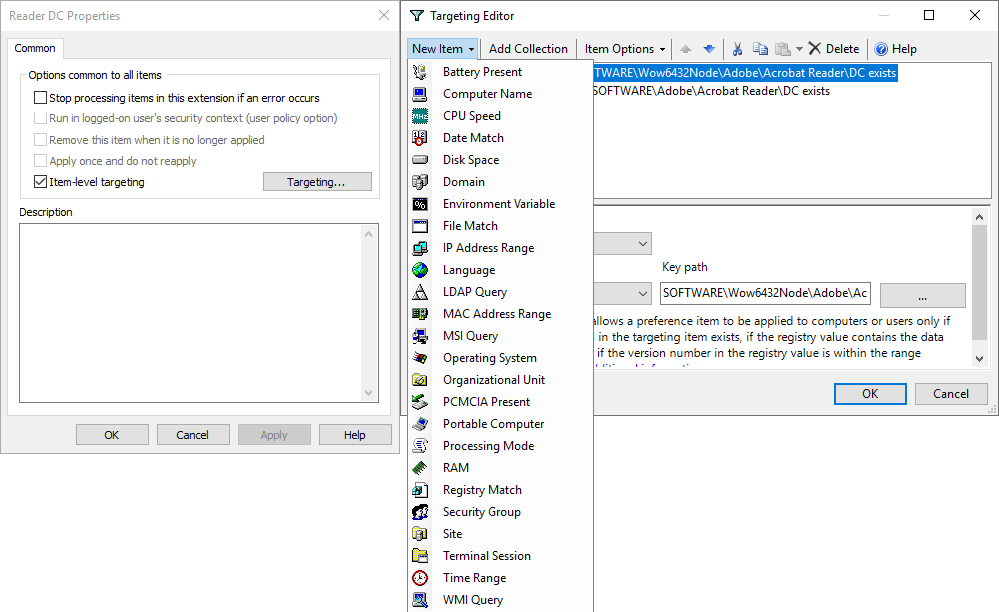
Group Policy Preferences (GPP) is a powerhouse, and we used it a ton. GPP has some robust filtering features, such as filtering on groups of settings or individual settings using a feature called “Item Level Targeting” (ILT). But with great power, comes great responsibility—without understanding how each of these technologies operates, it’s easy to configure something in such a way that it causes a significant delay.
An example of a common misconfiguration in Group Policy Preferences is using the Group Policy Drive Maps feature. This GPP feature operates synchronously, meaning it will delay the logon process until it is satisfied; it will attempt to map the configured network drive for each preference item.
What happens, though, when the target drive mapping isn’t available?
The Group Policy Drive Maps feature will attempt to communicate with the target for a while, and if it can’t, it will time out. The time-out—from my experience—is 20 seconds per mapping. If you have multiple network targets to attach, or multiple Group Policy Objects (GPO) trying to connect to different network drives (and some of those targets are not available), you have some network issue or some other problem, then your logon time can be extended significantly.
But it’s not just drive mapping that causes delays; other group policy preferences extensions can, as well. Item Level Targeting can also cause delays.
Item-Level Targeting involves filters that you apply to Group Policy Preference settings. These include things like checking to see whether files or registry keys exist—you can specify a check to see if a file on a file share exists or you can choose to do a WMI (Windows Management Instrumentation) query. WMI has its own set of challenges where the repository can become bloated and queries take progressively longer to accomplish.
In short, there are lots of things that can contribute to a Group Policy extension causing a delay in your logon process.
If you have a functional Group Policy Object structure with lots of GPOs, then identifying the GPO causing your delay won’t be easy.
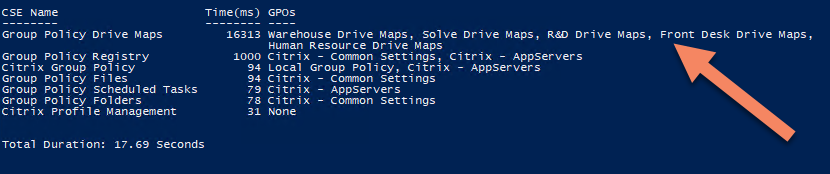
Solutions like ControlUp’s Analyze GPO Extensions Load time script help with this, to some degree, by pinpointing which Group Policy Extension has the longest processing time. But a functional structure can have so many GPOs that it becomes harder to determine which GPO is at fault.
Back in the day, I started an investigation into whether it was possible to measure the duration of a single GPO, either by group policy extension or for the GPO on the whole. I found out it was possible and began developing a script that would produce this output. Unfortunately, I lost that work, but I’ve never been one to give up, so…
This brings us to today! I was able to re-start this work and come up with a solution that measures and displays the duration of the individual GPO and extension.
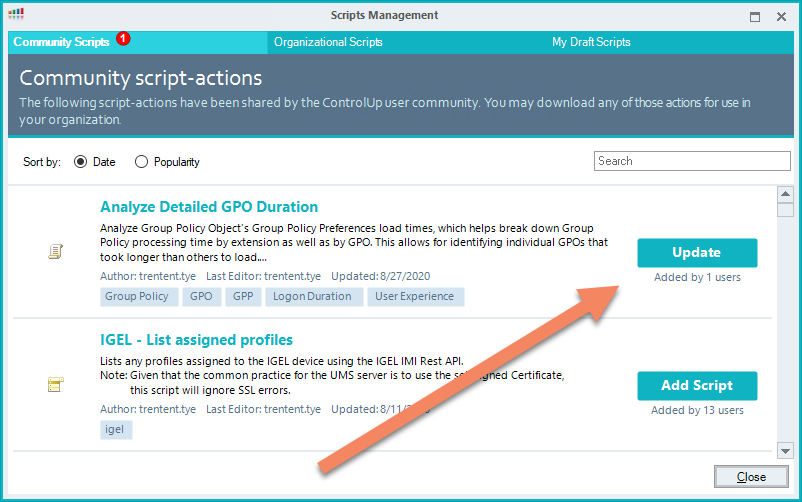
Welcome ControlUp’s newest Script Action: “Analyze Detailed GPO Duration”
Check out the output once you enable the needed logging:
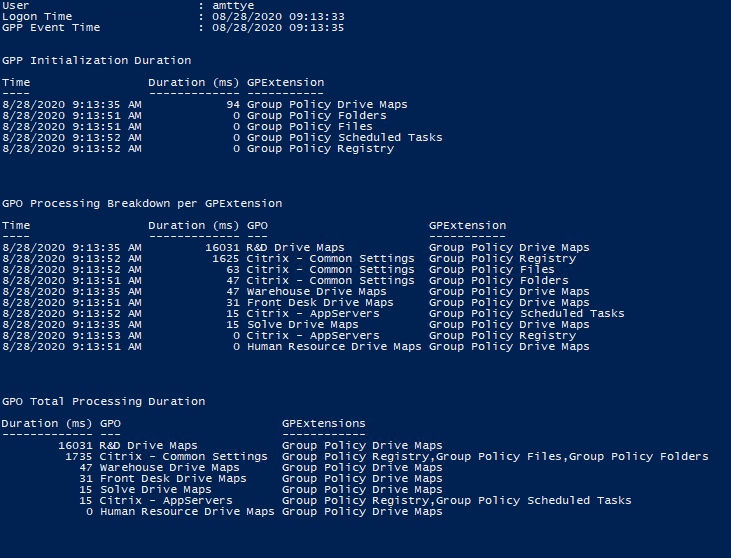
The breakdown operates as follows:
- GPP Initialization Duration: The amount of time it takes the client side extension (CSE) to initialize. This value has been seen to be high if Resultant Set of Policies (RSoP) is enabled.
- GPP Processing Breakdown per GPExtension: The amount of time spent in each CSE for each GPO.
- GPP Total Processing Duration: The total amount of time each GPO took to complete processing.
This can be advantageous (to say the least) for ControlUp’s customers and the community.
Caveats
There are some gotchas, however, about this solution that you should look out for.
It requires that Group Policy Preference Logging is enabled.
In reality, this isn’t that big a deal. The logging feature is pretty performant and doesn’t appear to add additional delays, so leaving it on all the time might be acceptable, but test it in your environment first. Read on for further caveats.
You can enable logging by editing the following Group Policy settings (Computer Configuration > Administrative Templates > System > Group Policy > Logging and tracing) and enabling each item.
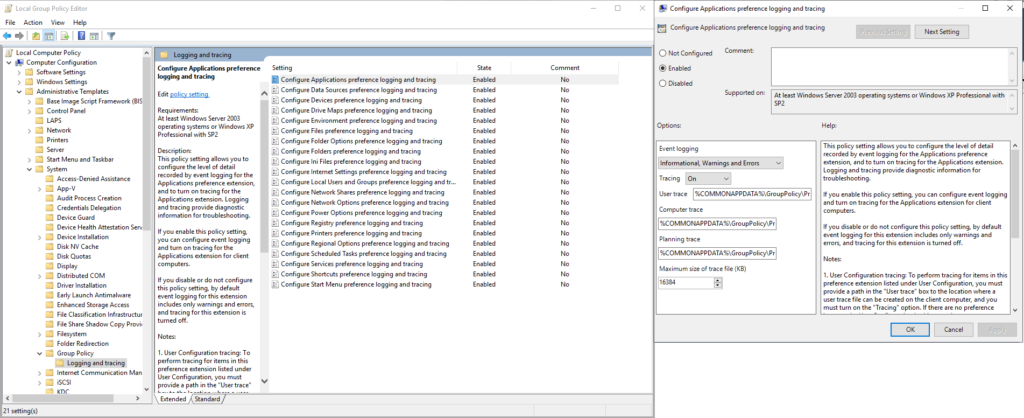
Each item requires that tracing be turned on, and “Informational, Warnings and Errors” be set. Ideally, a sufficiently large log file should be configured—16384KB is the maximum size. I recommend setting it to the maximum size. The script action also has an ‘Advanced Options” field where you can enable logging with all these parameters pre-set.
However, enabling logging for multi-user servers is NOT recommended. The text file generated by the logging can be locked, thereby preventing logons until the lock is released. This means that AV exclusions should be set for the GPP logging files to prevent AV from locking the file while it’s being read. If you have other software that might lock the file then you will need to exclude the log files from that software as well.
Enabling GPP logging for VDI machines? Absolutely! There won’t be multiple users writing to the log file, the maximum size of the log files are 32MB (16MB .log and 16MB .bak), which is tiny in the grand scheme of things.
This leads something else of which you should be aware. If group policy refreshes with regular frequency, the logs can roll over, the result of which is that you lose your performance data. You’d have to measure when the rollover occurs in your environment; my testing has the rollover occurring several hours after logon. You can use ControlUp to generate the output with automated actions shortly after logon to ensure you capture this information without worry about rollover.
Another drawback to enabling logging is that there’s a secondary location where events get recorded. Microsoft also logs Group Policy Preferences events to the event viewer. GPP has been around a long time and Microsoft hasn’t updated the logging to be included in its own event viewer log file; everything is dumped to the Application log. This can amount to a ton of data and the Application log can fill up quickly if you stick to default sizing. I recommend increasing the size of your Application log if you have this feature enabled all the time.
Obviously, your mileage may vary and it’s important to test to ensure logging won’t have an impact on your environment.
All this aside, testing “on the spot” by prepping a machine, enabling the logging, then having the user logon and measure the result should give you the data you need.
About the Analyze Detailed GPO Duration Script Action
This new script action has an “Advanced Options” feature. There are a couple of parameters you can use.
The first is “-enable” which will enable GPP logging on the individual machine. No restart is required and it takes effect immediately. This must be run on an existing session. After running the script, have the user log off and then back on to get your measurements.
The second is “-disable” which disables GPP logging. This must be run on an existing session. After running it, GPP logging will be disabled immediately.
Last is a “-verbose” option that will provide verbose output for troubleshooting the script. Each of these options can only be run individually.