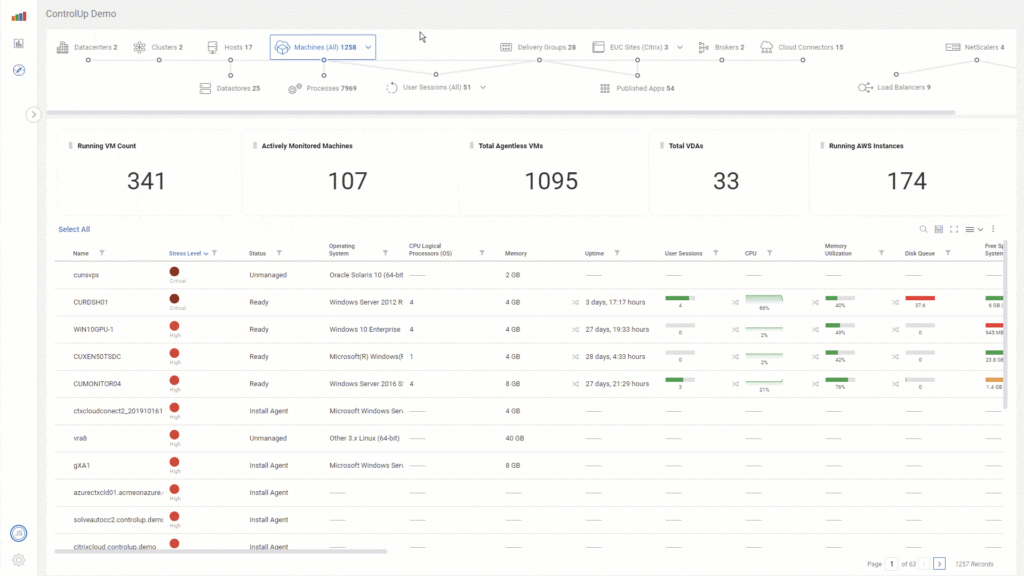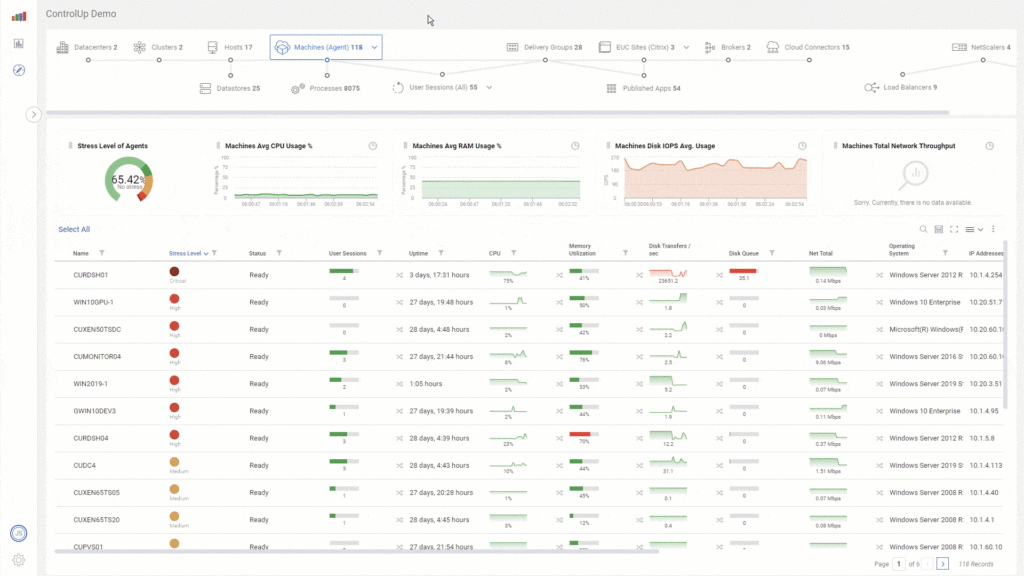
We are excited to introduce ControlUp SOLVE, our new SaaS-based, real-time monitoring console.
ControlUp SOLVE brings not only the comprehensive data that our customers have come to know and love, but also invaluable historical data all quickly and seamlessly accessible from a single SaaS app. SOLVE has been designed to not only be intuitive, streamlined, and to look great, but also to scale effectively for our Enterprise customers.
There are loads of great features in ControlUp SOLVE; we’d love to share some of our favorites. If you’d like to see SOLVE in action, check out the video above. Ready? Let’s dive in.
Navigation at Scale
In my admittedly biased opinion, I think the product looks great, but there’s lots more to SOLVE than just window dressing. It’s a SaaS app, so it’s accessible from anywhere. And by virtue of its design, the SOLVE console works incredibly well at large scale. While the traditional Windows-based ControlUp Console can handle many thousands of hosts, machines, user sessions, and processes, it’s a lot of data for the Console to process. SOLVE has been designed to use the power of the ControlUp monitors to handle data processing far more effectively.
A benefit of the web user interface is how quick and easy it is to navigate between different views and that it can display significantly more interactive data displays to enhance your experience. Seeing a host with high CPU usage and drilling down to a user or system-run process that is consuming that CPU has never been simpler.
Our customers already love the ability to search within the Console today. You can search quickly within SOLVE, too. But you can also filter the many columns and, best of all, you can combine your search with a column filter or combine multiple filters, as you can see in the video above. We have made the data even more digestible.
Topology View

Our new topology view has been turning some heads. It offers a really neat visual of the different layers in your virtualization and EUC stack, and also a quick way to see data on all relevant resources in your organization with just a single click. Would you like to see all of your Citrix Delivery Controller services’ health and other data? Just click on the Delivery Controllers icon, want to check to see if your Citrix Cloud Connectors require a version upgrade? Just click on Cloud Connectors.
If you want a folder-level view like you get in the ControlUp Console, SOLVE has that, too. It’s loaded with options, and navigating the rich data available is a snap.
Actionable Data
I just mentioned that you can quickly see critical information—like your Citrix Cloud Connectors being out of date—to take action. The console is full of great data like this. If you are a VMware customer, for example, you may find the VMTools data valuable. With it, you can see, with just a glimpse, when VMTools needs to be upgraded and, better yet, we have a script that allows you to simply right click and run that script to upgrade VMTools. This is awesome for management servers like your Citrix Delivery Controllers, VMware Connection Servers, DHCP servers, and more.
Some IT shops are quite siloed. Those on the EUC team may not be the ones patching the ESXi hosts, so having that info to hand can be useful. This is just one small example, but there are lots more.
Historical Data

SOLVE doesn’t just show the real-time data that is so valuable, but also some historical data right from the same UI. When you see a machine showing high CPU usage, right from that metric, you can open up an expanded historical view up to 72 hours. If you’d like to see machine- or host-level historical data, you can do that easily by right clicking on the name of the host or machine and clicking view history. This will provide you graphs to see how resource utilization has trended over the last 24 hours, 72 hours, one week or even one1 month.
Our customers already love the historical data they get via ControlUp Insights. With SOLVE, you will see some historical data that has not been displayed in Insights. For example, you can now see historical data for the Free Space on Your System Drives. If you see a machine with low disk space in SOLVE and you’re wondering if the disk is getting filled up, you can view that historical data to figure out why and to see how gradually or suddenly the disk space was consumed. Then? You can take the correct action.
Centralized Auditing
For the first time, we are providing a comprehensive audit log showing all actions and events within your ControlUp organization. This provides you with incredible visibility and oversight into the day to day running of your organization. For example, you can check the audit logs to see what Script Actions were run in the previous 24 hours, week or more and see who ran them. Or even see which script actions were run as Automated Actions to ensure your automation is working as expected plus much more!
SAML
One last advantage to the availability of the data via the web is that we can empower you to set up SAML for your authentication. We support various Identity Providers and believe our customers will love the convenience of single sign-on (SSO) support for accessing all of the awesome data ControlUp provides.
ControlUp SOLVE. It’s an entirely new way to monitor at scale, to deliver a best-in-class user experience, and to do it all while keeping your lives simple and pain-free.
